1398
Three-Dimensional Ultrashort Echo Time(3D UTE) MRI of Achilles Tendon at 4.7TMRI With Comparison to ConventionalSequences in an Experimental MurineModel of Spondyloarthropathy1CNRS, UMR 5536, Université de Bordeaux, bordeaux, France
Synopsis
Unlike bSSFP T2 sequences, 3D-UTE sequences enable visualization of normal enthesis anatomy and early detection of abnormalities in pathological conditions.
MSK research
Background:
Due to the very short T2 of its components, the normal anatomy of Achilles enthesis is impossible to definewith “conventional” long echo time (TE) T2 sequences. However, this is a common site affected by rheumatologic disease.Early abnormalities related to inflammatory processes are impossible to detect in this location.
Purpose: To assess the feasibility of a 3D-UTE (ultrashort echo time) sequence to evaluate normal and pathological Achil-les entheses, determining both anterior fibrocartilaginous and posterior collagenic portions at 4.7T, in a rat model of spon-dyloarthropathy (SpA) with histological correlation. To assess whether this sequence detects SpA enthesopathy prior tolong TE T2 sequences, enabling disease monitoring.
Study Type: Prospective case–control study.
Animal Model: Twelve immunocompetent Wistar male rats imaged before (controls); the model was induced in eight rats(16 tendons) imaged at day 6, day 13, and day 21 with regular sacrifice for ex vivo imaging and histological correlation.
Field Strength: 4.7T Bruker Biospec Systems. 3D balanced steady-state free precession (bSSFP) and 3D-UTE sequences,performed at baseline (day 0, n = 12 animals / 24 tendons), day 6 (n = 8/16), 13 (n = 4/8), and day 21 (n = 2/4).
Assessment: Visual analysis and signal intensity measurements (signal to noise ratio, SNR) of both bSSFP and UTE imageswere performed by two independent musculoskeletal radiologists at different locations of the Achilles enthesis andpreinsertional area.
Statistical Tests: Normal and pathological rat values were compared by Wilcoxon signed-rank tests, as well as interobser-ver differences. MRI findings were compared against histological data.
Results: The 3D-UTE sequence identified the anterior fibrocartilage and posterior collagenic areas of Achilles entheses inall cases. Visual analysis and signal intensity measurements distinguished SpA-affected entheses from healthy ones at days6 and 13 (P = 0.002 and P = 0.006, respectively). Neither the normal anatomy of the enthesis nor its pathological patterncould be identified on T2 bSSFP sequences.Data
Conclusion: Unlike bSSFP T2 sequences, 3D-UTE sequences enable visualization of normal enthesis anatomy andearly detection of abnormalities in pathological conditions.
Acknowledgements
We would like to thanks D. Verdier, A. Perozziello and O. Thibaudeau for their fruit full collaboration.References
Gatehouse PD, Bydder GM. Magnetic resonance imaging of short T2components in tissue. Clin Radiol 2003;58:1–19.
Han M, Larson PE, Liu J, Krug R. Depiction of Achilles tendon microstruc-ture in vivo using high-resolution 3-dimensional ultrashort echo-timemagnetic resonance imaging at 7 T. Invest Radiol 2014;49:339–345.
Hodgson RJ, Grainger AJ, O’Connor PJ, et al. Imaging of the Achillestendon in spondyloarthritis: A comparison of ultrasound and conven-tional, short and ultrashort echo time MRI with and without intravenouscontrast. Eur Radiol 2011;21:1144–1152.
Figures
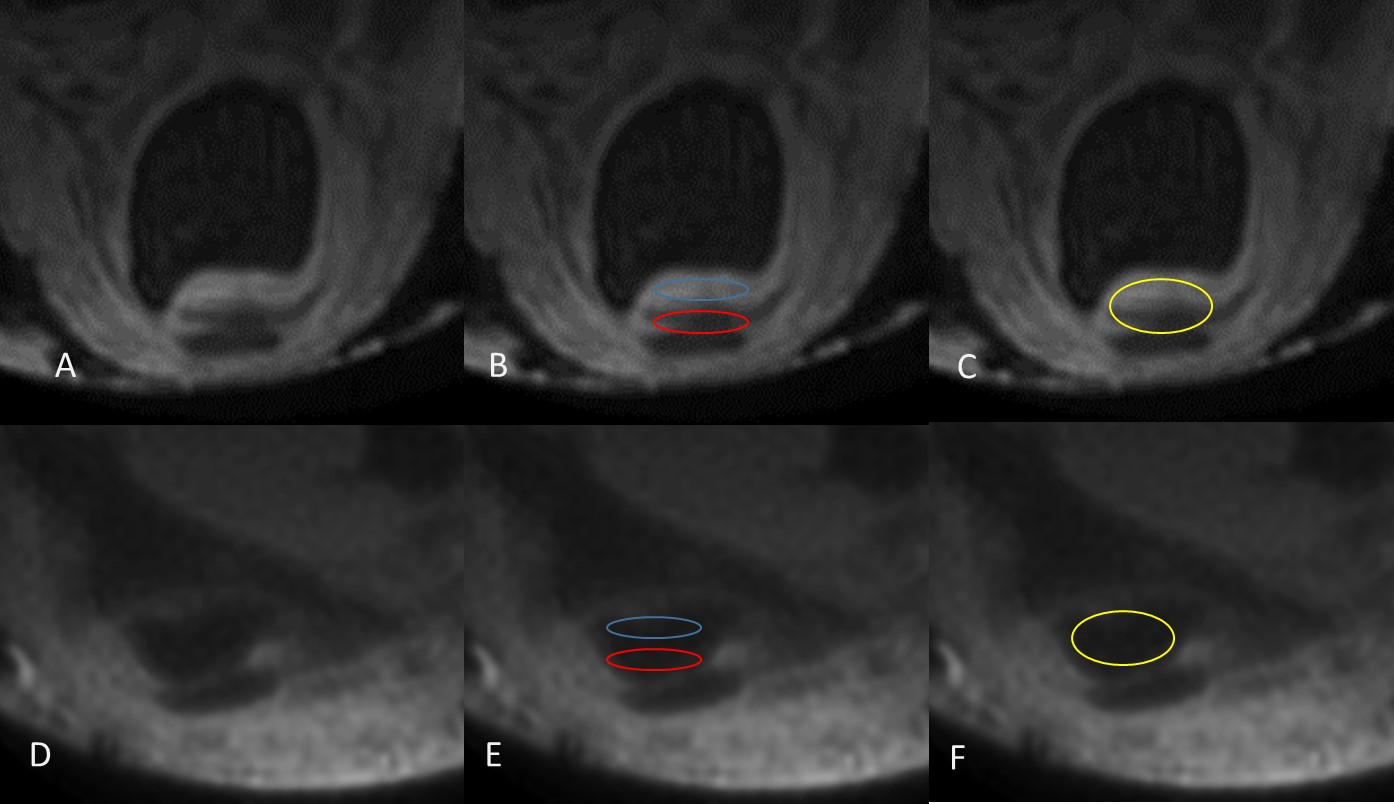
Image 1
Example ROI for each region in an axial ex-vivo 3D UTE-w acquisition for enthesis (A-C) and pre-insertional tendon (D-F) at D0. Three regions-of-interest (ROI) were placed in the enthesis (A-C): one in the anterior fibrocartilage (blue circle), one in the posterior collagenic portion (red circle) and a third one covered the entire zone (yellow circle) (Figure 1 A-C). The exact same procedure was performed in pre-insertional anterior area (blue circle), the posterior area (red circle) and the entire zone (yellow circle) (Figure 1 D-F).
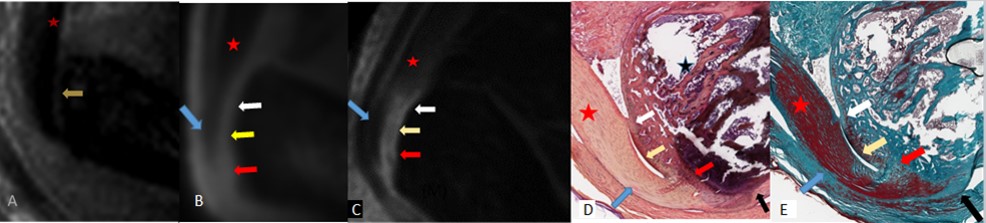
Image 2
Sagittal bSSFP (A), 3D UTE-w acquisition sequence with focus on enthesis area on in-vivo (B) and ex-vivo assessment (C) at D0. Correlation with histology in the same normal rat at D0: HE (D) and TM (E). Anterior part of the enthesis looks brighter than the posterior part on in-vivo and ex-vivo assessment in UTE sequences but not in bSSFP acquisition. Pre-insertional tendon (red star) and enthesis: sesamoid-fibrocartilage (yellow arrow), periosto-fibrocartilage (white arrow), entheso-fibrocartilage (red arrow) and fibrous enthesis (blue arrow) in a normal Achilles tendon.
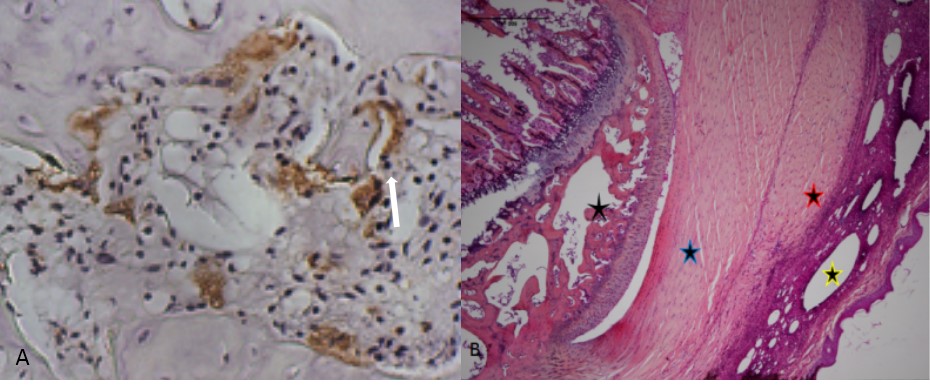
Image 3
A: Positive ED1 immunohistochemistry (MagnificationX200) in SpA enthesitis in previous phase (Day 6). Tissue showing macrophages (white arrow), confirming the efficiency of the model. B: Focus on previous enthesis area: Sagittal slide in HE in a pathological Achilles tendon with tendinosis in the fibrocartilage (black and blue star) also in the posterior part (black and red star) of the tendon near to the injected local area of the Freund adjuvant (black and yellow star) at Day 6. Calcaneum: black star.