1396
T1 and T2* relaxation parameter mapping of the patellar and quadriceps tendon by using ultra-short echo-time (UTE) imaging at 3T1Medical Physics Group, Institute of Diagnostic and Interventional Radiology, Jena University Hospital, Friedrich Schiller University, Jena, Germany, 2Michael Stifel Center for Data-driven and Simulation Science Jena, Friedrich Schiller University, Jena, Germany, 3Abbe School of Photonics, Friedrich Schiller University, Jena, Germany, 4Center of Medical Optics and Photonics, Friedrich Schiller University, Jena, Germany
Synopsis
The tendon tissues in the knee are characterized by a short T2 relaxation time due to their fibrous structure and their high collagen content. Conventional MRI technique are unable to pick up such fast decaying signal, thus new methods and sequences such as UTE have been introduced. In this work a 3D UTE sequences was applied to quantify the T2* and T1 relaxation parameters for the patellar and quadriceps tendons.
Purpose:
Due to their short T2 relaxation time it has been proven rather difficult to recover signal intensity in tendons and consequently to perform quantitative analysis to quantify the relaxation parameters for this type of tissue. This is probably one of the reason behind the very limited literature on the topic. The aim of this work was to use a 3D UTE1 sequence to quantify both T2* and T1 in the patellar and quadriceps tendons. In the case of T1 quantification, in particular, two different analysis methods were applied on the dataset in order to compare the obtained results and further prove the robustness of the results.Materials and Methods:
In total six healthy volunteers (age: 24-50 years) were examined with a 3T clinical MRI system (Siemens, Magnetom PRISMA) using a 16 channels Noras flexible coil wrapped around the examined knee. T2* relaxation time maps were estimated by a mono-exponential fitting from a multi-echo 3D UTE sequence that acquired the following echo times (0.1 ms, 2.5 ms, 4.9 ms). T1 relaxation time maps were calculated both via a Variable Flip Angle (VFA) with different FA (7 °, 12 °, 20 °, 30 °, 47 °) and a Variable Repetition Time (VTR) approach with different TR (8 ms, 16 ms, 30 ms, 50 ms, 80 ms). The VFA dataset were acquired with a TR of 20 ms while the VTR dataset was acquired with a flip angle of 25°. T1 values were estimated by fitting the FLASH signal equation to the VTR and VFA data. Both measurements were performed without fat saturation to avoid any influence of the off-centre fat saturation pulse on the broad spectra of the tendons short T2* component. Other acquisition parameters were the following: 1562 Hz/Pixel bandwidth and a 80 x 61 x 50 acquisition matrix size with a 160 x 123 x 100 mm³ field of view, generating an isotropic spatial resolution of 2.0 x 2.0 x 2.0 mm³. All the previously listed acquisition parameters remained the same for both the VFA and VTR dataset. The total acquisition time was of 40 min. Image Reconstruction, fitting and analysis of the data were performed off-line with a script in Matlab.Results:
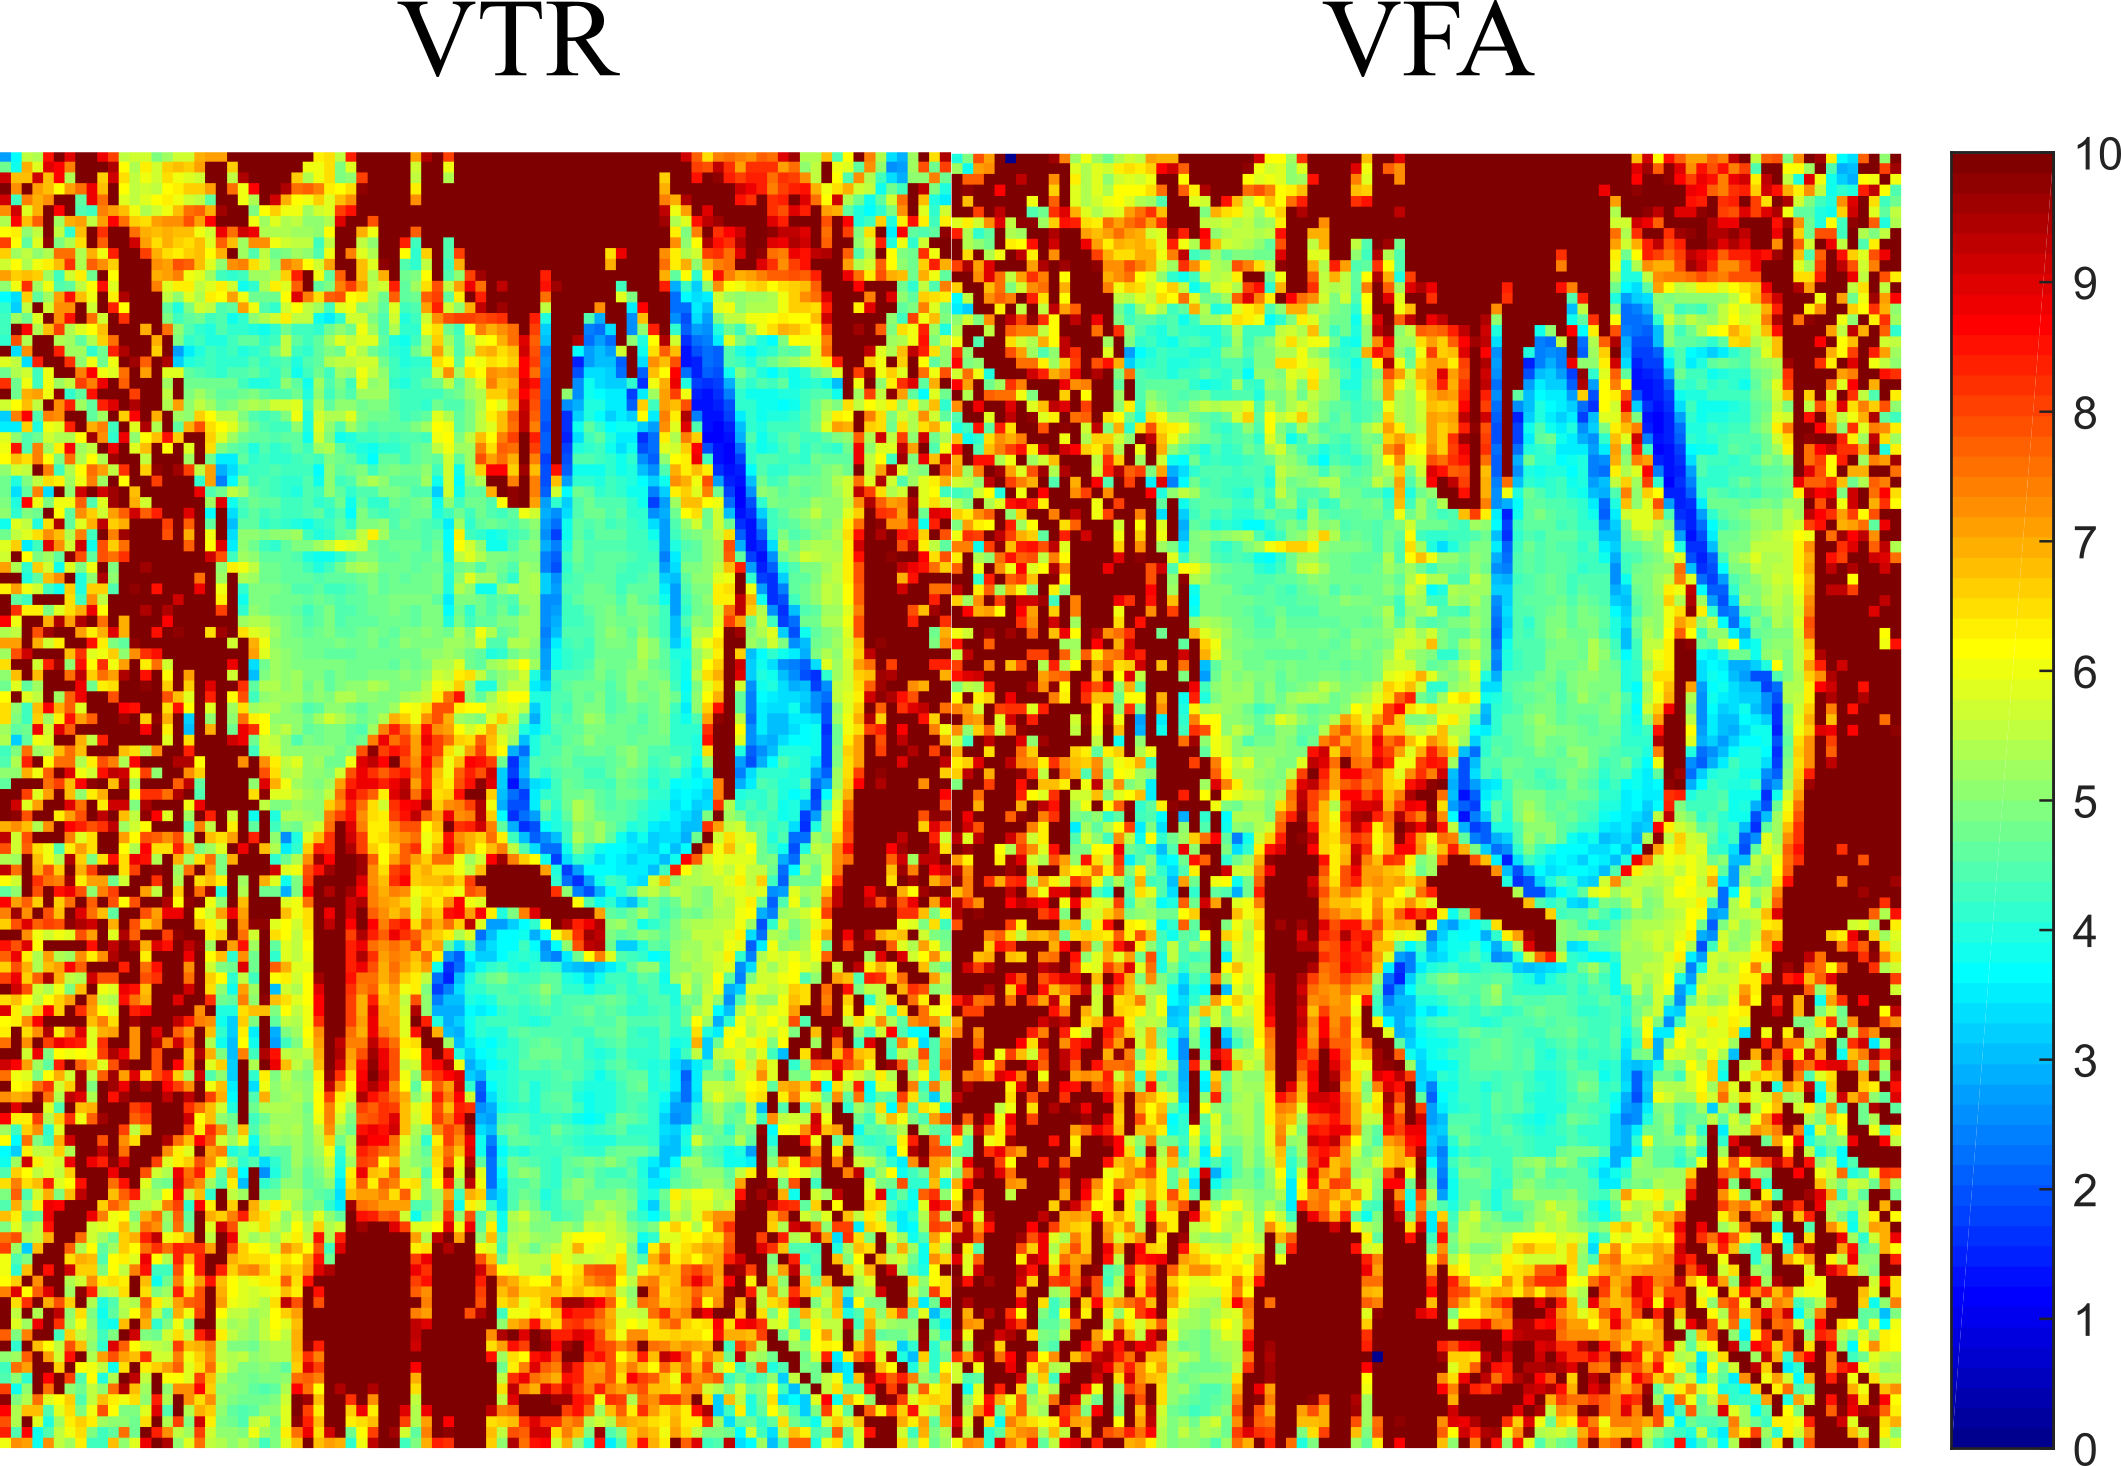
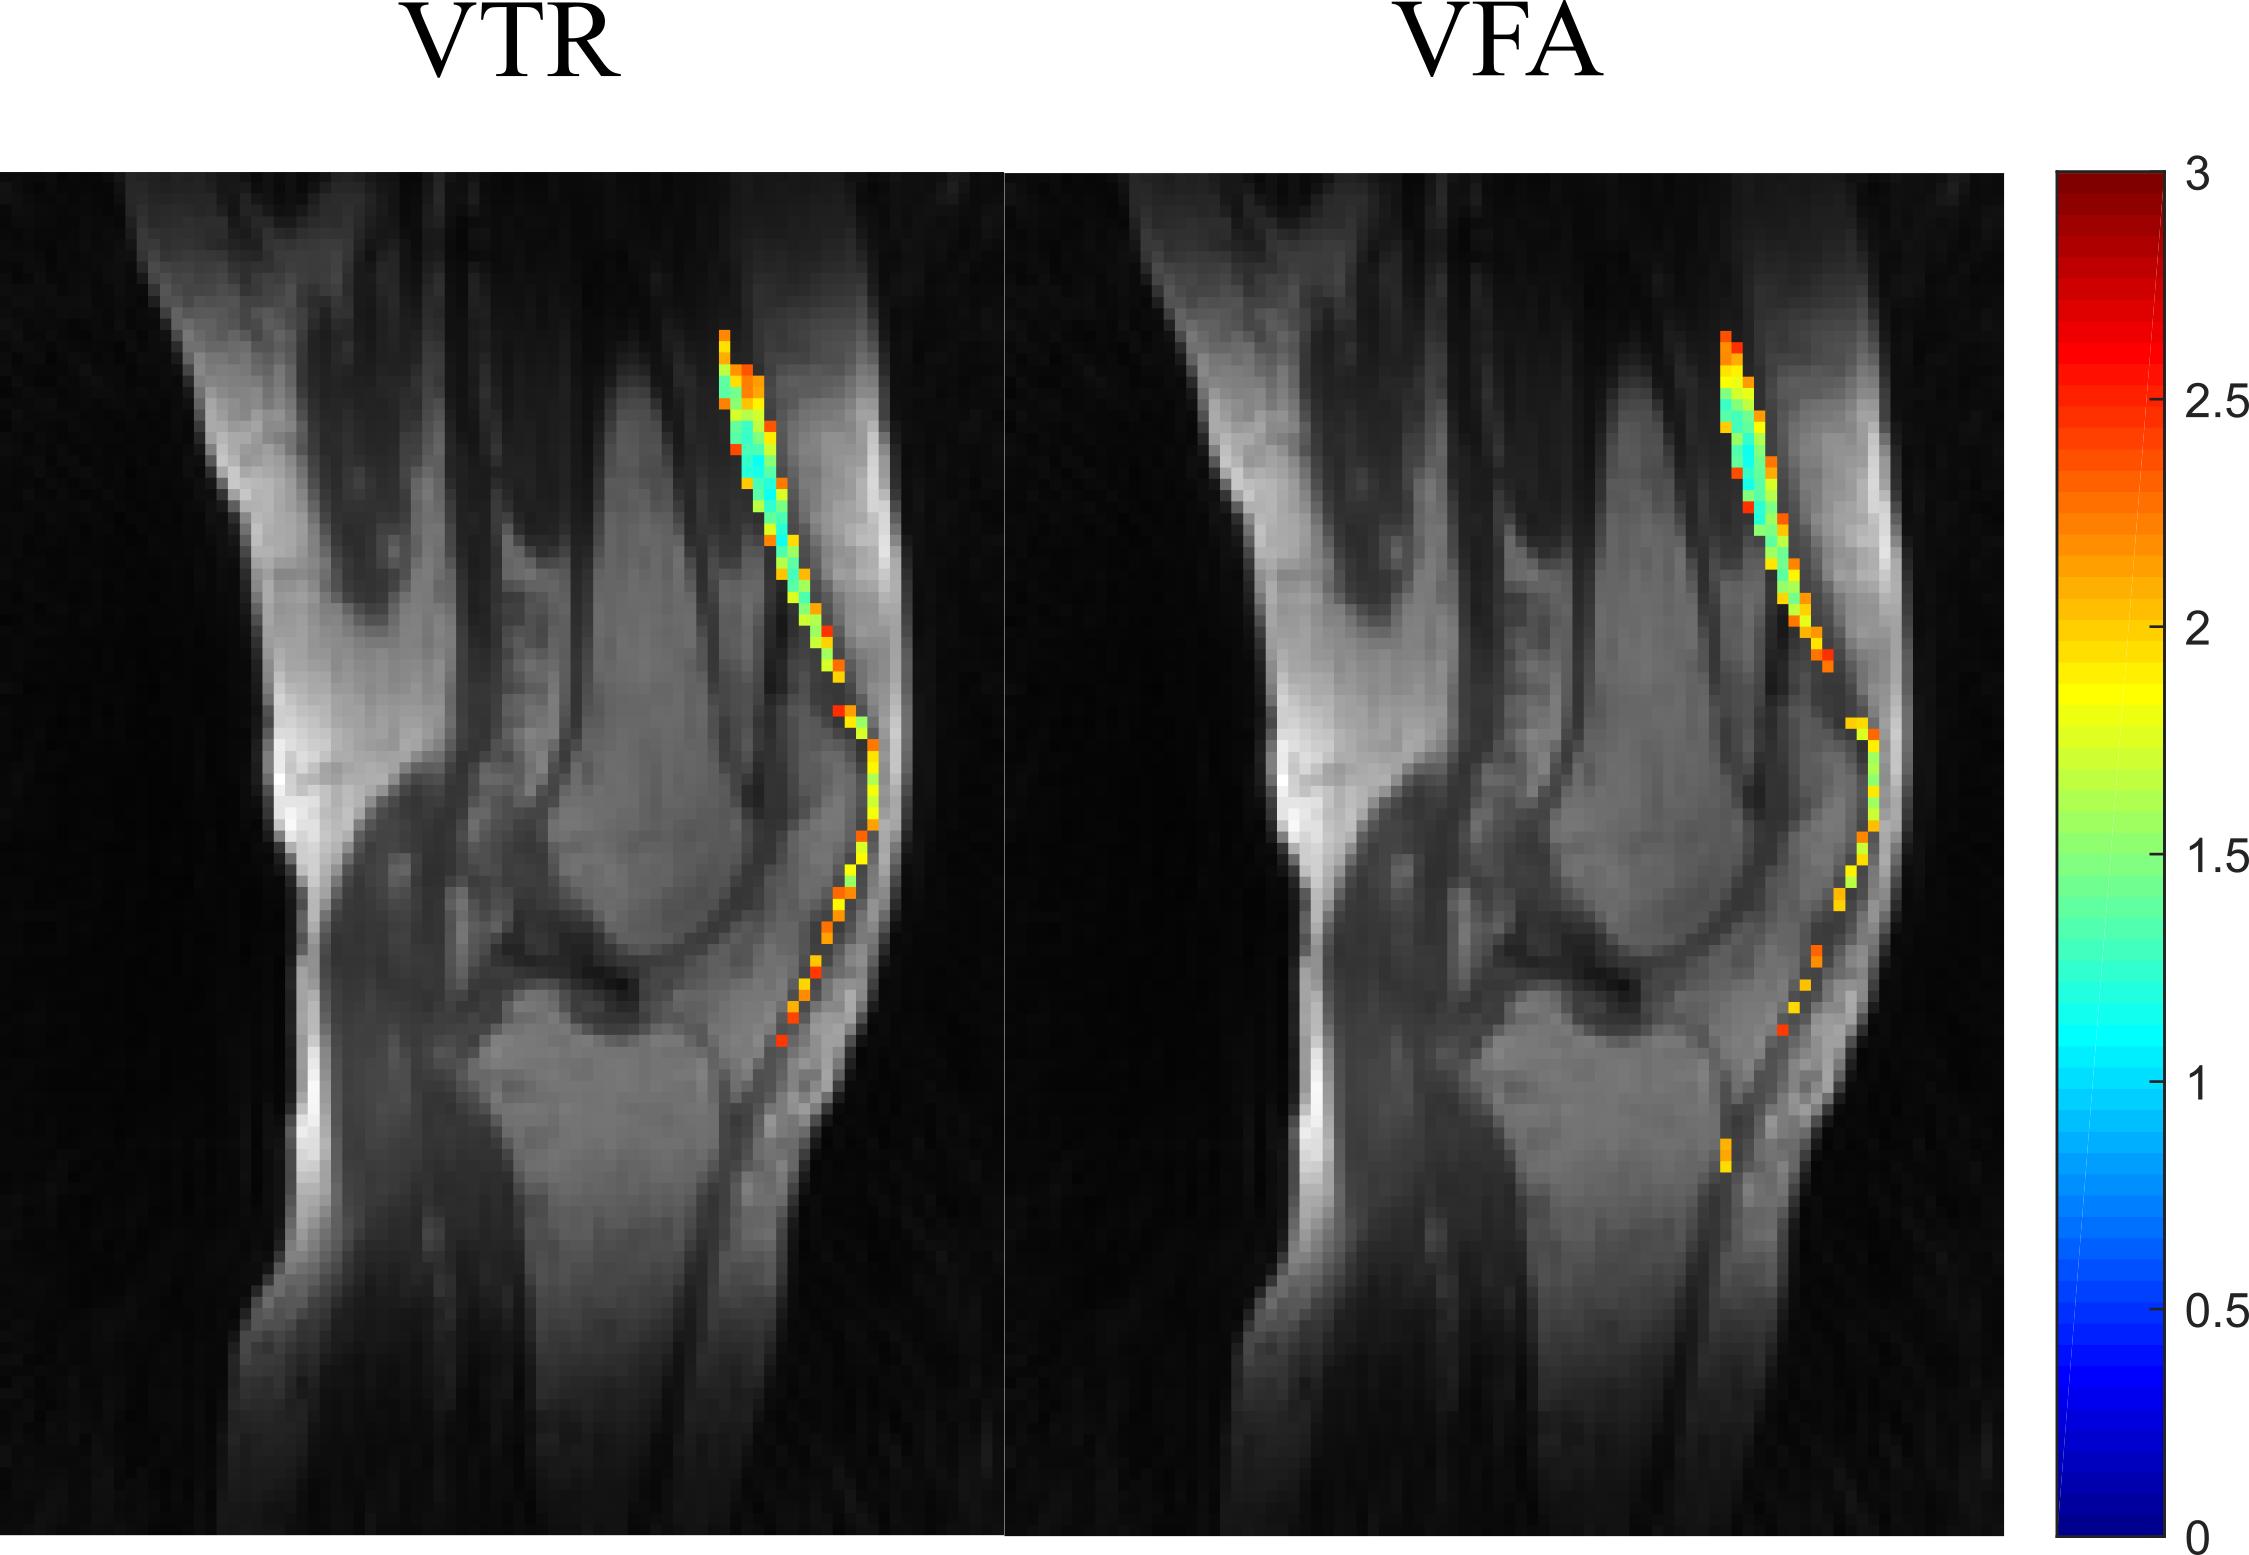
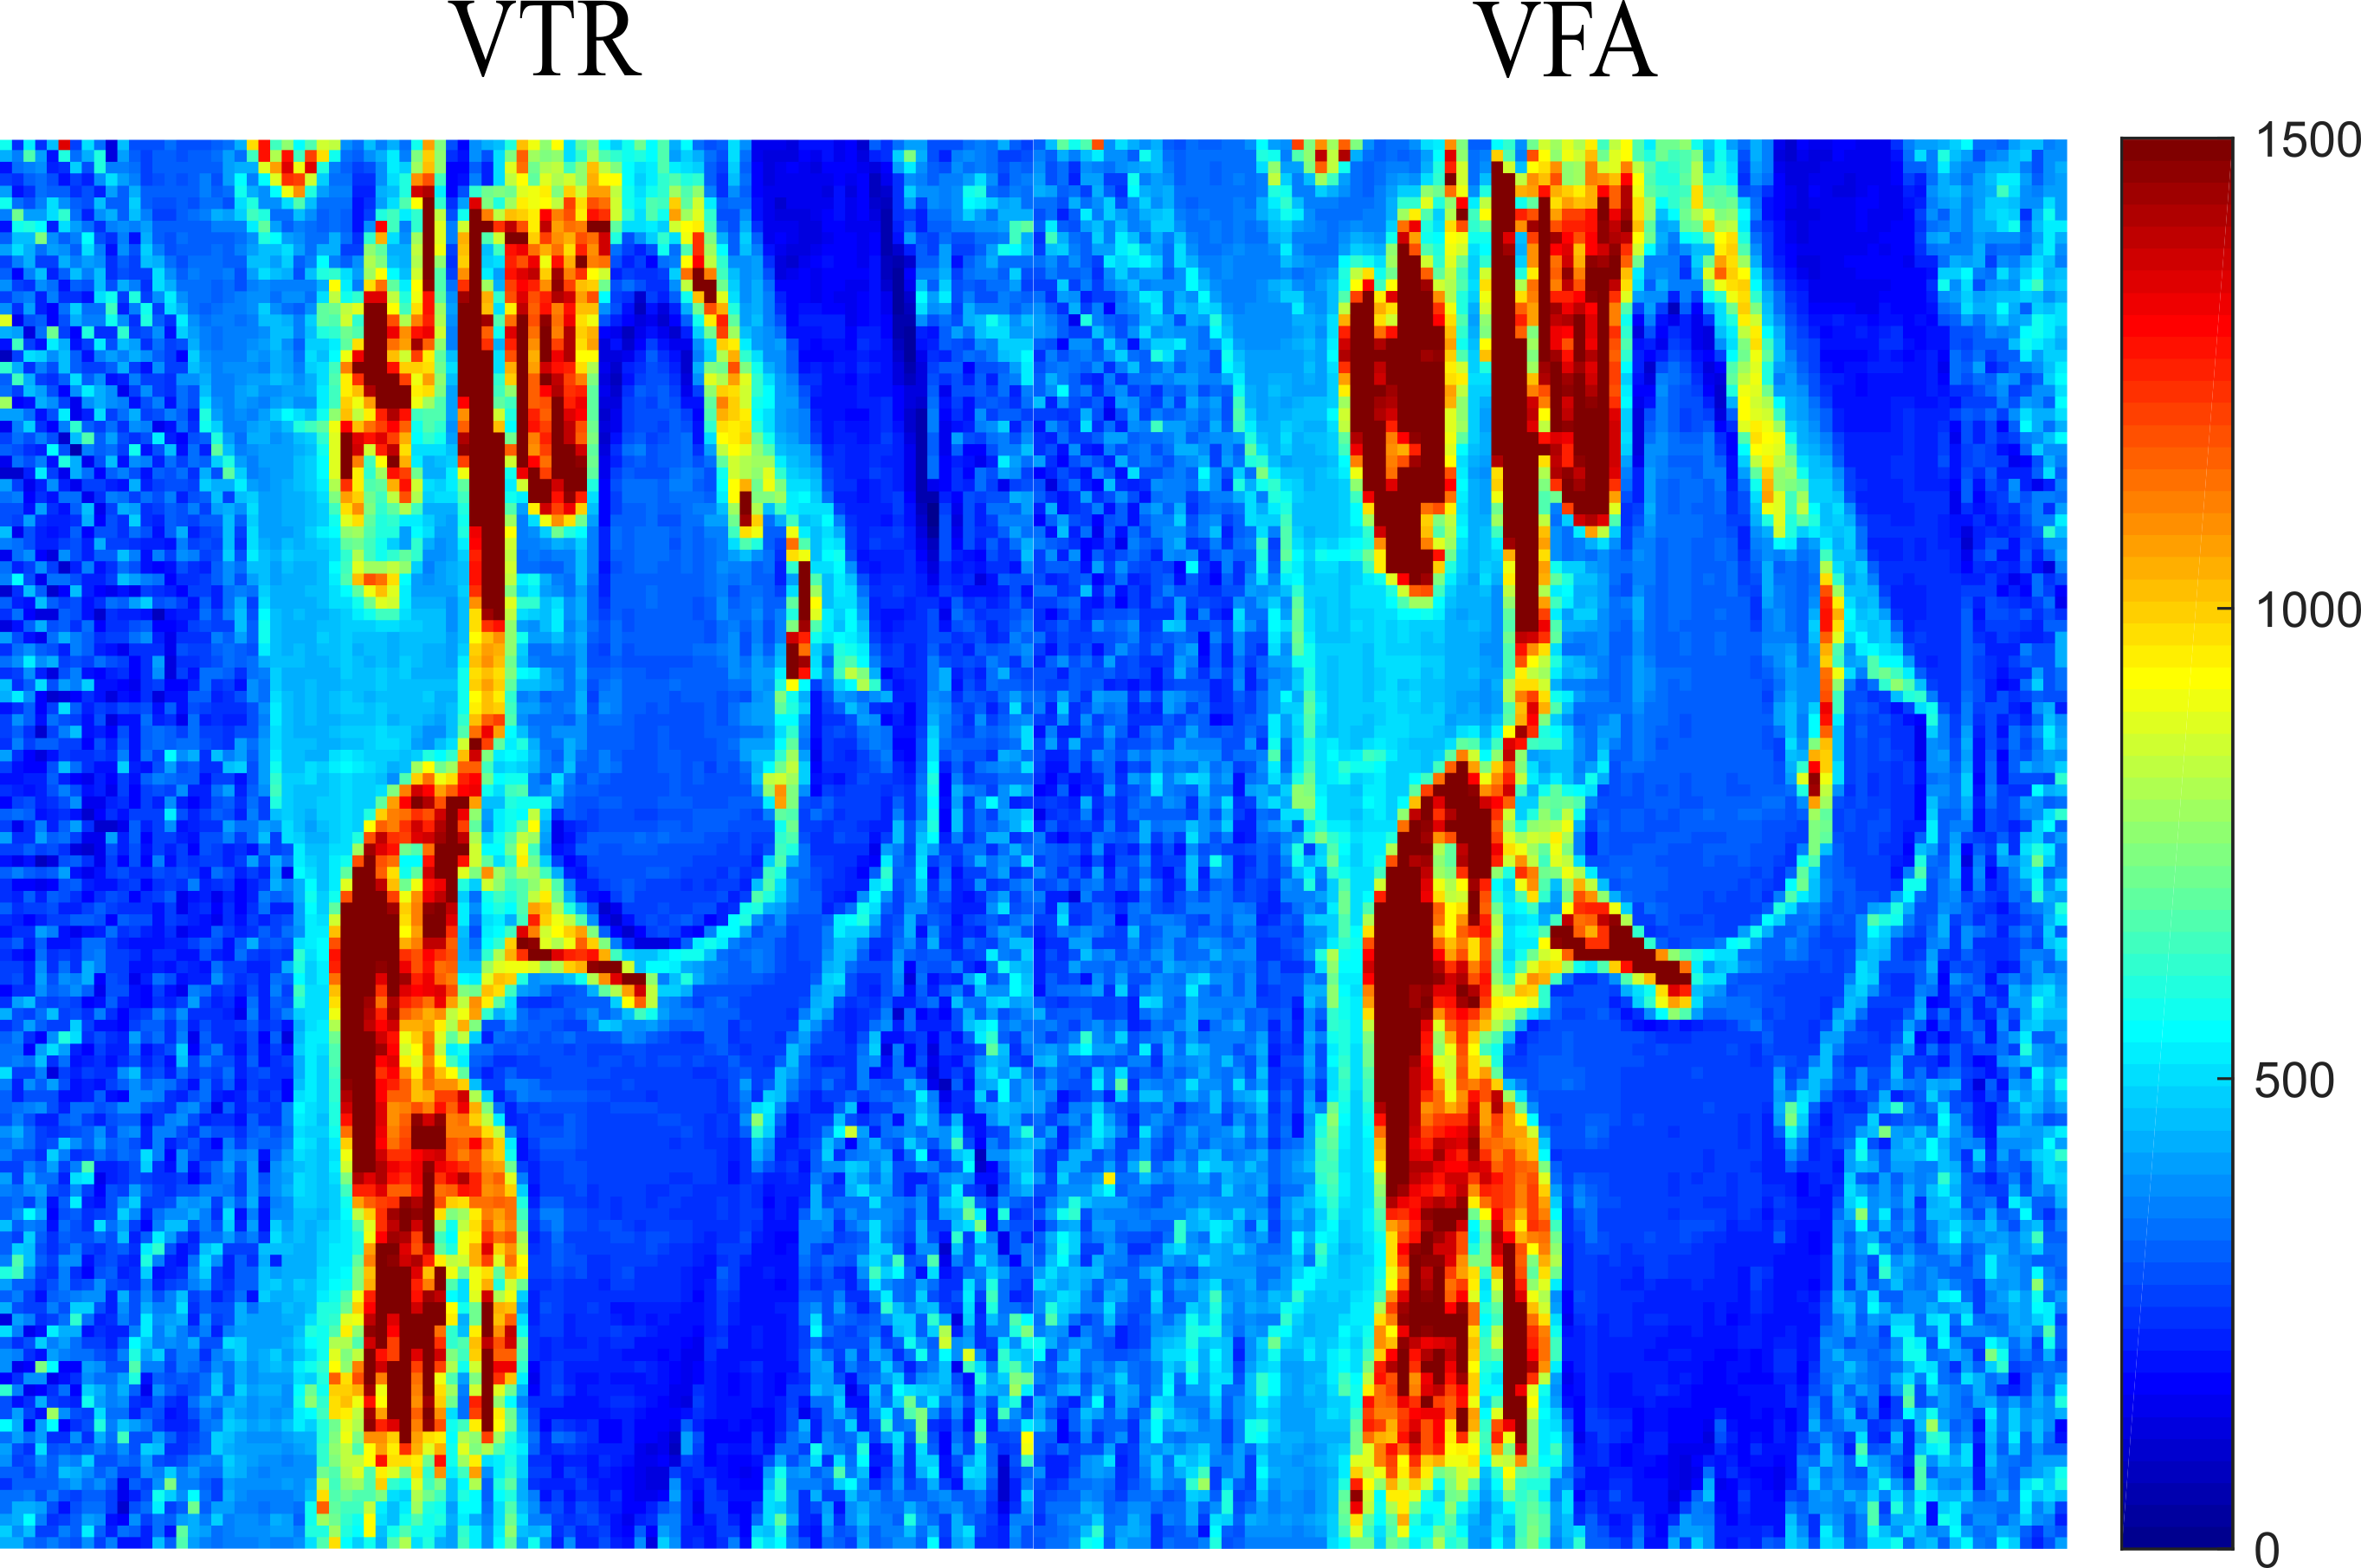
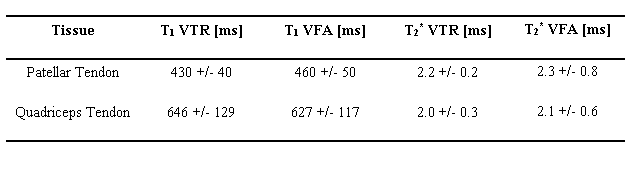
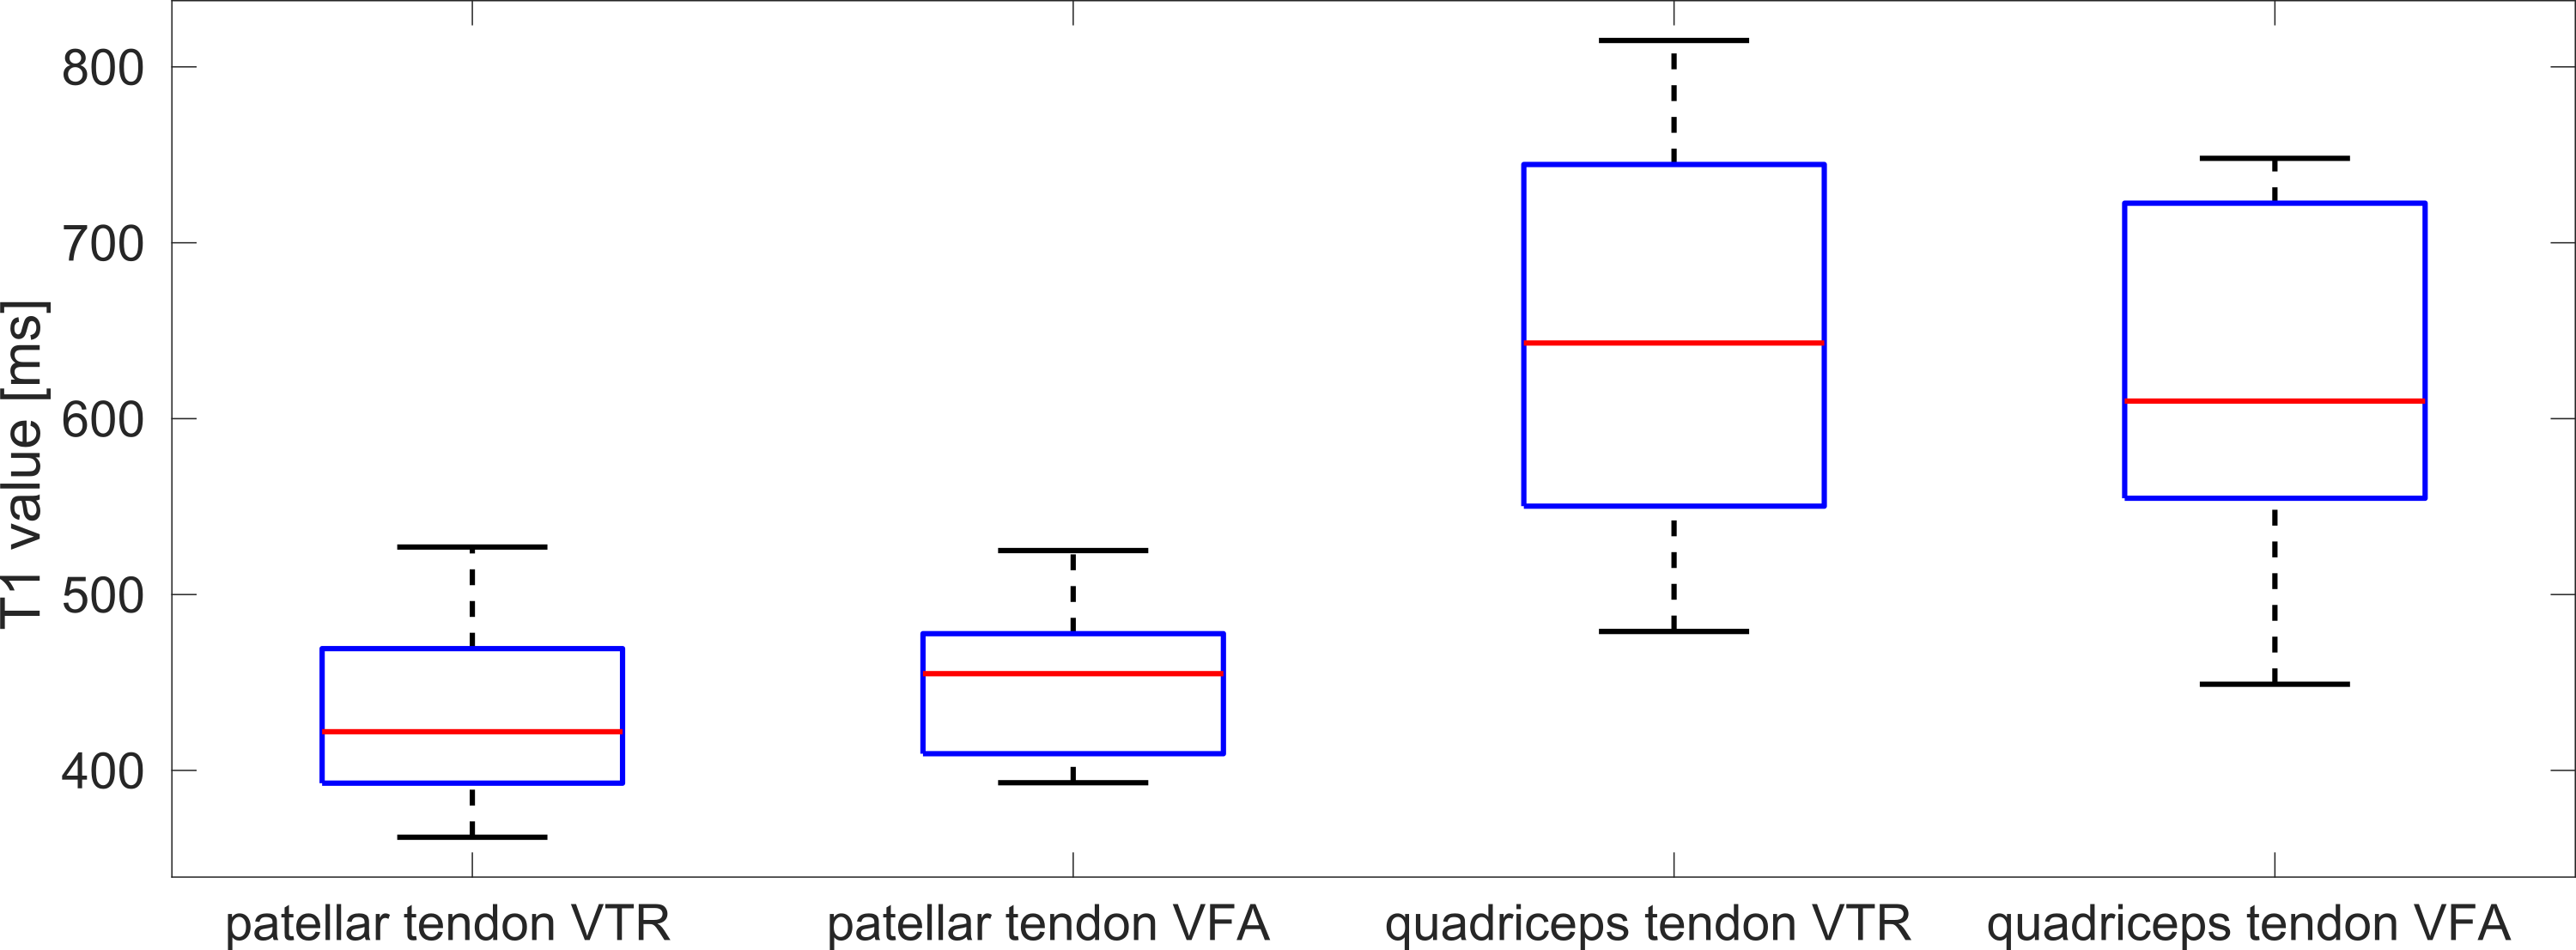
The T2* maps showed an average value of 2.2 +/- 0.2 ms and 2.0 +/- 0.3 ms respectively for the patellar and quadriceps tendons via a fitting on the VTR dataset, the results for the VFA dataset were of 2.3 +/- 0.8 ms and 2.1 +/- 0.6 ms. The corresponding maps can be seen in Figure 1. Figure 2 displays the same results enhanced for the investigated structures. The same regions showed T1 values of 430 +/- 40 ms and 646 +/- 129 for the two tendons via a VTR technique and 460 +/- 50 and 627 +/- 117 via a VFA approach, as per Figure 3. The results are summarized in the table shown in Figure 4, the comparison between values obtained by the different methods for T1 quantification is shown in Figure 5.Discussion:
The T2* value for the patellar tendon are in the range of other findings in literature2,3 that have recovered values between 0.9 and 2.5 ms for the patellar tendon, while no reference was found by the authors about the quadriceps tendon. The results from the T1 quantification falls in the lower range of the recent literature that is, however, mainly based on Achilles tendons4,5. While T1 values for the quadriceps tendon are in line with some of the literature findings about Achilles tendons the only literature reference known to the authors which presents T1 values in the investigated tendons reported values of 1025 ms and 1139 ms for patellar and quadriceps tendon, respectively6. However, the latter study used 1.3 and 1.5 ms as first echo time, which might have hindered a correct sampling of the relaxation curves given that most of the signal decays around 2.5 ms, as per literature2,3. Furthermore the VTR and VFA show consistently similar results for both T2* and T1. The differences in T1 between both tendons could be related to structural differences as the patellar tendon connects the patella to the tibia and is thus strictly a ligament and not a tendon. Since the results obtained from VFA are in close agreement with the alternative VTR approach, using VFA for clinical and research studies is advantageous due to its considerably shorter acquisition time. In the future a correction factor for the B1 field inhomogeneities should be introduced in order to obtain more precise results for T1.Acknowledgements
No acknowledgement found.References
1) Herrmann KH, Krämer M, Reichenbach JR. Time Efficient 3D Radial UTE Sampling with Fully Automatic Delay Compensation on a Clinical 3T MR Scanner. PLoS One. 2016 Mar 14;11(3):e0150371
2) Ma YJ, Zhu Y, Lu X, Carl M, Chang EY, Du J. Short T2 imaging using a 3D double adiabatic inversion recovery prepared ultrashort echo time cones (3D DIR-UTE-Cones) sequence. Magn Reson Med. 2017; Sep 14; epub ahead of print
3) Kijowski R, Wilson JJ, Liu F. Bicomponent ultrashort echo time T2* analysis for assessment of patients with patellar tendinopathy. J Magn Reson Imaging. 2017. Nov;46(5):1441-1447.
4) Wright P, Jellus V, McGonagle D, Robson M, Ridgeway J , Hodgson R, Comparison of two ultrashort echo time sequences for the quantification of T1 within phantom and human Achilles tendon at 3 T. 2012. Magnetic Resonance Medicine, 68: 1279-1284.
5) Filho GH, Du J, Pak BC, Statum S, Znamorowski R, Haghighi P, Bydder G, Chung CB. Quantitative characterization of the Achilles tendon in cadaveric specimens: T1andT2* measurements using ultrashort-TE MRI at 3T. 2009. AJR Am J Roentgenol;192(3): 117-24.
6) Martirosian P, Grözinger G, Rauscher I, Würslin C, Pohmann R, Springer F, Schick F. Relaxometry of tendons, ligaments and menisci in the knee joint at 3 T. 2012. Proc. Intl. Soc. Mag. Reson. Med. 20, #2374.
Figures