1395
Time-resolved mapping of T2* in the patellar tendon during active knee flexion using multi-echo ultra-short echo-time (UTE) imaging1Medical Physics Group, Institute of Diagnostic and Interventional Radiology, Jena University Hospital - Friedrich Schiller University Jena, Jena, Germany, 2Julius Wolff Institute and Center for Musculoskeletal Surgery, Charité – Universitätsmedizin Berlin, Berlin, Germany, 3Zuse Institute Berlin, Berlin, Germany, 4Michael Stifel Center for Data-driven and Simulation Science Jena, Friedrich Schiller University Jena, Jena, Germany, 5Abbe School of Photonics, Friedrich Schiller University Jena, Jena, Germany, 6Center of Medical Optics and Photonics, Friedrich Schiller University Jena, Jena, Germany
Synopsis
To investigate the distribution of T2* in the patellar tendon, and its dependency on factors such as tendon rotation angle and tendon composition, real-time ultra-short echo-time (UTE) imaging was performed during active knee flexion. While T2* is known to depend on the magic angle, it may also be influenced by the underlying tendon structure, which changes its composition when approaching the entheses.
Introduction
Due to their very short T2* relaxation times, imaging and T2* mapping of tendons require either the use of UTE sequences1,2 or deliberate alignment of the tissue with the magic angle (i.e., 54.7°)3. However, when performing time-resolved MRI4 of moving joints, exploiting the magic angle effect is no longer sufficient for imaging the tendon in all different knee joint orientations due to the dynamic angle changes between B0 and the tendon of interest. Furthermore, it is also important to distinguish between different tendon regions (e.g., mid-section, entheses) when performing T2* mapping of tendons, as these can differ in structure and composition, thus exhibiting different effects regarding UTE and magic angle imaging5. In the current work, high-resolution time-resolved 2D UTE imaging was performed to investigate the distribution of T2* relaxation time over the length of the patellar tendon and to quantify changes in T2* relaxation time during active knee flexion.Methods
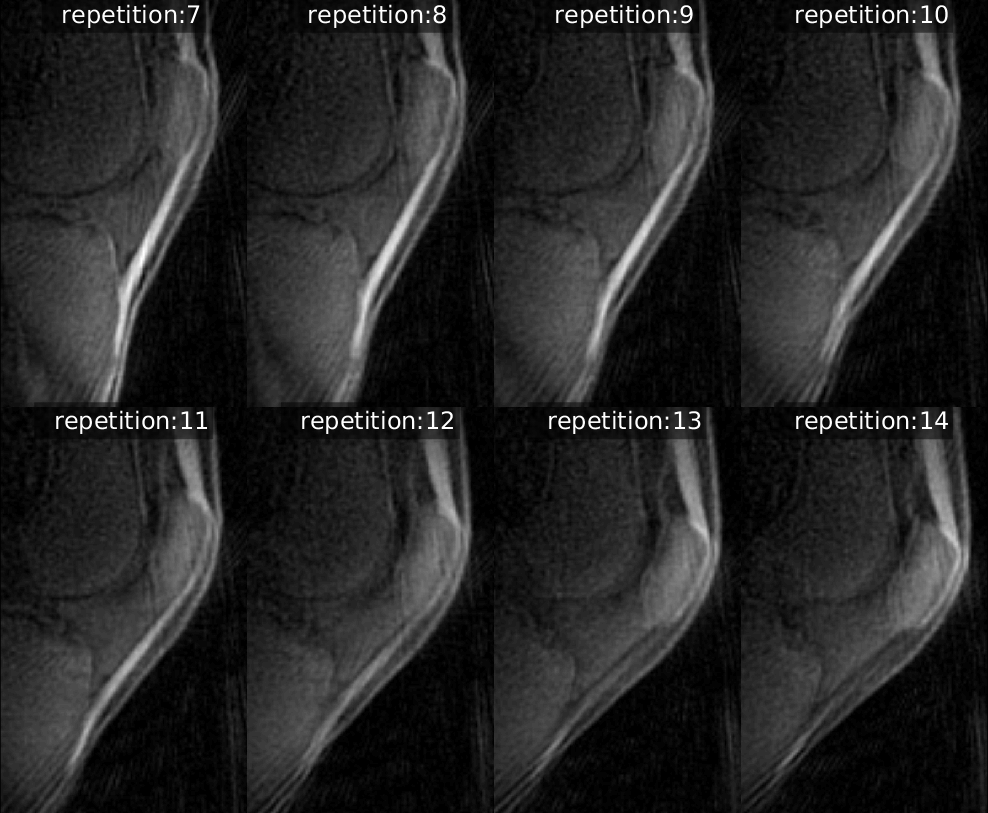
For real-time imaging, a single-slice 2D half-pulse, half-Fourier UTE sequence was used to acquire 5 in-phase echoes per RF-excitation with the following echo times (TE): 0.2ms, 2.4ms, 4.9ms, 7.4ms, and 9.8ms. Other parameters were as follows: 160x160 acquisition matrix; 144x144mm² FoV; 13ms repetition time; 5.2s acquisition time per frame; 3.6mm slice thickness; and 360° temporal ordering scheme with an undersampling of factor 2.2. During acquisition of 19 frames, a 39-year-old healthy male volunteer with no known pathology performed a single, continuous knee flexion as slowly as possible. The volunteer was positioned supine and feet first in the scanner, with the lower-leg extending beyond the patient table to increase the knee range of motion and with the knee being elevated to the center of bore by placing it on a foam wedge. To limit through-slice motion, the mid-thigh was fixed at the patient table using adjustable straps. All measurements were performed with a 3T whole-body Siemens PRISMA MRI scanner using an 8-channel NORAS variety coil.
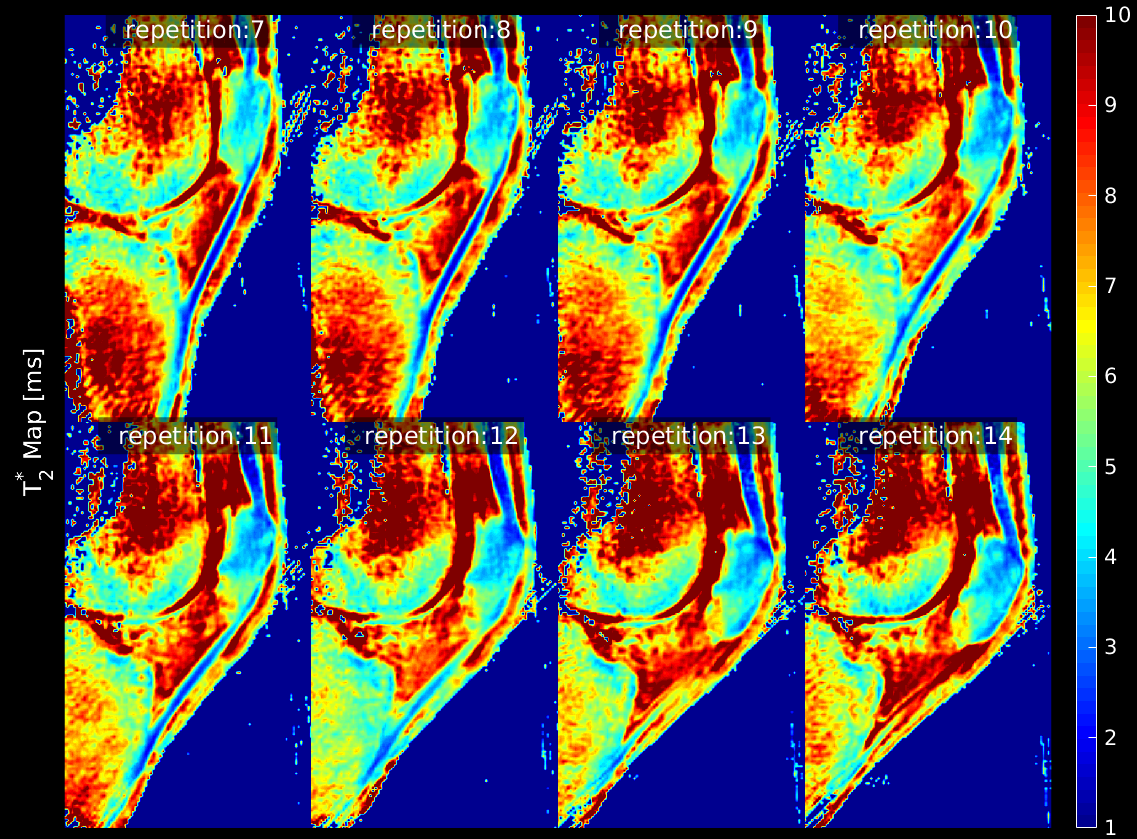
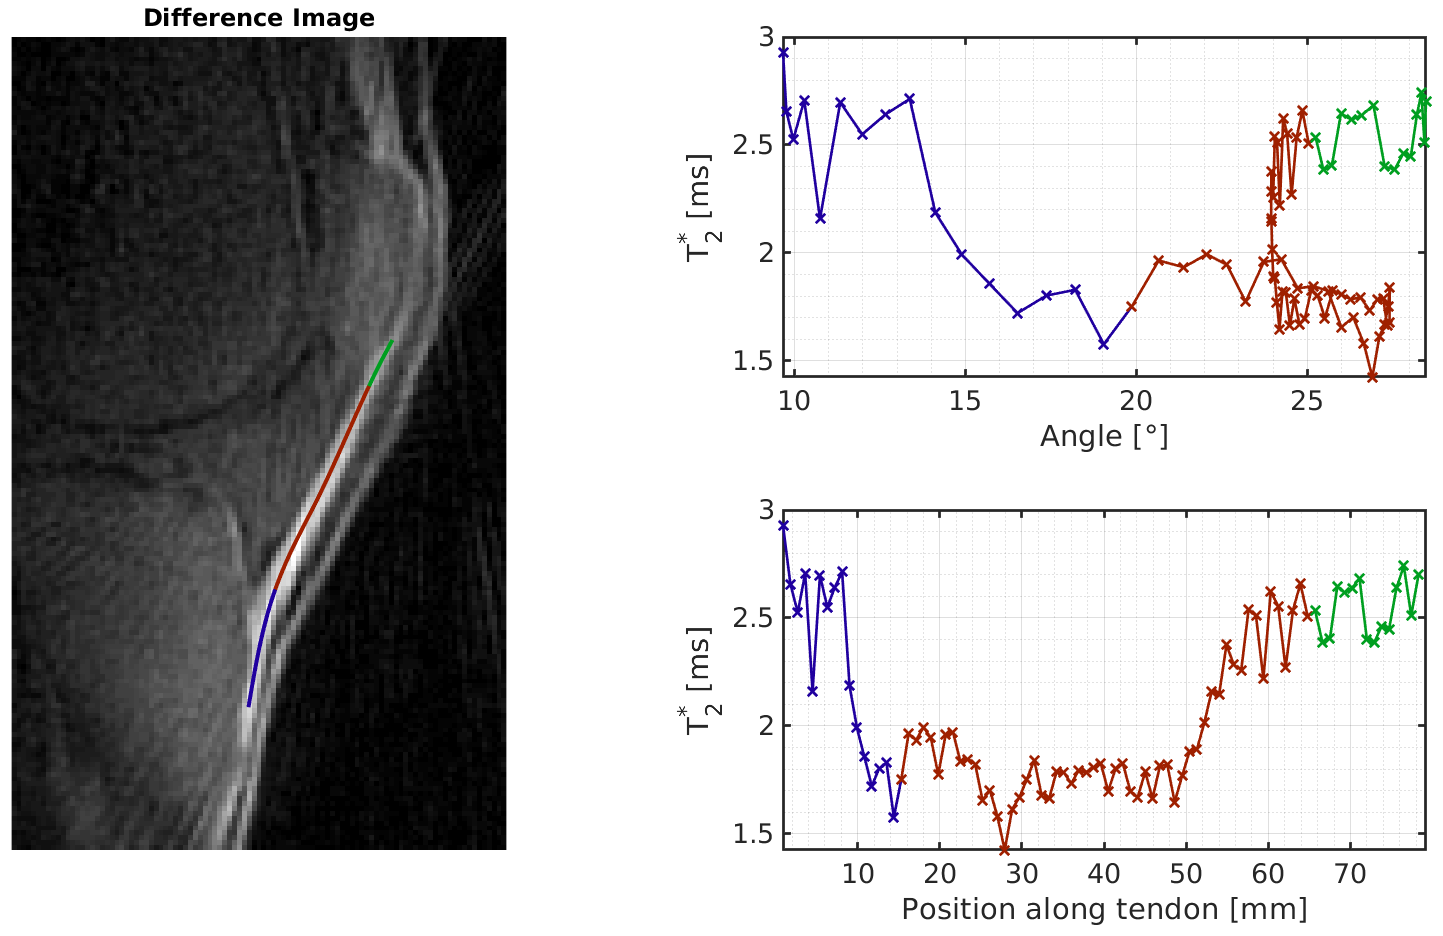
From the reconstructed multi-echo 2D UTE images, T2* maps were generated using squared exponential fitting. Absolute difference images between the first two echoes were used to draw manually center lines through the tendon (spanning from the tibial enthesis to the patellar enthesis), which were subsequently split manually into three regions: tibial enthesis, mid-tendon, and patellar enthesis. It should be noted that these tendon regions were segmented based on visual approximation only as perfect delineation is not possible due to the interwoven structures and continuous transitions between regions6.
Results
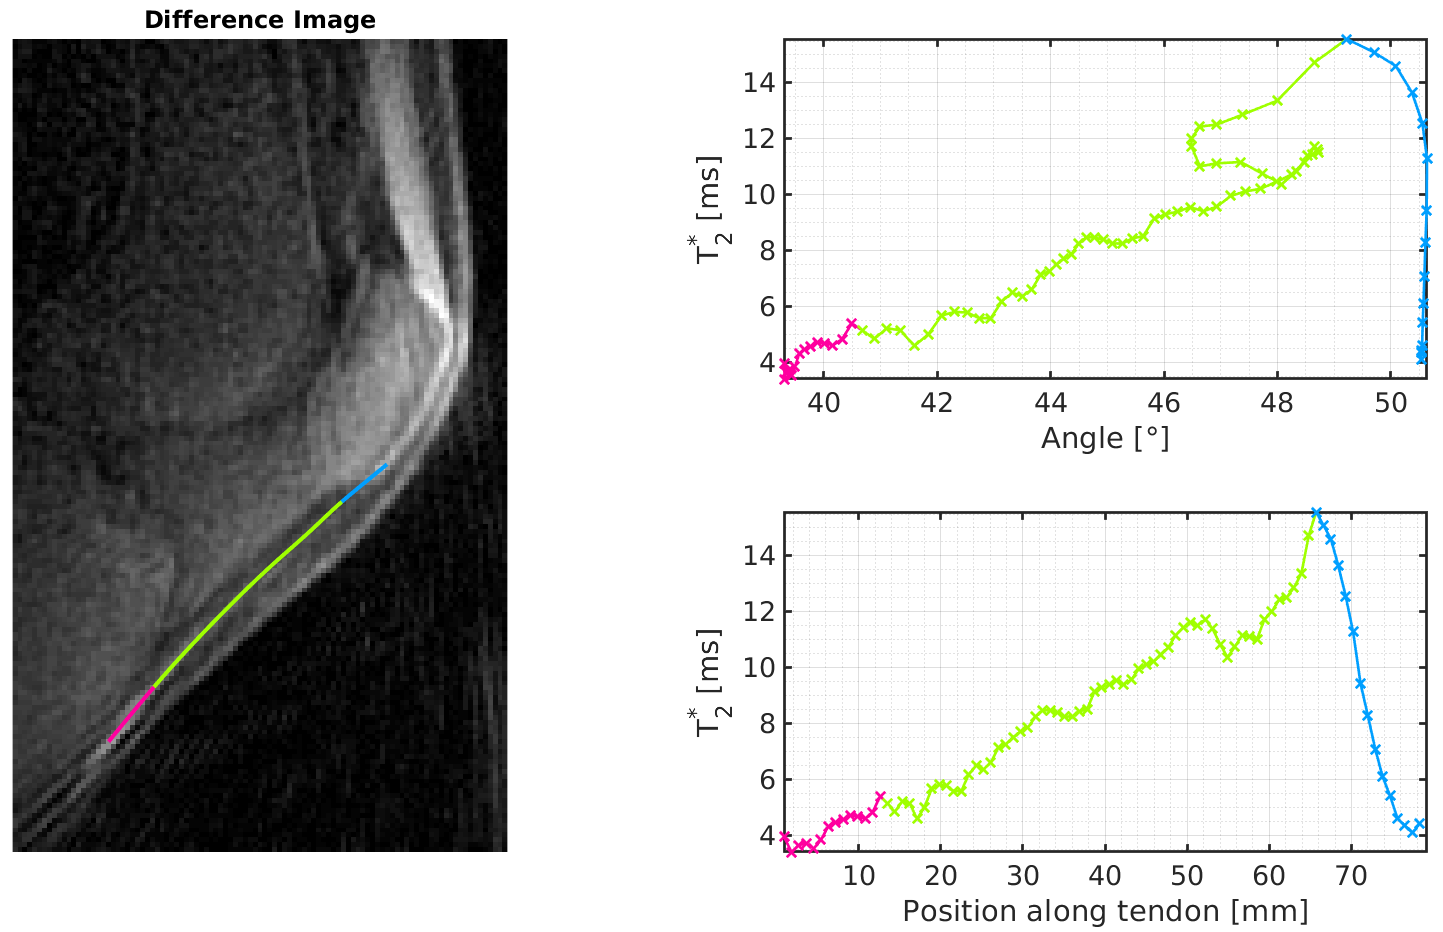
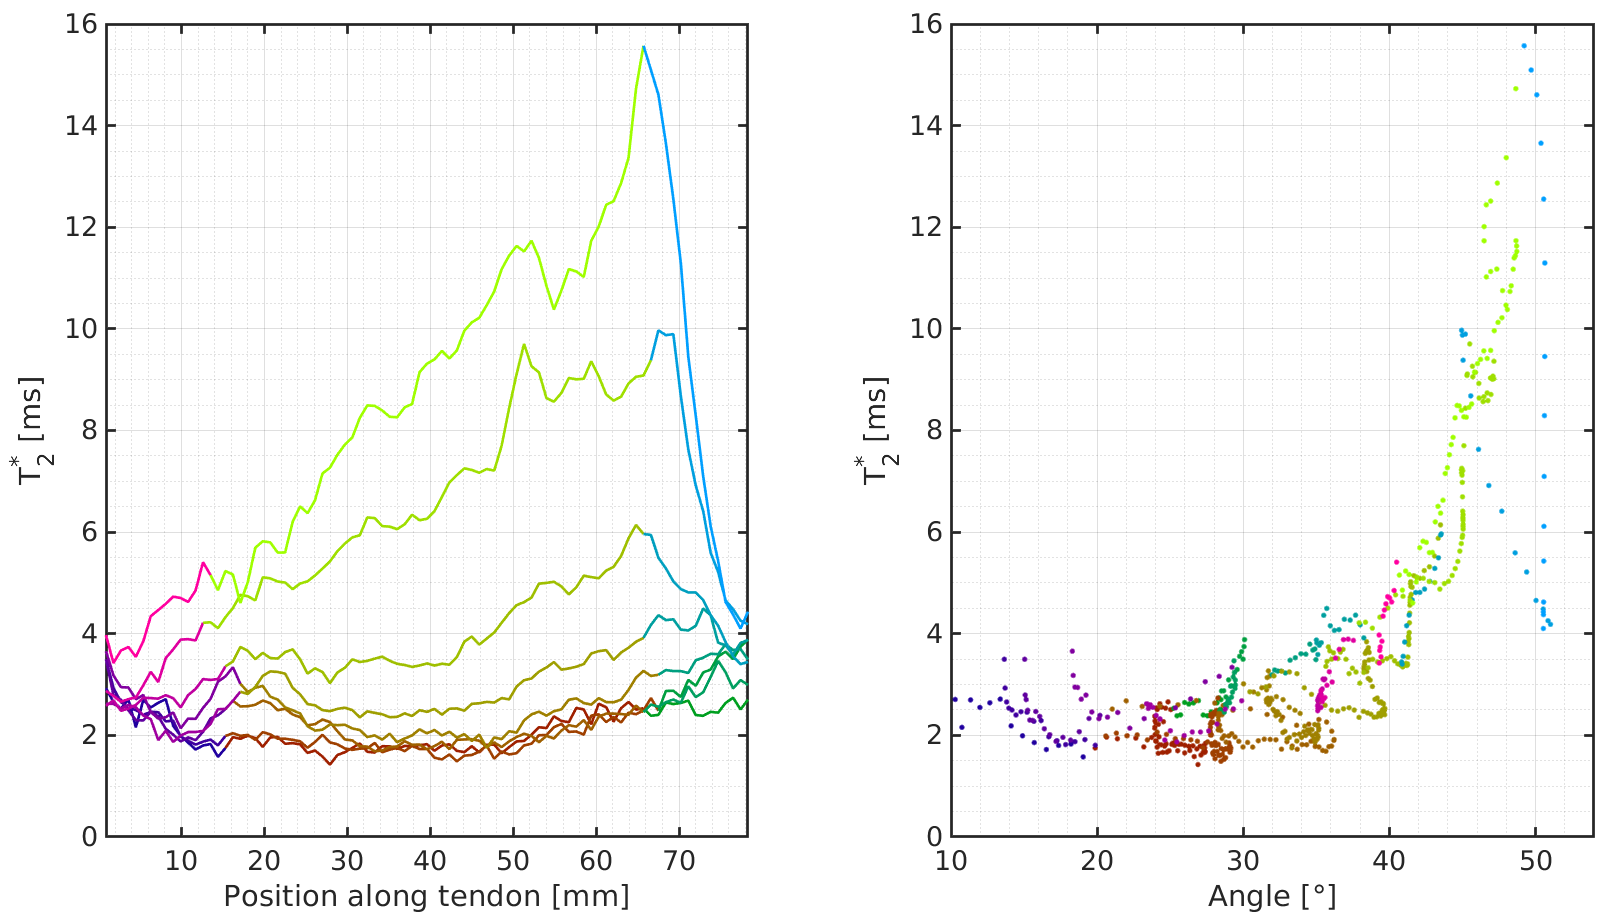
Absolute difference images between the first two echoes are displayed for 8 frames of the actual knee flexion movement in Figure 1, the other frames showed no motion. With increasing angle between the tendon and B0, the intensity of the tendon on the difference image decreased, indicating an initial increase in T2*. This observation was confirmed by the quantitative maps with T2* of the tendon increasing from a minimum value of 1.4ms to a maximum of 15.4ms during active knee flexion (Figure 2). In addition, the distribution of T2* time over the length of the tendon appeared inconsistent (Figure 3). With the knee nearly fully extended, the angles of the patellar tendon with respect to B0 were much smaller than the magic angle. Accordingly, changes observed in T2* are presumed to be related to the structure of the tendon: increased T2* of ~2.5ms in and around the entheses; reduced T2* of ~1.5ms in the mid-tendon part. With the knee at near full flexion (Figure 4), strong changes in T2* were observed due to magic angle effects (increase of T2* from 3.8ms (39.7°) to 14.6ms (49°) over the length of the tendon). In the entheses regions a sudden decrease of T2* is visible which differs from the expected behavior due to magic angle effects. Comparing the T2* values for all frames and tendon regions (Figure 5), a continuous and strong dependence on the tendon rotation angle was visible.Discussion and Conclusion
This work strengthens the notion that measuring T2* in tendons is a challenging feat, as tissue T2* relaxation times depend not only on the angular orientation but also on the structures of different tendon regions. Approaching the entheses, tendon structures are known to transition continuously from a dense fibrous connective tissue to more uncalcified fibrocartilage, with collagen fibers losing their parallel orientation5,7. This structural change might explain the corresponding changes in T2*. To extract reliable and comparable T2* values in tendons, it is thus important to ensure a highly consistent tendon orientation with respect to the magnetic field and a careful selection of the region of interest used for the analysis.Acknowledgements
No acknowledgement found.References
1. Rahmer J, Börnert P, Groen J, Bos C. Three-dimensional radial ultrashort echo-time imaging with T2 adapted sampling. Magn Reson Med. 2006;55(5):1075-10822.
2. Josan S, Pauly JM, Daniel BL, Pauly KB. Double Half RF Pulses for Reduced Sensitivity to Eddy Currents in UTE Imaging. Magn Reson Med. 2009;61;1083-10893.
3. Bydder M, Rahal A, Fullerton GD, Bydder GM. The magic angle effect: a source of artifact, determinant of image contrast, and technique for imaging. J Magn Reson Imaging. 2007;25:290-3004.
4. Zhang S, Block KT, Frahm J. Magnetic resonance imaging in real time: Advances using radial FLASH. J Magn Reson Imaging. 2009;31;101-1095.
5. Benjamin M, Milz S, Bydder GM. Magnetic resonance imaging of entheses. Part 1. Clin Radiol. 2008;63;691-7036.
6. Fullerton GD, Rahal A. Collagen Structure: The Molecular Source of the Tendon Magic Angle Effect. 2007;25;345-3617.
7. Benjamin M, Bydder GM. Magnetic Resonance Imaging of Enthesis Using Ultrashort TE (UTE) Pulse Sequences. J Magnetic Resonance Imaging. 2007;25;381-389
Figures