1393
Comparison of Radial and Spiral UTE MRI and T2* quantification of the Knee Joint1Program of Advanced Musculoskeletal Imaging (PAMI), Cleveland Clinic, Cleveland, OH, United States, 2Siemens Medical Solution Inc, Malvern, PA, United States, 3Siemens Healthcare GmbH, Erlangen, Germany
Synopsis
The ultrashort TE (UTE) sequences allow measurement of
Purpose
Ultrashort TE (UTE) MRI allows visualization of short T2 tissues such as tendon, ligament and meniscus in the joint, which are otherwise invisible in standard MRI.1 Furthermore, UTE T2* imaging with multi-echo UTE sequences provides quantitative evaluation of tissue composition, which can be a promising biomarker for early detection of degeneration of the aforementioned tissues in diseases including arthritis and tendinopathy.2,3 A number of different UTE sequences have been developed,4-7 however, few studies compared the T2* calculated from different sequences. In this work, UTE based on stack of spirals and 3D radial acquisition were compared in terms of image quality, SNR efficiency, and T2* quantification in patella tendon, meniscus, cartilage and muscle.Methods
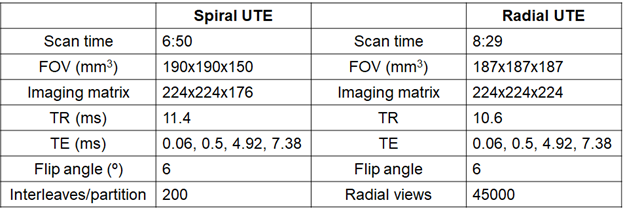
Spiral UTE was implemented based on stack of spirals.6 To achieve minimum TE, a non-selective hard RF pulse with a short pulse width (60 us) and minimum length partition encoding gradient was used. Due to the use of minimum length partition encoding gradient, the TE varies with the partition. The center partition, which determines the overall contrast of the image, has the shortest TE since no partition encoding is required. The fat saturation pulse was applied every Number of Partitions * TR, with partition-in-line reordering is used. Radial UTE was implemented based on the work of Chan et al.7 A 100 us non-selective hard pulse was used for excitation. Fat saturation was applied every 20 TRs. For both sequences, non-uniform Fourier transform was used for reconstruction. Four echoes of both spiral and radial UTE knee images were collected from three volunteers using a 3T MR scanner (Magnetom Prisma, Siemens Healthcare AG, Erlangen, Germany) with 1Tx/15Rx knee coil (QED). The sequence parameters are listed in Table 1. Fat saturation was applied for all scans. For both UTE sequences, two echoes were collected per measurement. The first and third TE were collected with the first scan and the other echoes were collected with the next scan. The multi-echo data was fitted using mono-exponential fitting to calculate T2* after the registration between different echo images. ROIs were defined in anterior cruciate ligament (ACL), posterior cruciate ligament (PCL), patella tendon, and meniscus. SNR efficiency was calculated by dividing the average magnitude of first echo for each ROIs by noise standard deviation and square root of measurement time in seconds. T2* of each defined ROIs were calculated and compared between the two sequences.Results
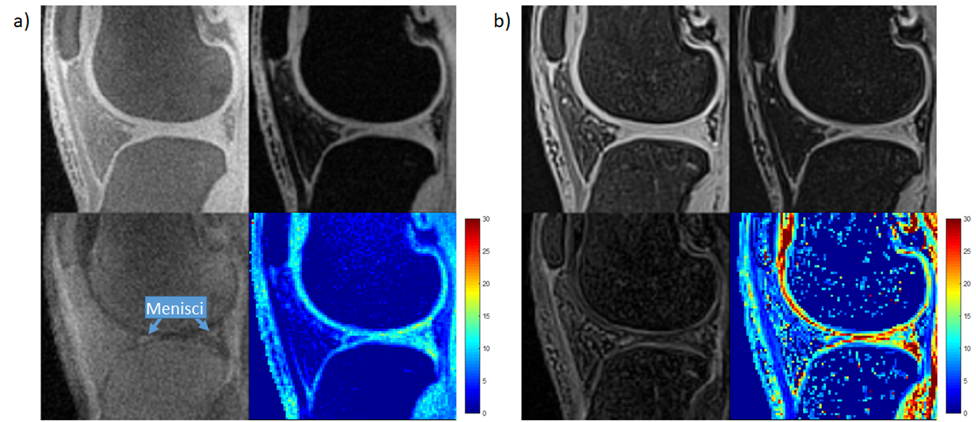
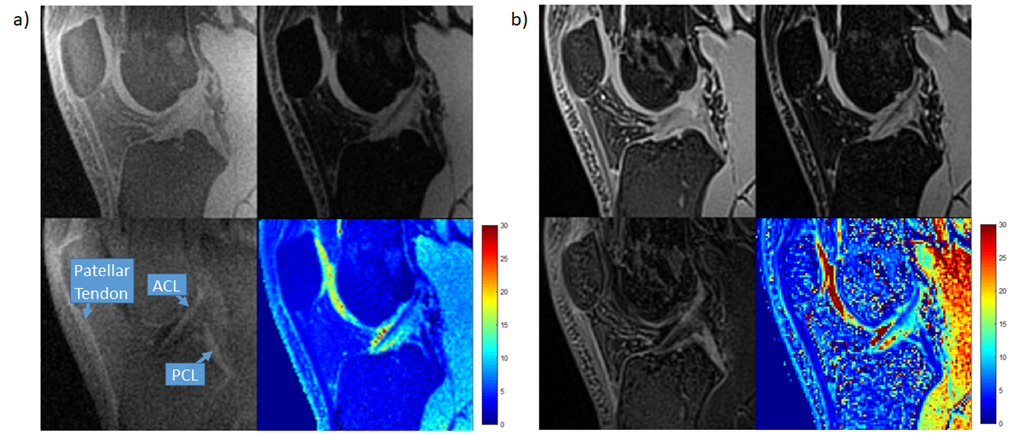
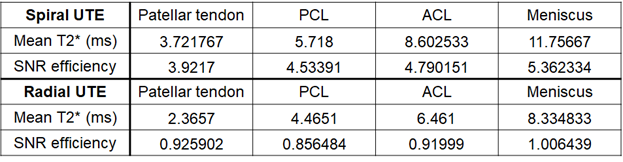
Both sequences provided images with good quality and the difference images provided good contrast for short T2* tissues, as shown in Fig. 1 and Fig. 2. Spiral UTE images tended to have better fat suppression compared to radial UTE with current sequence design; while spiral UTE images, especially the first echo, tended to have more blurring and edge artifacts. The SNR efficiency and mean T2* are listed in Table 2. The T2* measured by both sequences were comparable to the values in the literature,1,8 with spiral UTE showing higher mean values and SD compared to radial UTE.Discussion
The different quality of fat suppression can be explained by difference in the current fat suppression strategy, where for spiral UTE all spiral interleaves in the center partition are collected right after fat suppression, whereas for radial UTE all radial views fill low-frequency k-space, thus degrading the amount of fat suppression overall. Different fat suppression may also partially contribute to different T2* quantification between the two sequences. Fat saturation pulse can lead to magnetization transfer effect, which is more likely to suppress the short T2* component, thus increasing the measured T2* in spiral UTE. Such phenomenon was also investigated by Carl et al.9 Further, although the nominal TEs were the same for two sequences, the stack of spiral does not have constant TEs for all interleaves. The SNR efficiency was higher for spiral UTE than radial UTE (4.86 for spiral to 0.968 for radial), which may be due to the higher k-space sampling efficiency with the spiral trajectory, but maybe also due to potential underestimation of noise caused by blurring. Nonetheless, more sophisticated calculation for precise SNR comparison is warranted for future studies since both radial and spiral acquisition is known to have patterned noise distribution.Conclusion
In this work, we compared radial and spiral UTE imaging and T2* quantification for short T2 tissues in the knee joint. The discrepancies include fat suppression, SNR efficiency, and T2* values. For the future work, effect of fat suppression, quantification reproducibility, and advanced fitting algorithms such as bi-exponential fitting will be evaluated to further investigate the two sequences to identify the optimal candidate for clinical applications.
Acknowledgements
No acknowledgement found.References
1. Chang EY, Du J, Chung CB. UTE imaging in the musculoskeletal system. Journal of magnetic resonance imaging 2015; 41(4): 870-883.
2. Chen B, Zhao Y, Cheng X, Ma Y, Chang EY, Kavanaugh A, Liu S, Du J. Three-dimensional ultrashort echo time cones (3D UTE-Cones) magnetic resonance imaging of entheses and tendons. Magn Reson Imaging. 2018; 49: 4-9.
3. Kijowski R, Wilson JJ, Liu F. Bicomponent ultrashort echo time T2* analysis for assessment of patients with patellar tendinopathy. J Magn Reson Imaging. 2017; 46(5): 1441-7.
4. Du J, Bydder M, Takahashi AM, Chung CB. Two-dimensional ultrashort echo time imaging using a spiral trajectory. Magn Reson Imaging 2008; 26: 304–312.
5. Gurney PT, Hargreaves BA, Nishimura DG. Design and analysis of a practical 3D cones trajectory. Magn Reson Med 2006; 55: 575– 582.
6. Qian Y, Boada FE. Acquisition-weighted stack of spirals for fast high-resolution three-dimensional ultra-short echo time MR imaging. Magn Reson Med 2008; 60:135–145.
7. Chan CF, Keenan NG, Nielles‐Vallespin S, Gatehouse P, Sheppard MN, Boyle JJ, Pennell DJ, Firmin DN. Ultrashort echo time cardiovascular magnetic resonance of atherosclerotic carotid plaque. J Cardiovasc Magn Reson 2010; 12: 17.
8. Williams A, Qian Y, Golla S, Chu CR. UTE‐T2* mapping detects sub‐clinical meniscus injury after anterior cruciate ligament tear. Osteoarthritis Cartilage 2012;20:486–494.
9. Carl M, Nazaran A, Bydder GM, Du J. Effects of fat saturation on short T2 quantification. Magnetic resonance imaging. 2017;43:6-9.
Figures