1391
UTE T2* cartilage mapping: Regional differences in asymptomatic hips1Department of Radiology, Columbia University Medical Center, New York, NY, United States, 2Department of Orthopedic Surgery - Center for Shoulder, Elbow, and Sports Medicine, Columbia University Medical Center, New York, NY, United States
Synopsis
UTE T2* images were acquired in 8 asymptomatic hips. The hip cartilage was segmented into anterosuperior, superior, and posterosuperior regions. Differences in mean T2* values between these regions were assessed. Results demonstrated a significant increase in the mean value of the anterosuperior region compared to the posterosuperior region.
Introduction
Knowledge of cartilage health is critical for determining prognosis of hip arthroscopy since operative failure rates are 40% higher when there is pre-existing arthritis 1. Identification of early cartilage degeneration requires use of quantitative techniques that are sensitive to biochemical changes in the cartilage matrix. Many of these techniques exist, though none have been adopted for routine clinical use. Ultra short echo time (UTE) T2* mapping has the potential advantage of being sensitive to early cartilage degeneration involving the deep layer 2. Although it has been used in the knee to detect changes in cartilage health following anterior cruciate ligament injury 3,4, its application to the hip has been limited.Methods
The study was performed on 3T 70cm bore MR scanners (Discovery MR750w, GE Healthcare, USA) using GE Signa MRI 32 channel General Matrix Coil. Images were acquired in eight total hips in five asymptomatic volunteers (3 bilateral) who had no history of hip pain or surgery (3:2 female: male, mean age 32.6 ± 6.9 years). We collected a proton density (PD) anatomic scan in the sagittal and coronal planes with the following parameters: 18cm FOV, 3mm slice thickness, 4 second TR, 30 millisecond TE, 50kHz bandwidth and a matrix of 352 x 240 with a total scan time of 2:44 per scan. The UTE T2* map data was collected in the sagittal plane with the following parameters: ten echo times ranging from 0.0 to 30 milliseconds 24cm FOV 2mm slice thickness, 46.3 millisecond TR 62.5kHz bandwidth, 240 x 240 matrix, 2 millimeter slice thickness and flip angle of 7 degrees for a total scan time of 5:15 per acquisition. The UTE T2* fitting was performed using a non-negative least squares NNLS algorithm implemented in NiftyFit toolkit 5.
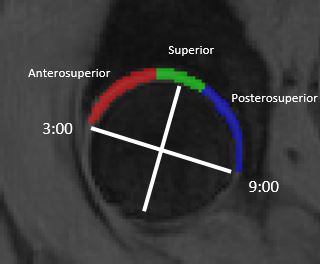
UTE T2* maps were segmented on ITK-SNAP 6. Femoral and acetabular cartilage were analyzed together. Using the 12:00 position (opposite the center of the transverse ligament) as the reference at the center of the femoral head, the 3:00 (anterior) and 9:00 (posterior) positions were marked. The cartilage between 3:00 and 9:00 was then divided into equal thirds yielding anterosuperior, superior, and posterosuperior regions (Fig. 1). Each slice of cartilage lateral to the femoral fovea was segmented. Anatomic PD images were assessed to ensure accurate segmentation.
Quantitative UTE T2* values in different cartilage regions were analyzed with a repeated measures ANOVA with significance set at p < 0.05.
Results
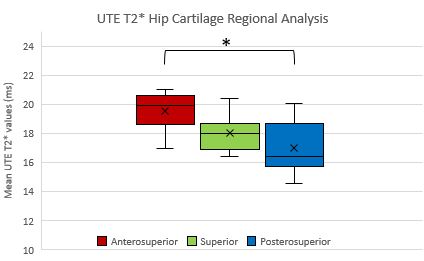
All of the volunteers had morphologically normal cartilage with no focal defects identified on the PD images. The mean UTE T2* value for all of the segmented cartilage regions was 18.19 ms. There was a significant difference between the 3 regions (p = 0.010) with the following mean values: anterosuperior (19.55 ms), superior (18.04 ms), and posterosuperior (16.99 ms). Pairwise comparison between individual regions demonstrated a significant difference between the anterosuperior and posterosuperior regions (p < 0.010). There was no significant difference between the anterosuperior and superior regions (p = 0.16) or between the superior and posterosuperior regions (p = 0.29).Discussion
Our results provide initial data on UTE T2* cartilage mapping in the hip. A higher relative mean value found in the anterosuperior region likely reflects the weight-bearing nature of this zone. If quantitative regional differences can be detected in asymptomatic hips, they may be even more pronounced in symptomatic patients who have early cartilage damage. This technique therefore has potential to be a useful imaging biomarker for patients with hip disorders such as femoroacetabular impingement (FAI).Conclusion
UTE T2* cartilage mapping in the hip is sensitive to regional differences with the anterosuperior region demonstrating a significantly higher mean value compared to the posterosuperior region.Acknowledgements
No acknowledgement found.References
1. Larson CM, Giveans MR, Taylor M. Does arthroscopic FAI correction improve function with radiographic arthritis? Clin Orthop Relat Res. 2011 Jun;469(6):1667–76.
2. Williams A, Qian Y, Bear D, Chu CR. Assessing degeneration of human articular cartilage with ultra-short echo time (UTE) T2* mapping. Osteoarthr Cartil. 2010 Apr;18(4):539–46.
3. Chu CR, Williams AA, West RV, Qian Y, Fu FH, Do BH, et al. Quantitative Magnetic Resonance Imaging UTE-T2* Mapping of Cartilage and Meniscus Healing After Anatomic Anterior Cruciate Ligament Reconstruction. Am J Sports Med. 2014 Aug;42(8):1847–56.
4. Titchenal MR, Williams AA, Chehab EF, Asay JL, Dragoo JL, Gold GE, et al. Cartilage Subsurface Changes to Magnetic Resonance Imaging UTE-T2* 2 Years After Anterior Cruciate Ligament Reconstruction Correlate With Walking Mechanics Associated With Knee Osteoarthritis. Am J Sports Med. 2018 Mar;46(3):565–72.
5. Melbourne A, Toussaint N, Owen D, Simpson I, Anthopoulos T, De Vita E, et al. NiftyFit: a Software Package for Multi-parametric Model-Fitting of 4D Magnetic Resonance Imaging Data. Neuroinformatics. 2016;14(3):319–37.
6. Yushkevich PA, Piven J, Hazlett HC, Smith RG, Ho S, Gee JC, et al. User-guided 3D active contour segmentation of anatomical structures: significantly improved efficiency and reliability. Neuroimage. 2006 Jul 1;31(3):1116–28.
Figures