1390
Quantitative Evaluation of the Relationship Between the Femoral Trochlear Dysplasia and the Degeneration of the Patellofemoral Cartilage by MR T2mapping Technique1Department of Radiology, Tianjin First Center Hospital, Tianjin, China, 2Clinical Science, Philips Healthcare, Beijing, China
Synopsis
Femoral trochlear dysplasia (FTD) is one of the common causes of early injury of knee cartilage in young people, and most of patients of FTD with the history of patellar dislocation, which seriously affects the quality of patients’ life. We focus on all the lateral, medial, deep and superficial layers of both patella and femoral trochlear cartilage in young people with quantitative T2 mapping. We find the superficial layers of lateral patellofemoral cartilage is mainly dehydration change in FTD, and there is more range of cartilage biochemical changes in age<30 years, compared to in age≧30 years, because the controls may appear the cartilage degeneration with increased in age. Compared to the type A of FTD, there are more and wider areas of cartilage dehydration in type B-D, and one of them involve the deep layer and show edema.
Introduction
Femoral trochlear dysplasia (FTD) can cause recurrent dislocation of the patellar, and is one of the causes of knee pain and cartilage damage during adolescence[1], which condition may absence trauma and high-intensity running. The relationship between FTD and the change of patellofemoral cartilage biochemical is not clear, so we want to know the processes and characteristics of patellofemoral cartilage with the quantitative T2mpping MR technique in FTD patients who are in young age.Methods
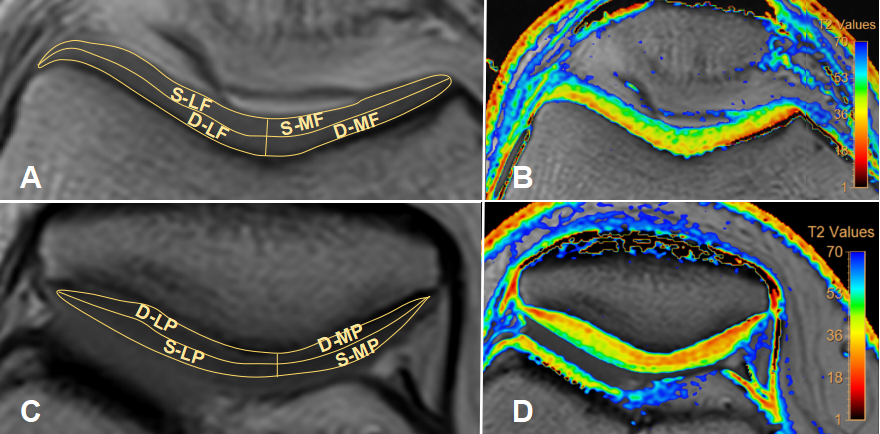
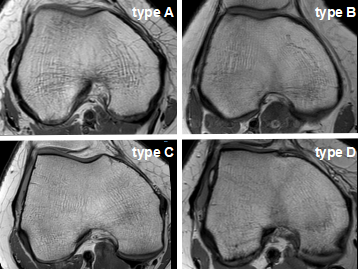
62 patients with FTD (aged 18-45 years and mean age 31.2±7.9 years , 25 males and 37 females, 33 left knees and 29 right knees) and 62 controls (aged 18-45 years and mean age 30.7±7.8 years, 24 males and 38 females, 35 left knees and 27 right knees) with matched age and gender were included in this study. Routine MRI (Including PDWI SPAIR, T1W-aTSE, PDWI-SPAIR) and patellofemoral cartilage T2 mapping images (sT2Cal-TSE), were aquired for patients and controls by using Philips Ingenia 3T scanner (Philips Healthcare, Best, the Netherlands). The ROIs were drawn within the medial and lateral of patella and femoral trochlear cartilage respectively, each ROI was furtherly divided into superficial and the deep layers. Finally, the T2 values were obtained for each ROI (the superficial and the deep layers respectively) (as shown Figure1). Independent sample T test was used to compare the cartilage T2 values between patients and controls in two different age groups. One-way ANOVA and Scheffe’s test was used to compare the cartilage T2 values with different femoral trochlear types (as shown Figure2) and controls.Results
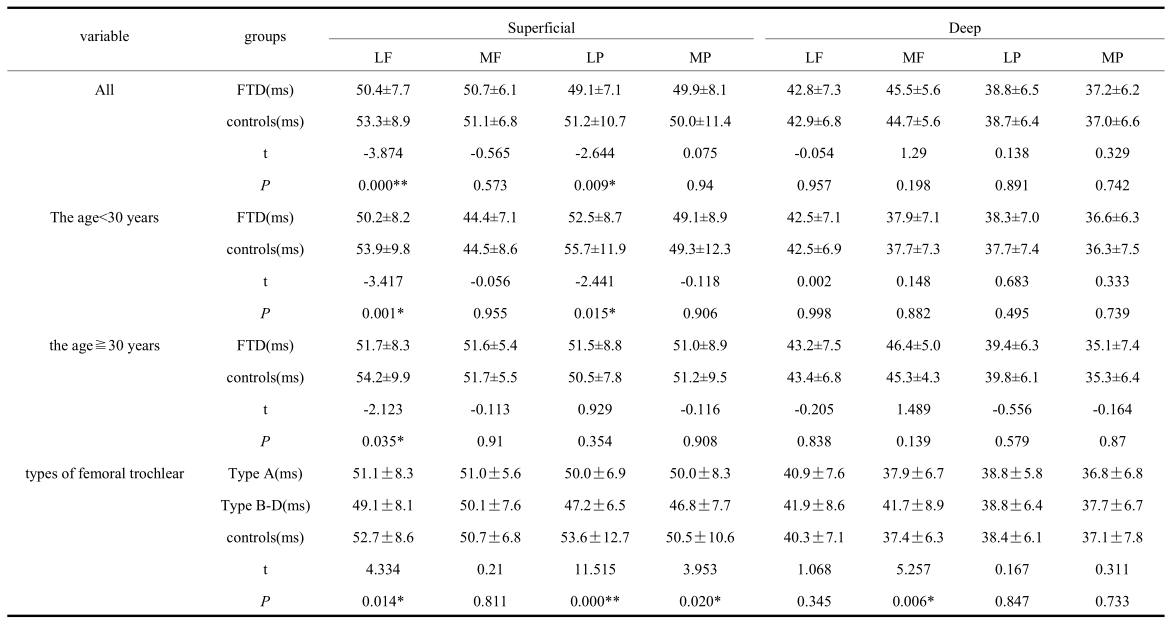
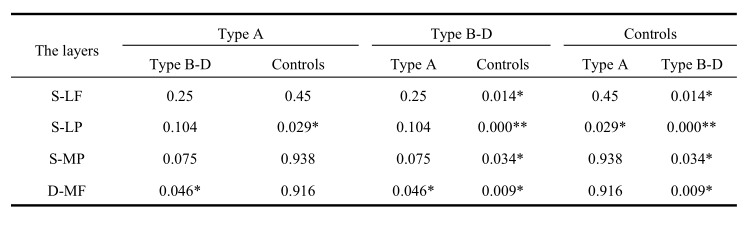
The T2 value of patients is significant lower than controls in S-LF (patients: 50.4±7.7ms, controls: 53.3±8.9ms, P<0.001) and S-LP (patients: 49.1±7.1ms, controls: 51.2±10.7ms, P=0.009) . When age<30 years old, the T2 value of patients is significant lower than controls in S-LF (subjects: 50.2±8.2ms, controls: 53.9±9.8ms, P=0.001) and S-LP (subjects: 52.5±8.7ms, controls: 55.7±11.9ms, P=0.015). When age≧30 years old, the T2 value of patients is significant lower than controls in S-LF (subjects: 51.7±8.3ms, controls: 54.2±9.9ms, P=0.035). In different femoral trochlear types of FTD, the T2 value is lowest for type B-D, followed by type A and the controls, the areas with statistically significant differences are as follows, S-LF (type B-D: 49.1±8.1ms, controls: 52.7±8.6ms, P=0.014); S-LP (type B-D: 47.2±6.5ms, controls: 53.6±12.7ms, P<0.001); S-MP (type B-D: 46.8±7.7ms, controls: 50.5±10.6ms, P=0.034) ; S-LP (type A: 50.0±6.9ms, controls: 53.6±12.7ms, P=0.029). in contrast, the T2 value of type B-D is significant higher than both type A and controls, in D-MF (type B-D: 41.7±8.9ms, controls: 37.4±6.3ms, P=0.009); (type B-D: 41.7±8.9ms, type A: 37.9±6.7ms, P=0.046). The difference is statistically significant (P<0.05) (as shown Table1 and 2).Discussion
The areas of T2 values with significant differences mainly in the superficial layer of lateral patellofemoral cartilage, considering that it’s related to the result of FTD, which may cause the lateral patellar instability. In age≧30 years, there is just one area, the T2 values of S-LF with significant differences between the FTD and the controls, but there are two areas, the T2 values of S-LF and S-LP with significant differences between the FTD and the controls in age<30 years. We consider that with the increase of human age, the patellar cartilage gradually begins to undergo the early degeneration, this phenomenon appears in controls, which results the range of areas with significant differences of T2 value between the FTD and controls is reduction in lager age, compared to the young age. For different types of the femoral trochlea[2], the type A is mild morphological dysplasia, the type B-D is defined as serious which more easily cause the recurrent patella dislocation. Compared to the difference between type A and controls, there are more and wider areas which T2 values of cartilage are significant differences above comparison between type B-D and controls, and one of them is the deep layer, it indicates that not only can the FTD of type B-D cause more serious and extensive damage of superficial layers, it may also involve deeper layer of cartilage. Because T2mapping mainly reflects the change of collagen structure and water content, the higher the water content, the higher the T2 value[3], so based on the results of the above experiments, we may speculate that the superficial layer of cartilage shows dehydration change, while the deep layer may reflects edema, and the increase and decrease of T2 values are consistency in all results, respectively.Conclusion
The FTD might cause the early degeneration of patellofemoral cartilage, which significantly appear in the younger age; The type B-D of FTD is more likely to cause the wider range of superficial cartilage injure and involved some part of deep layer; the injure shows dehydration change in superficial cartilage and edema in deep layer.Acknowledgements
No acknowledgement found.References
[1] Brian J. R, Denis N, Michael B. C, et al. Familial Association of Femoral Trochlear Dysplasia With Recurrent Bilateral Patellar Dislocation[J]. Orthopedics, 2012, 35(35):e574-9.
[2] Lippacher S, Dejour D, Elsharkawi M, et al. Observer agreement on the Dejour trochlear dysplasia classification: a comparison of true lateral radiographs and axial magnetic resonance images.[J]. Am J Sports Med, 2012, 40(4):837-843.
[3] Apprich, Welsch, G.H, et al. Detection of degenerative cartilage disease: comparison of high-resolution morphological MR and quantitative T2 mapping at 3.0 Tesla[J]. Osteoarthritis & Cartilage, 2010, 18(9):1211-1217.
Figures