1389
Quantification of Non-calcified and Calcified Zones in Articular Cartilage using MRI and PLM at Microscopic Resolution1Physics, Oakland University, Rochester Hills, MI, United States
Synopsis
The zone of calcified cartilage is the least explored region of cartilage in MRI, due to a strong dipolar interaction and a high mineralization of the subchondral region in articular cartilage. T2 weighted images by standard SE and GE sequences show little intensity of ZCC, whereas T2 and T1 weighted at the magic angle can highlight some parts of the region. Quantitative UTE can measure T2 of ZCC down to a fraction of a millisecond. With the aid of PLM, we can correlate the quantitative µMRI data with the optical properties of the ZCC.
Introduction
Articular cartilage (AC) is a heterogeneous and load-bearing tissue in synovial joints; the degradation of AC leads to joint diseases such as osteoarthritis (OA). A well-studied finding of the non-calcified cartilage is the collagen fiber organization, by which, the tissue is divided into three histological zones: the superficial (SZ), transitional (TZ), and radial zone (RZ)1. Between the non-calcified cartilage and subchondral bone, there lies a zone of calcified cartilage (ZCC), which serves as the structural interface. In a traumatic situation, such as sports or battlefield injuries, a damaged ZCC can result in the initiation and progression of cartilage degradation, eventually leading to OA. Since ZCC has a very short T2, it is commonly invisible in spin-echo based MRI measurements2. Fast imaging sequences such as Ultra-short echo time (UTE) and Zero-echo (ZTE) imaging sequences have shown potential to visualize ZCC and to measure T2 in ZCC as low as a fraction of a millisecond3.Methods
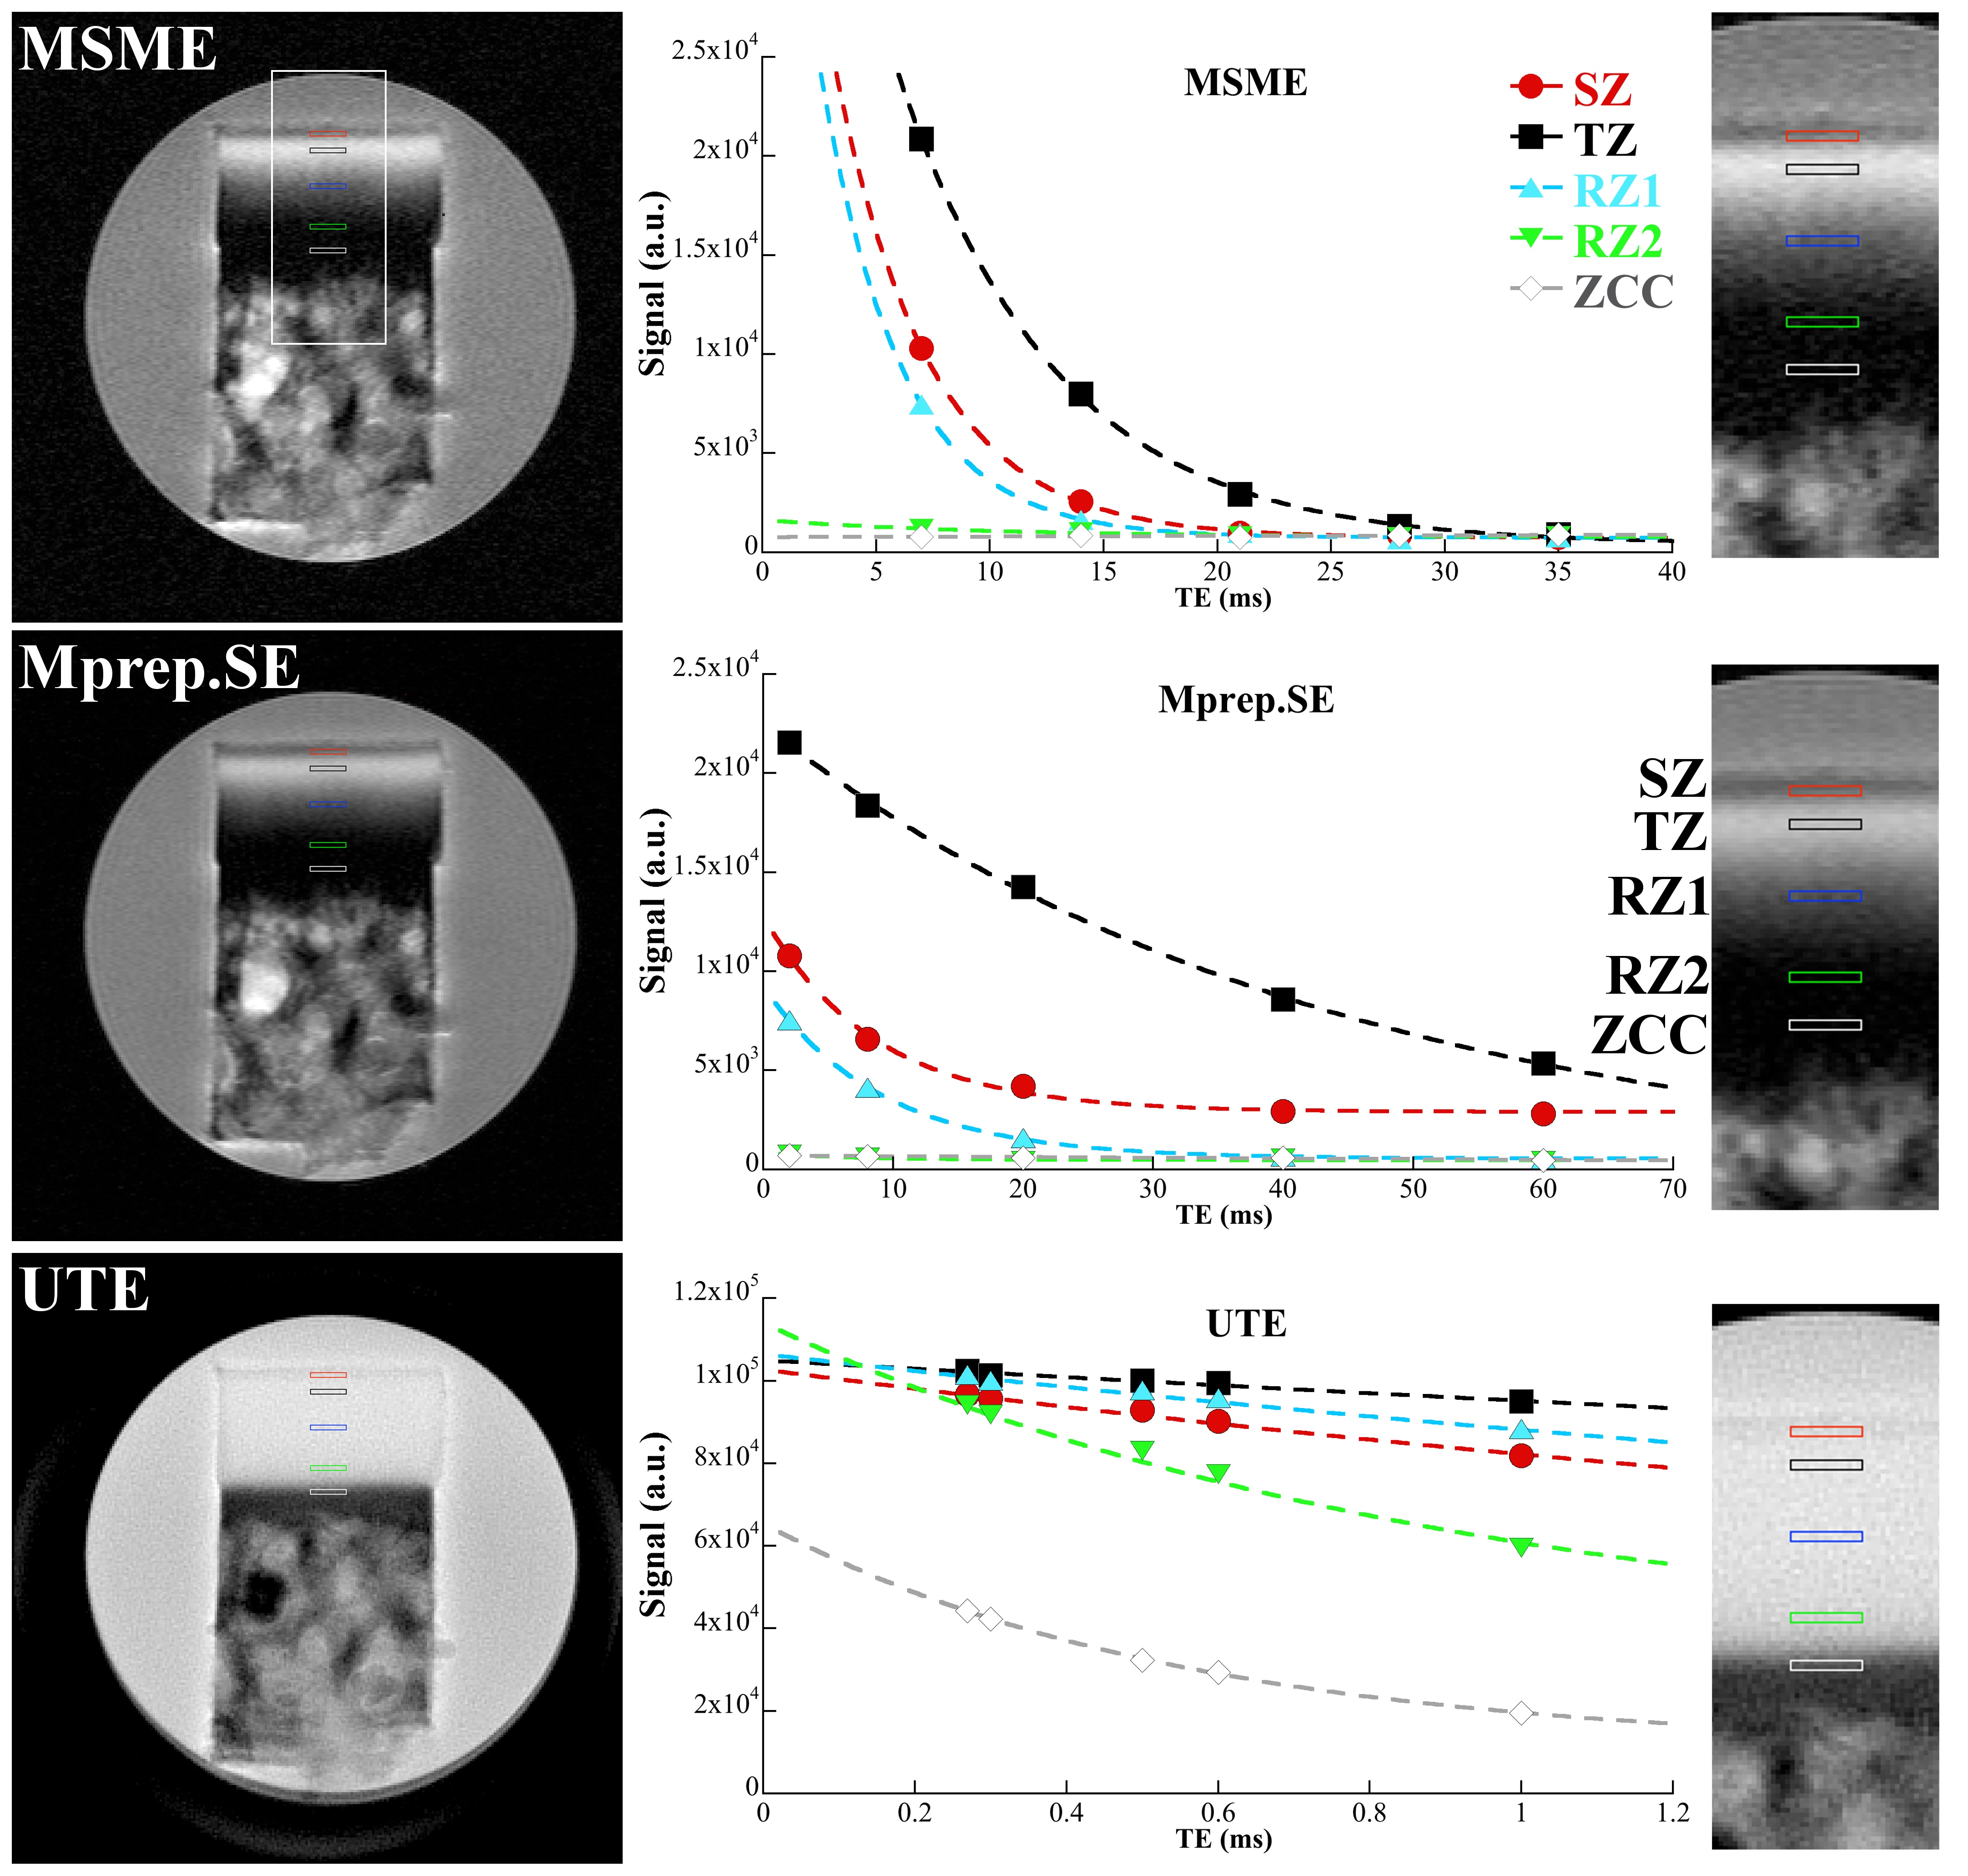
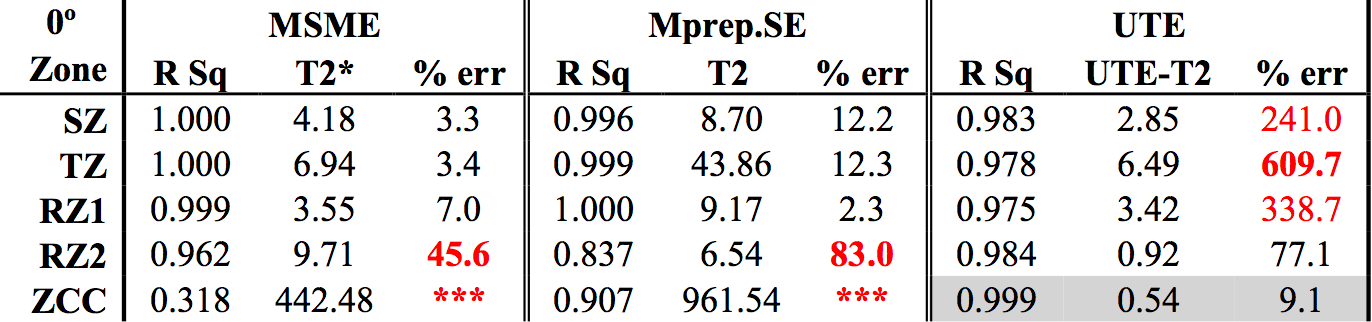
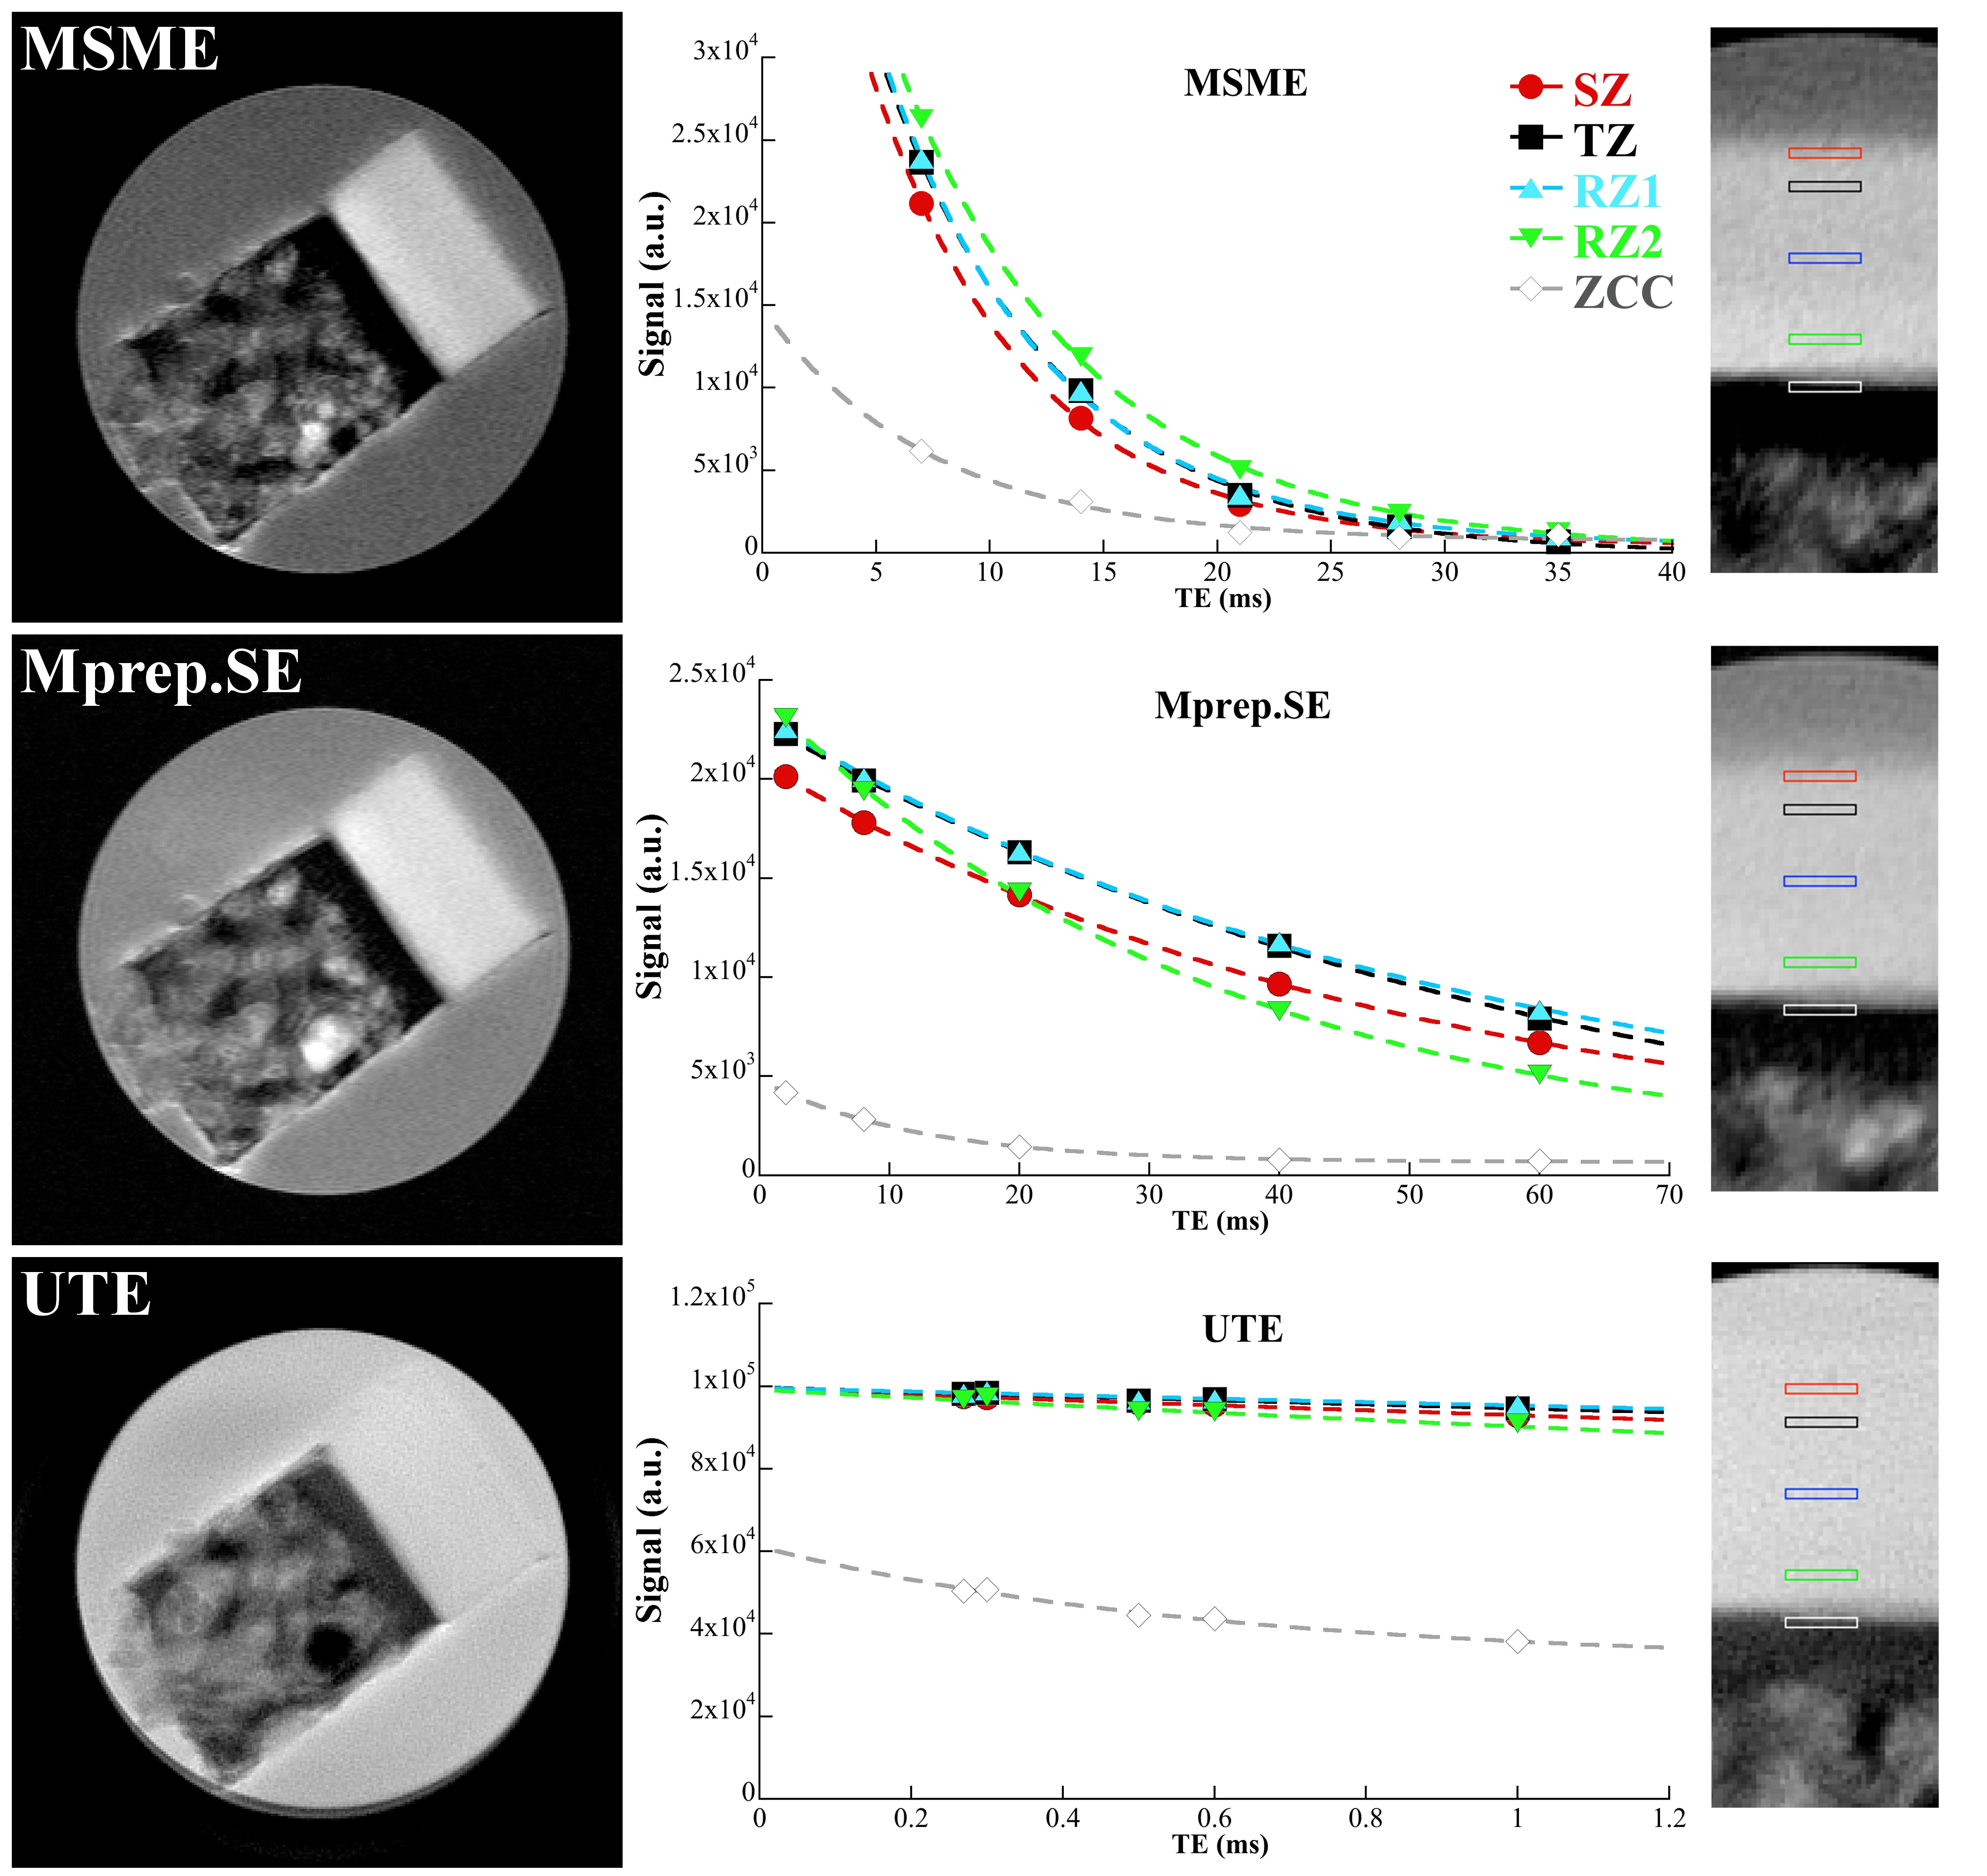
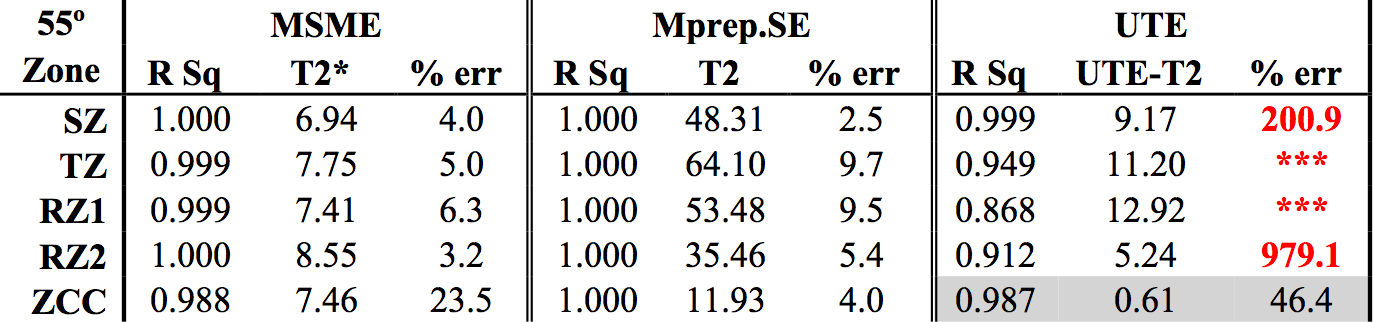
Five cartilage-bone blocks from a canine humeral head (~1.8x3x5 mm3) were harvested for imaging by µMRI and polarized light microscopy (PLM). T2 data was collected using MSME (gradient echo; single slice), magnetized-prepared spin-echo (Mprep.SE) and UTE (2D) sequences at 0º and 55º (magic-angle) orientation. Bruker AVANCEIII-HD system was used with a 7T/9 cm vertical-bore magnet and a 3 mm solenoid coil. The MSME sequence used a FOV of 3 mm and a matrix size of 256x128 (post-reconstruct to 256x256), which yielded an 11.7 µm/pixel resolution, with a TR of 2000 ms and multiple echo times (TE) of 7, 14, 21, 28 and 35 ms. Five UTE images were acquired with echo times at 0.235, 0.3, 0.5, 0.6, and 1 ms, with a TR of 100 ms, an average of 16 scans and a fixed receiver gain. The Mprep.SE sequence was used with a 90º hard pulse with 5 TEs at 2, 8, 20, 40 and 60 ms for T2 contrast. All sequences used the same geometry settings. For correlation of the ZCC region, the same samples were imaged using PLM, where light retardation (nm) and collagen orientation (º) were calculated at 2 µm (5x mag) and 0.25 µm (40x) pixel resolution.Results
The T2-weighted proton maps of cartilage by MSME and Mprep.SE (Fig. 1.a and 1.b) showed the depth-dependent intensity variations of AC, affirming the well-established heterogeneity of the tissue. UTE image of cartilage (Fig 1.c) shows a more homogenous appearance of the tissue. When the sample is set at the magic angle (Fig 2), all sequences yield a homogenous cartilage appearance. A region of interest (colored boxes) was selected in each of the zones including the calcified cartilage region (ZCC). The signal decay using all three sequences are plotted and fit using a single-exponential fit. As shown on the plots and tables, the MSME and Mprep.SE sequence at the long echo times gives a good exponential fit in the SZ, TZ, and RZ1, whereas RZ2 and ZCC show little change in the decay due to the strong dipolar influence on T2. UTE for RZ2 and ZCC showed a reliable decay, which yielded a T2 of 0.54 ms (at 0º) and 0.61 ms at magic angle. Table 2 showed the homogenous T2 value across the non-calcified cartilage, due to the minimization of dipolar interaction at the magic angle, with the ZCC showing an unreliable T2 value in the non-calcified region. The µMRI anisotropy and short UTE-T2 values were compared to the PLM data (not shown) to give a complete understanding of the ZCC.Discussion
Using the spin-echo based sequence and UTE; we can measure both long and short T2 components of non-calcified and calcified cartilage. MSME and Mprep.SE sequences can measure the long T2 and anisotropic properties of non-calcified cartilage and aid the division of the tissue into histological zones at microscopic resolution1. UTE allows the reliable measurement of the deep radial zone (RZ2) as well as the ZCC. UTE also gives the measurement of the short T2 component in the calcified cartilage. By combining the UTE and MSME (or Mprep.SE) intensity data, we can measure the two components in calcified cartilage with more accurate measurement of the ZCC. With the aid of PLM, the high-resolution optical images of ZCC can better provide a correlation between the µMRI and optical orientation of collagen orientation in the ZCC at microscopic resolution.Conclusion
UTE can measure the characteristic T2 in the calcified cartilage region of the tissue; while MSME and Mprep.SE allow the measurement of tissue heterogeneity for most of the non-calcified tissue. It is anticipated that with the capability of measuring short T2 with UTE in ZCC and high magnification PLM images, we can quantitatively measure the calcified cartilage using non-invasive µMRI.Acknowledgements
The authors are grateful to the National Institutes of Health for the R01 grants (AR052353 and AR069047). The authors thank Dr. Dieter Gross and Thomas Oerther (Bruker, Germany) for helping with the UTE sequence. The authors thank Dr. Hani Sabbah (Henry Ford Hospital, Detroit) for providing the canine specimens.References
1. Xia Y, Moody JB, Alhadlaq H. Orientational Dependence of T2 Relaxation in Articular Cartilage: A Microscopic MRI (µMRI) Study. Magn Reson Med. 2002;48:460-69
2. Shao H, Chang EY, Pauli C, et al. UTE bi-component analysis of T2* relaxation in articular cartilage. Osteoarthr Cartil. 2016;24(2):364-373.
3. Du J, Carl M, Bae WC, et al. Dual inversion recovery ultrashort echo time (DIR-UTE) imaging and quantification of the zone of calcified cartilage (ZCC). Osteoarthr Cartil. 2013,:21:77-85.
Figures