1387
The b-value dependence of apparent diffusion coefficient (ADC) values in the knee cartilage1Radiology, Stanford University, Stanford, CA, United States, 2Radiology, Sungkyunkwan University, Suwon, Korea, Republic of, 3Radiology, Harvard Medical School, Charlestown, MA, United States
Synopsis
Apparent diffusion coefficient (ADC) can be a useful marker to track the degeneration of the knee cartilage during the early stage of osteoarthritis. We recently observed that the estimated ADC values change depending on the adopted b-values used in a DW-EPI sequence. We tested our hypothesis about this b-value dependence of ADC with in-vivo knee scans of 7 healthy subjects. Our statistical test result shows that the ADC estimated with the smaller b-values (0~150 s/mm2) is significantly higher than the ADC estimated with the larger b-values (0~800 s/mm2), suggesting the possibility of multi-component diffusion in the knee cartilage.
Introduction
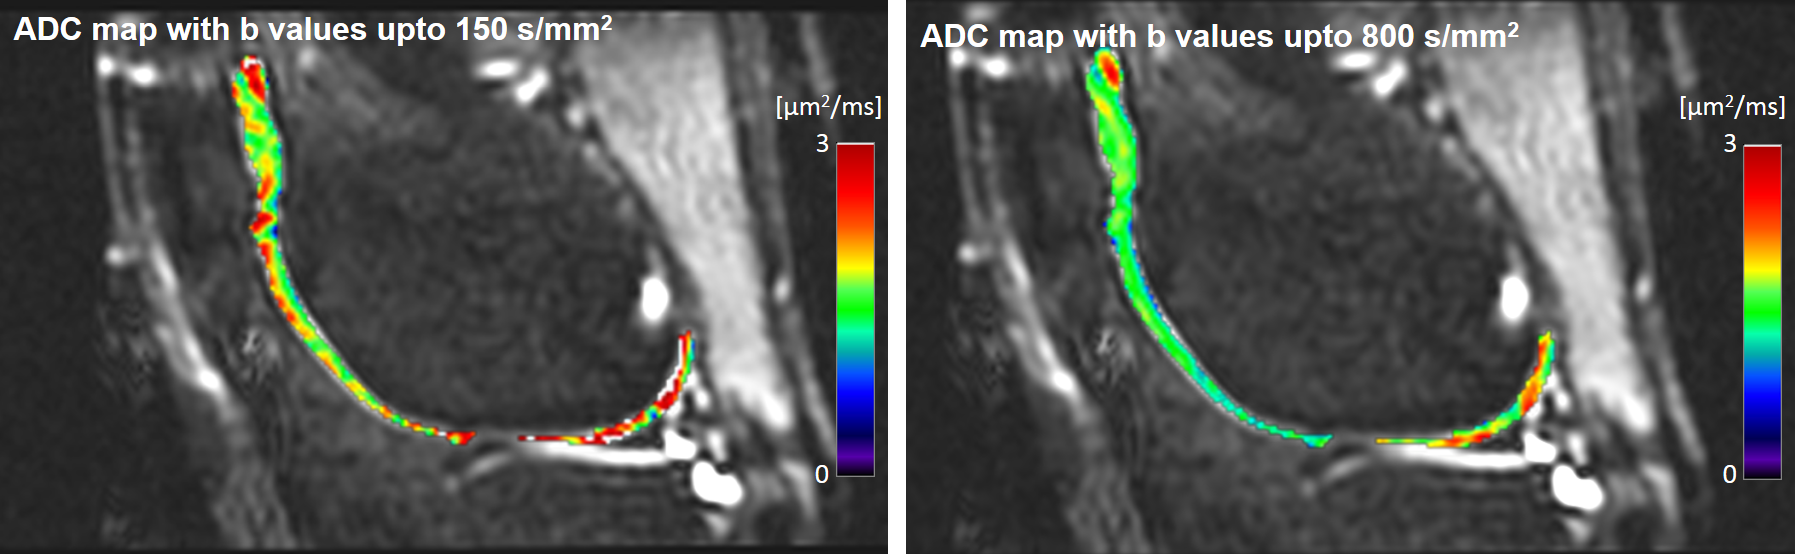
Osteoarthritis (OA) is one of the world’s most prevalent degenerative diseases, affecting 27 million adults in the U.S.1, costing $185 billion dollars every year2. Several quantitative MRI approaches have recently introduced promising biomarkers for the early degenerative changes in OA3-5 to facilitate the treatment before irreversible damage occurs. The apparent diffusion coefficient (ADC) is correlated to proteoglycan concentration and can therefore serve as a potential marker for monitoring the change during early cartilage degeneration due to OA5. Diffusion weighted echo planar imaging (DW-EPI) is commonly used to measure ADC by fitting an exponential curve to a set of measurements obtained with different b-values. We recently observed that the estimated ADC value differed significantly depending on the range of b-values adopted in the DW-EPI sequence (Figure 1). In this work, we tested our hypothesis that the ADC value depends on the range of b-values with in-vivo knee scan data.Methods
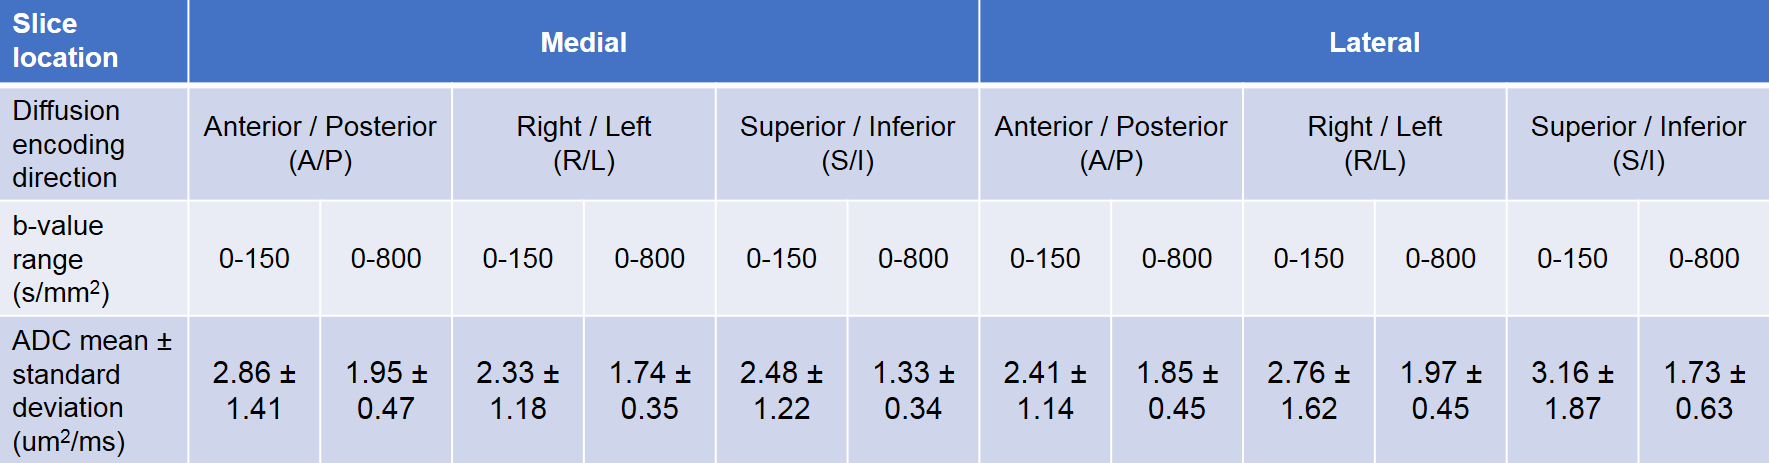
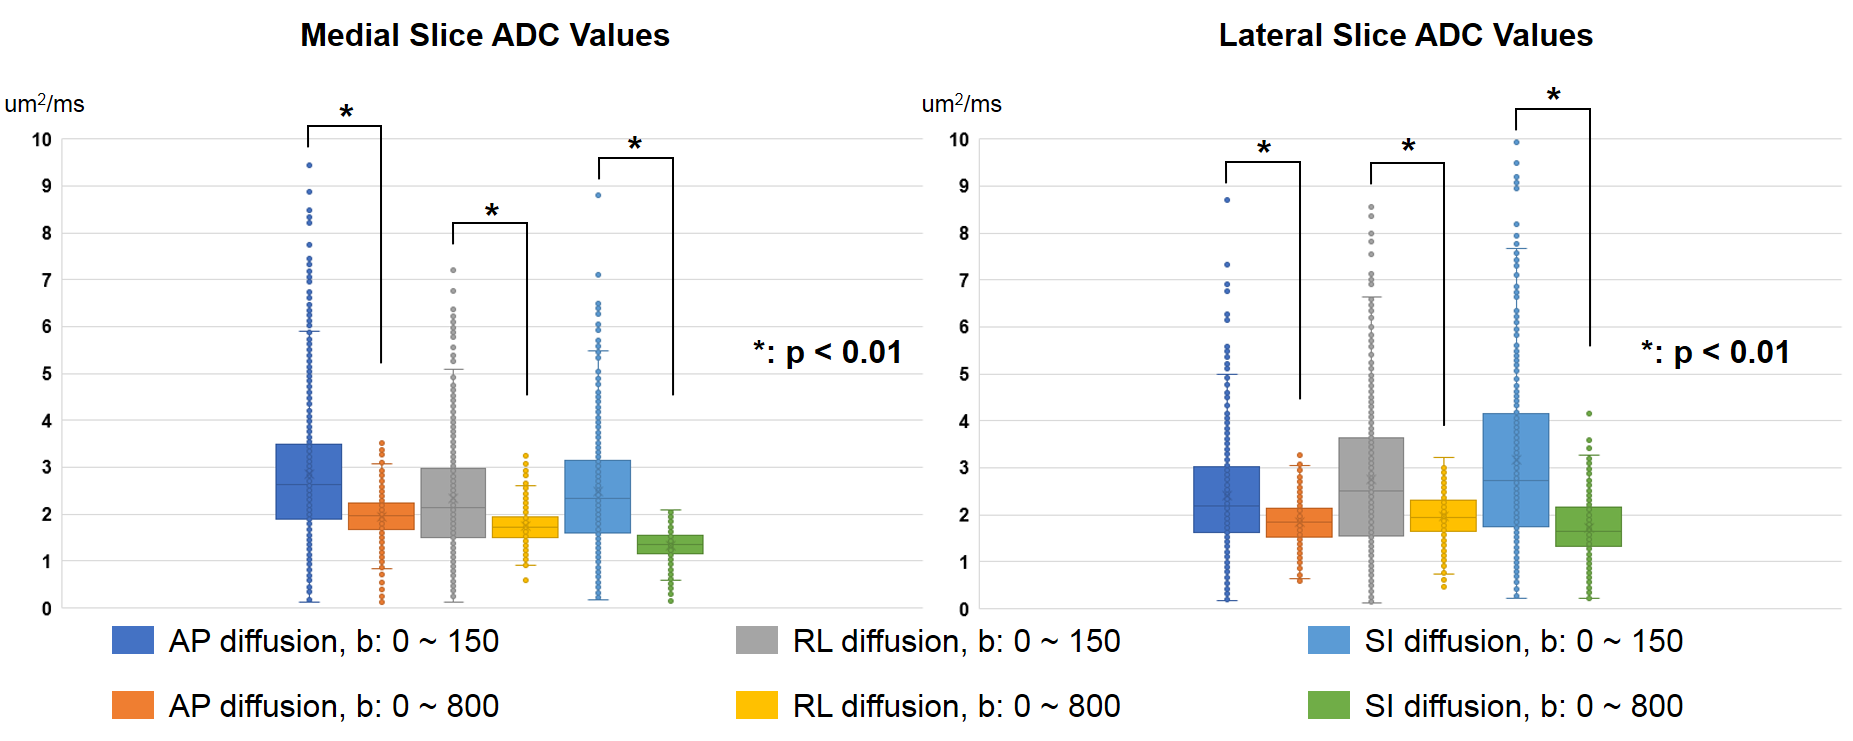
We estimated the ADC of the femoral knee cartilage using b-values of 0, 50, 100, and 150 s/mm2 and compared it with the ADC estimated using b-values of 0, 50, 100, 150, 200, 400, 600, and 800 s/mm2. A DW-EPI sequence with reduced field-of-view (FOV) excitation was employed for sagittal knee image acquisition to minimize distortion. The imaging FOV was 18cm x 9cm over the 120 x 60 acquisition matrix size, and 44 slices, 3mm thick, were acquired. Three different diffusion directions, anterior-posterior, right-left, superior-inferior, were adopted to test if the ADC difference may be related with a certain diffusion direction. 7 healthy volunteers were enrolled in imaging experiments after signing an informed consent form approved by the institutional review board. The subject scans were performed in a 3T GE MRI scanner (MR 750, GE Healthcare, Waukesha, WI, USA) using a 16-channel flex coil. For each subject, one lateral and one medial slice were chosen to segment the femoral condylar cartilage for the ADC analysis. The ADC was estimated using an ADC calculation plug-in6 for the Horos image analysis software (www.horosproject.org). The two-sided Mann-Whitney U test was performed to evaluate the median difference of ADC values of the posterior femoral condylar cartilage between the two b-value groups in different slices and diffusion encoding directions.Results
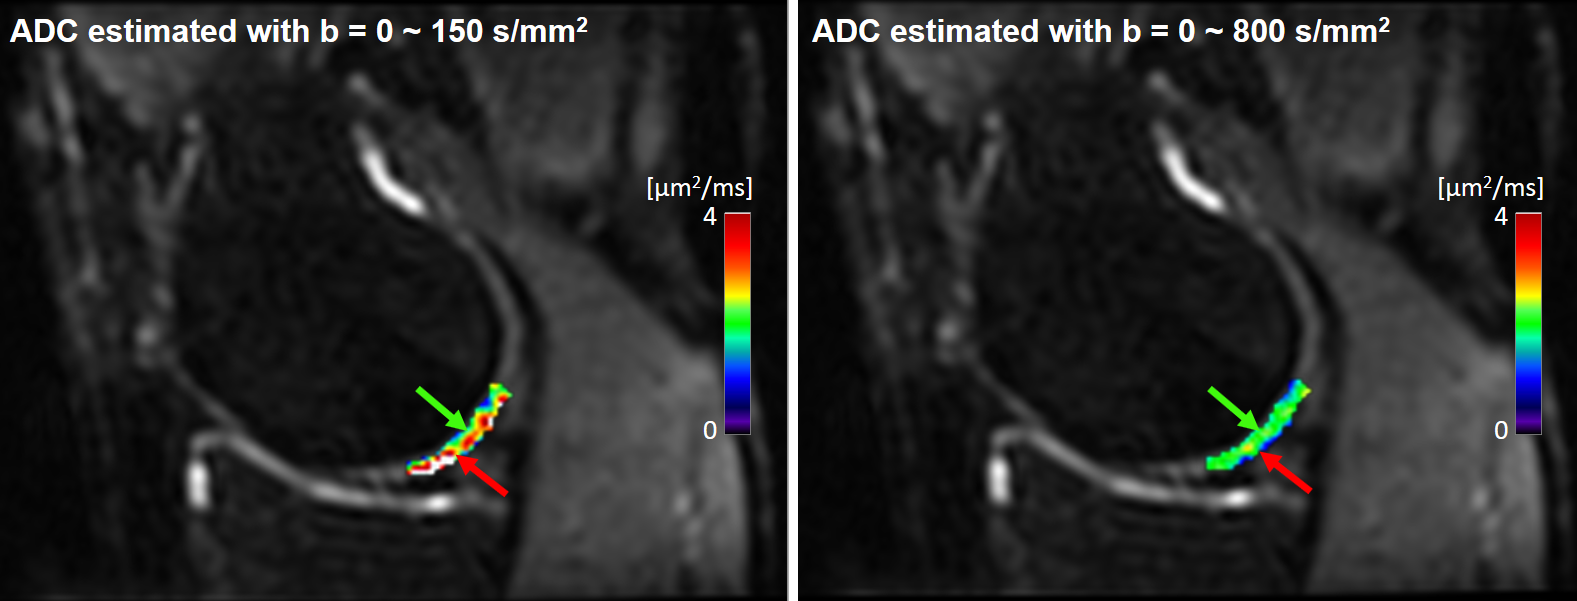
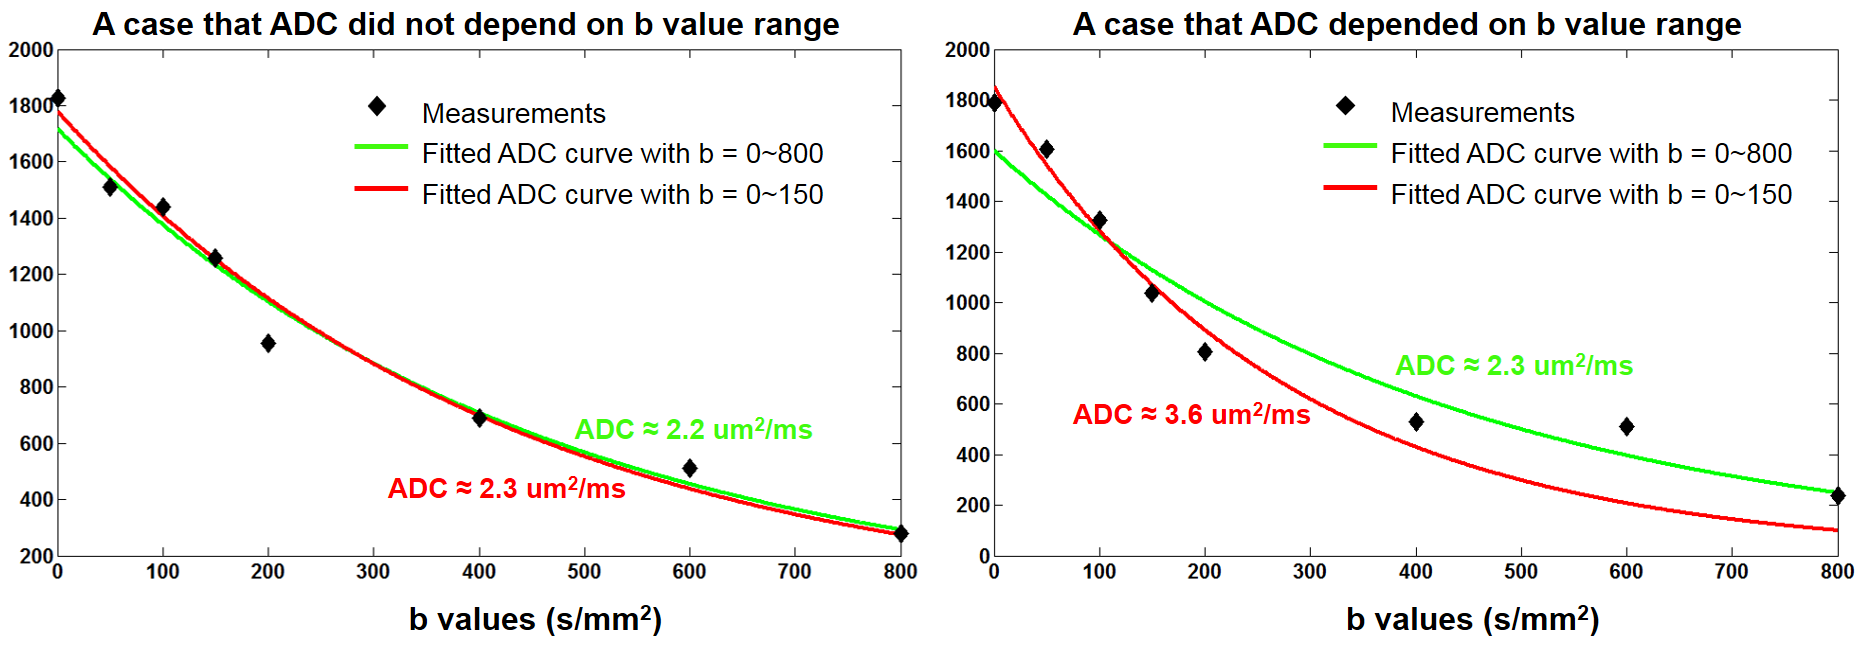
The ADC values estimated with the b-values from 0 to 800 s/mm2 were more homogeneous and locally lower than the ADC values with the b-values from 0 to 150 s/mm2 in the overall femoral knee cartilage (Figure 1) and its posterior condylar section (Figure 2). Figure 3A demonstrates a case where the estimated ADC is about the same between the two b-value groups (green arrows in Figure 2). Figure 3B shows a case where the estimated ADC with the smaller b values were much higher than that estimated with the larger b values. (red arrows in Figure 2). The mean of the ADC estimated with the smaller range of b-values was generally higher than the mean of the ADC estimated with the larger range of b-values in all diffusion directions and slice locations (Table 1). Mann-Whitney U test results showed statistically significant differences of ADC values between different b-value groups for a given slice and a diffusion encoding direction (Figure 4).Discussion
In the analyzed posterior femoral knee cartilage areas, using a small range of b-values (0-150 s/mm2) yielded ADC values with significantly increased mean and standard deviation compared to ADC values with larger b-values (0-800 s/mm2). This increasing tendency of the estimated ADC values with the smaller b-values toward that free water (~3.0 um2/ms) when the measurement SNR is high may support that the ADC difference between two b-value groups could be driven rather by another species in the cartilage with a higher diffusion rate than by random noise. However, the largely increased standard deviation of the estimates suggests that the existence of such diffusion species may be spatially varying. Cartilage is known to have a layered structure, and each layer may have a different diffusivity. Unfortunately, the low spatial resolution of the DW-EPI sequence limited differentiation of ADC values between different layers. Further study will be pursued to investigate the source of the observed b-value dependence in the ADC estimates and its potential sensitivity to the pathologic conditions developed in early OA.Conclusion
In this abstract, we have demonstrated the dependence of ADC estimates on the b-values used in a DW-EPI scan of the posterior femoral condylar cartilage region. Our result shows that ADC estimates tend to increase with smaller b-values used.Acknowledgements
NIH R01 AR0063643, NIH P41 EB015891, GE Healthcare.References
1. Lawrence RC, Felson DT, Helmick CG, Arnold LM, Choi H, Deyo RA, Gabriel S, Hirsch R, Hochberg MC, Hunder GG, et al. Estimates of the prevalence of arthritis and other rheumatic conditions in the United States: Part II. Arthritis & Rheumatism. 2007;58(1):26-35.
2. Kotlarz H, Gunnarsson CL, Fang H, Rizzo JA. Insurer and out-of-pocket costs of osteoarthritis in the US: Evidence from national survey data. Arthritis & Rheumatism. 2009;60(12):3546-3553.
3. Mosher TJ, Dardzinski BJ. Cartilage MRI T2 relaxation time mapping: overview and applications. Seminars in Musculoskeletal Radiology. 2004;8(4):355-368.
4. Borthakur A, Mellon E, Niyogi S, Witschey W, Kneeland JB, Reddy R. Sodium and T1p MRI for molecular and diagnostic imaging of articular cartilage. NMR in Biomedicine. 2006;19:781-821.
5. Raya JG, Melkus G, Adam-Neumair S, Dietrich O, Mutzel E, Kahr M, Reiser MF, Jakob PM, Putz R, Glaser C. Change of diffusion tensor imaging parameters in articular cartilage with progressive proteoglycan extraction. Investigative Radiology. 2011;46(6):401-409.
6. Hargreaves BA. ADC Map Calculation. https://web.stanford.edu/~bah/software/ADCmap/
Figures