1383
The parameters of Intravoxel Incoherent Motion Diffusion-Weighted Imaging for evaluating microstructure of bone marrow in myeloproliferative diseases: a Pilot Study1The second hospital of Shanxi Medical University, taiyuan, China, 2Healthcare,MR Research China, Beijing, China, 3Department of Radiology, Northwestern University, Chicago, American Samoa
Synopsis
Many myeloproliferativediseases,e.g., anemia and acute leukemia, impair microstructure of bone marrow. However, it is unclear the relationship between parameters of IVIM and microstructure of bone marrow (cellullarity, and microvessel density).Texture analysis was performed on D, D* and fmaps of the spinal bone marrow extracted from IVIM MRI on 48 patients (28 patients with acute leukemia and 20 patients with anemia). Bone marrow cellularity and MVD were significantly different between two groups. The f values in group of acute leukemia were significantly higher than that of anemia . The texture parameters of D, D* and f mapping has potential to reveal heterogeneous feature of microstructure in bone marrow.
Introduction
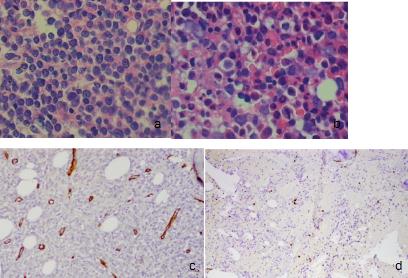
Bone marrow is the fourth largest organ of the human body. Bone marrow microstructure changes, such as increased cellularity and microvessel density(MVD) of marrow, are associated with a poor prognosis in acute leukemia(AL). Histological analysis following iliac crest puncture was invasive and subject to sampling errors. Intravoxel incoherent motion (IVIM)diffusion weighted MRI (DWI) in prognosticating patients with acute myeloid leukemia (AML) and Multiple Myeloma (MM) . However, it is unclear the relativity between parameters of IVIM and microstructure of bone marrow (cellullarity, MVD ) in histopathology . Compared with cellularity and microvessel density (MVD), this study was sought to assess the difference of parameters from IVIM and IVIM mapping texture between anemia and acute leukemia (AL) in marrow and analyze the value of evaluating microstructure of bone marrow.Methods
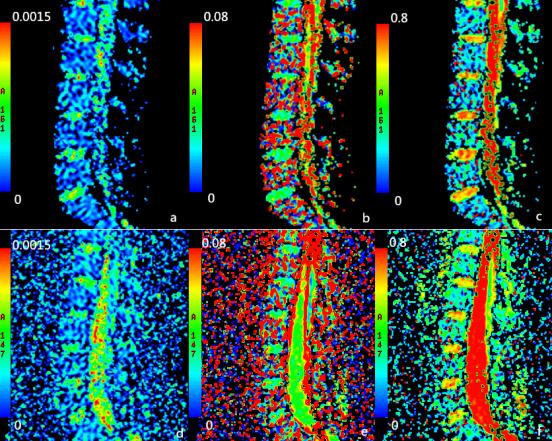
48 patients (28 patients with AL and 20 patients with anemia; mean age, 45.9 years; range, 16-70 years) were included in this study. The samples of bone marrow biopsy were obtained from ilium in all patients before MRI study, the cellularity and MVD were counted under a microscope. MRI scan of the lumbar spine was performed before therapy on a whole body 3T scanner (Silent, GE Healthcare). The scan sequences included a sagittal T1-weighted and a sagittal IVIM DWI (with 11 b values of 0, 10, 25, 50, 100, 200, 400, 600, 800, 1000, and 1200 s/mm2).The D, D* and f values of the bone marrow were measured on GE AW 4.4 Workstation, D, D* and f mapping were imported into MaZda software for texture analysis.Results
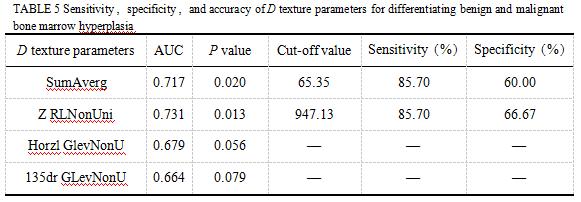
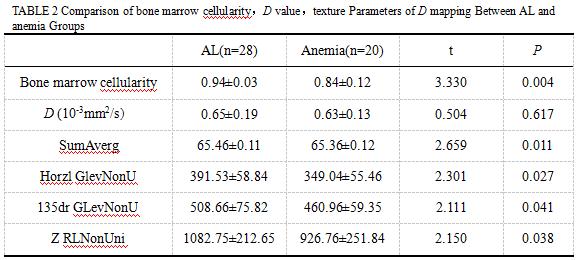
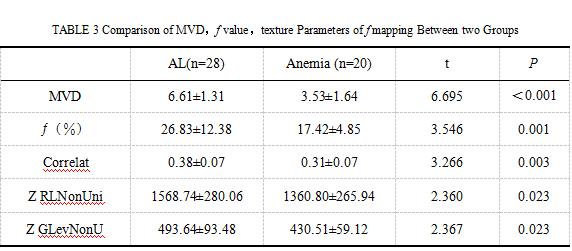
Bone marrow cellularity of AL was significantly higher than that of anemia group (P=0.004). There was no apparent difference of D values between the two groups (P=0.617), whereas SumAverg,Horzl GlevNonU,135dr GLevNonU,Z RLNonUni of D mapping were notably higher than those of anemia group (P=0.011, P=0.027, P=0.041, P=0.038, respectively).In ROC analysis, the AUC of Z RLNonUni of D mapping was 0.731, when we evaluated different bone marrow microstructures of the two groups. MVD and f value of AL group were remarkably higher than those of anemia group (P=0.001, P=0.001, respectively). Correlat,Z RLNonUni,Z GLevNonU of f mapping were significantly higher than those of anemia group (P=0.003, P=0.023, P=0.023, respectively). In ROC analysis, the AUC of Correlat,Z RLNonUni, Z GLevNonU of the f mapping were 0.743, 0.710,0.700,respectively,when we evaluated different bone marrow microstructures of the two group. The AUC of f was 0.752,which was greater than the texture parameter of f mapping. There was no significant difference of the D* values between the two group ( P=0.081), whereas some texture parameters of D* mapping were notably higher than those of the anemia group.Discussion
Noninvasive characterization of bone microstructure can be significant to many bone marrowdiseases. Our study showed that higherf value of AL group was consistent with the higher MVDof AL group comparing to those of anemia group, indicating f value from noninvasive IVIMtechnique have potential to evaluate the MVD of marrow. In addition, our results showedsignificant differences existon the parameters of texture analysis of IVIM maps from AL andanemia patients. These results give us a reminder that texture parameters derived from IVIMmaps can use to evaluate cellular heterogeneity of marrow from the three-dimensional space,such as inhomogenous array of cell along trabecular bone.
Conclusion
The microstructures (cellularity and MVD) of bone marrow in anemia and AL were different. The f value can be a noninvasive biomarkers for the evaluation of the microstructure of myeloproliferative diseases .The texture parameters of D, D* and f mapping were potentially valuable to reveal heterogeneous feature of microstructure in bone marrow.Acknowledgements
No acknowledgement found.References
1. Togao O, Hiwatashi A, Yamashita K, et al. Measurement of the perfusion fraction in brain tumors with intravoxel incoherent motion MR imaging: validation with histopathologic vascular density in meningiomas. Br J Radiol 2018;91:20170912.
2. Niu J, Li W, Wang H, et al. Intravoxel incoherent motion diffusion-weighted imaging of bone marrow in patients with acute myeloid leukemia: a pilot study of prognostic value.[J]. Journal of Magnetic Resonance Imaging, 2017, 46(2):476-482.
3. Predicting chemoradiotherapy response of nasopharyngeal carcinoma using texture features based on intravoxel incoherent motion diffusion-weighted imaging. Medicine 2018;97:e11676
4. Bourillon C, Rahmouni A, Lin C, et al. Intravoxel incoherent motion diffusion-weighted imaging of multiple myeloma lesions: correlation with whole-body dynamic contrast agent-enhanced MR imaging. Radiology 2015;277:773–783
5. Sub S Y, Min P C, Min L S, et al. Reproducibility of histogram and texture parameters derived from intravoxel incoherent motion diffusion-weighted MRI of FN13762 rat breast Carcinomas. Anticancer Research 2014;34:2135-2144.
Figures