1382
Assessment of Multiple Myeloma pH Using AcidoCEST-FISP MRI at 7T1University of Arizona, Tucson, AZ, United States, 2Department of Radiology, University of California San Diego, San Diego, CA, United States, 3Radiology Service, VA San Diego Healthcare System, San Diego, CA, United States, 4Research Service, Greater Los Angeles Veterans Administration Healthcare System, Los Angeles, CA, United States, 5Department of Cancer Systems Imaging, University of Texas MD Anderson Cancer Center, Houston, TX, United States
Synopsis
Hypoxic conditions in multiple myeloma (MM) lesions drive anaerobic glycolysis and tumor acidosis, which contributes to tumor aggression and metastasis. In vivo imaging of acidosis in these lesions is important for determining the role of extracellular pH (pHe) in the pathology and spread of MM tumors. In this study, we use a novel imaging technique called chemical exchange saturation transfer (CEST) MRI to measure acidosis in vivo. We show that we are able to measure pH in MM lesions located in both vertebral bodies and regions of the knee using CEST MRI.
Introduction
Multiple myeloma (MM) is a largely incurable malignancy characterized by dissemination of tumor cells in the bone marrow (BM).1 Hypoxic conditions in the BM cause tumor cell metabolism to favor anaerobic glycolysis, resulting in lactic acid production and subsequent decrease in extracellular pH (pHe), which is implicated in tumor aggression and metastasis.2
In this preliminary study, we evaluated BM acidosis in an orthotopic MM mouse model using the novel pH-sensitive imaging technique called referred to as chemical exchange saturation transfer (acidoCEST) MRI.3 The ability to accurately measure pHe in vivo will enable future research into the role of acidosis in MM malignancy.
Methods
Orthotopic BM engrafted MM xenografts were established by IV challenge in 12 NOG mice using the human 8226 myeloma cell line. Tumor development in the BM was monitored with luciferase activity4 and lesions were confirmed by µCT on a Skyscan 1076 (Kontich, Belgium) at 30 µm isotropic voxel size. Once tumors took residence in BM, mice were first imaged with 18F-FMISO PET on a PerkinElmer G8 PET/CT scanner and then with the acidoCEST-FISP MRI sequence on a Bruker BioSpec 7 T,5 using a Bruker quadrature coil. During all MR imaging, mice were anesthetized with 2.0% isofluorane, maintained at a respiration rate of 35-40 bpm, and maintained at a body temperature of 37°C. For acidoCEST MR imaging, mice were injected with 370 mg/mL iopamidol (200 μL IV bolus and 400 μL/hr IV infusion) and scanned with a 6 sec saturation time at 3.5 μT, with a 300 ms acquisition time. Pixel-wise parametric maps of BM pHe values were generated via fitting the CEST spectrum with the Bloch-McConnell equations. Average pHe of each ROI was recorded. Histology was performed and all lesions were confirmed by H&E staining. To date, immunostaining with carbonic anhydrase 9 (CA9) and propidium iodide has been performed for two lesions, one more hypoxic and one less hypoxic (partially normal) as determined by FMISO PET.Results and Discussion
MM lesions were successfully imaged with acidoCEST MRI. Parametric pHe maps of tumor ROIs showed sufficient contrast agent uptake and regions of acidosis in the tumors. The pHe of all pixels in each ROI was averaged to yield a pHe value for each lesion (Figure 1). Bioluminescence was used to determine initial presence of tumors (Figure 2A), which were then imaged with acidoCEST MRI. Representative tumors in the vertebral bodies ranged in pH from 6.59-6.62 (Figure 2B), and lesion identity was confirmed by µCT (Figure 2C). Similarly, lesions in the knee averaged a pH of 6.83 (Figure 2D), and lesion identity was confirmed by µCT (Figure 2E). Average pHe values for all lesions ranged from 6.47 to 7.39.
Preliminary immunostaining was done on two lesions which were evaluated for hypoxia with FMISO PET. In the less hypoxic tumor (Figure 3A), low levels of CA9 (red) is expressed in fatty marrow. In the hypoxic tumor (Figure 3B), there is a high level of expression of CA9, which is consistent with the results of FMISO PET.
Conclusion
In this preliminary study, we demonstrate that acidosis in MM tumors can be imaged with acidoCEST MRI. Subsequent studies will further explore the relationship between tumor hypoxia, acidosis, and aggression.Acknowledgements
The authors gratefully acknowledge grant support from the VA Rehabilitation R&D Service (I01RX002604) and NIH (R21AR073496).References
1. Fairfield H, Falank C, Avery L, Reagan MR. Multiple myeloma in the marrow: pathogenesis and treatments. Ann N Y Acad Sci. 2016;1364(1):32-51.
2. Chiche J, Brahimi-Horn MC, Pouysségur J. Tumor hypoxia induces a metabolic shift causing acidosis: a common feature in cancer. J Cell Mol Med. 2010;14(4):771-794.
3. Jones KM, Randtke EA, Howison CM, Pagel MD. Respiration gating and Bloch-fitting improve pH measurements with acidoCEST MRI in an ovarian orthotopic tumor model. Proc SPIE Int Soc Opt Eng. 2016;27:9788.
4. Gastelum G, Chang EY, Shackleford D, et al. Multimodal bioluminescent and positronic-emission tomography/computational tomography imaging of multiple myeloma bone marrow xenografts in NOG mice. Jove. (in press).
5. Chen LQ, Howison CM, Jeffery JJ, et al. Evaluations of extracellular pH within in vivo tumors using acidoCEST MRI. Magn Reson Med. 2014;72(5):1408-17.
Figures
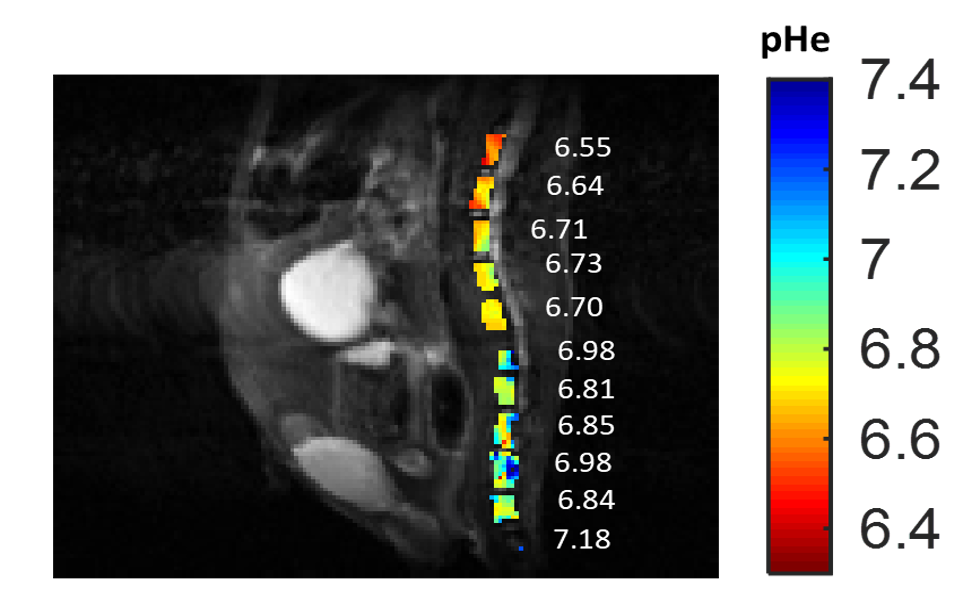
Figure 1. Representative parametric map of pHe values in mouse BM. Values show average pHe for all pixels in that ROI.

