1379
Exploratory evaluation of magnetic resonance fingerprinting confirms increased T1 and T2 in metastatic breast and prostate cancer lesions compared with normal marrow and volunteer values1CRUK Cancer Imaging Centre, Division of Radiotherapy and Imaging, Institute of Cancer Research, London, United Kingdom, 2Department of Radiology, Royal Marsden NHS Foundation Trust, London, United Kingdom, 3Department of Biomedical Engineering, Case Western Reserve University, Cleveland, OH, United States, 4Department of Radiology, Case Western Reserve University, Cleveland, OH, United States
Synopsis
Magnetic resonance fingerprinting (MRF) is a rapid imaging technique that allows generation of multiple, co-registered quantitative maps from a single sequence. This technique has been evaluated in the brain, abdomen, prostate, breast and heart, but has not been applied to metastatic disease in the skeleton. This abstract documents T1 and T2 values obtained with MRF in metastatic bone disease, muscle, fat and bone marrow, compares them with values obtained in volunteers using gold-standard imaging and MRF and demonstrates increased T1 and T2 in lesions compared with normal marrow and values in volunteers.
Background
Magnetic resonance fingerprinting1 (MRF) is a rapid imaging technique that generates multiple quantitative images from a single sequence that are inherently co-registered. Clinical trials are evaluating its application in brain and prostate tumours, but there is potential in using this technology to better characterise bone disease in cancers. Accurate characterisation of bone disease and its response to treatment remains an unmet need in oncology.Aim
To measure T1 and T2 using MRF in metastatic bone disease, muscle, fat and bone marrow in patients, and compare these with values obtained in volunteers using gold-standard imaging and MRF.Methods
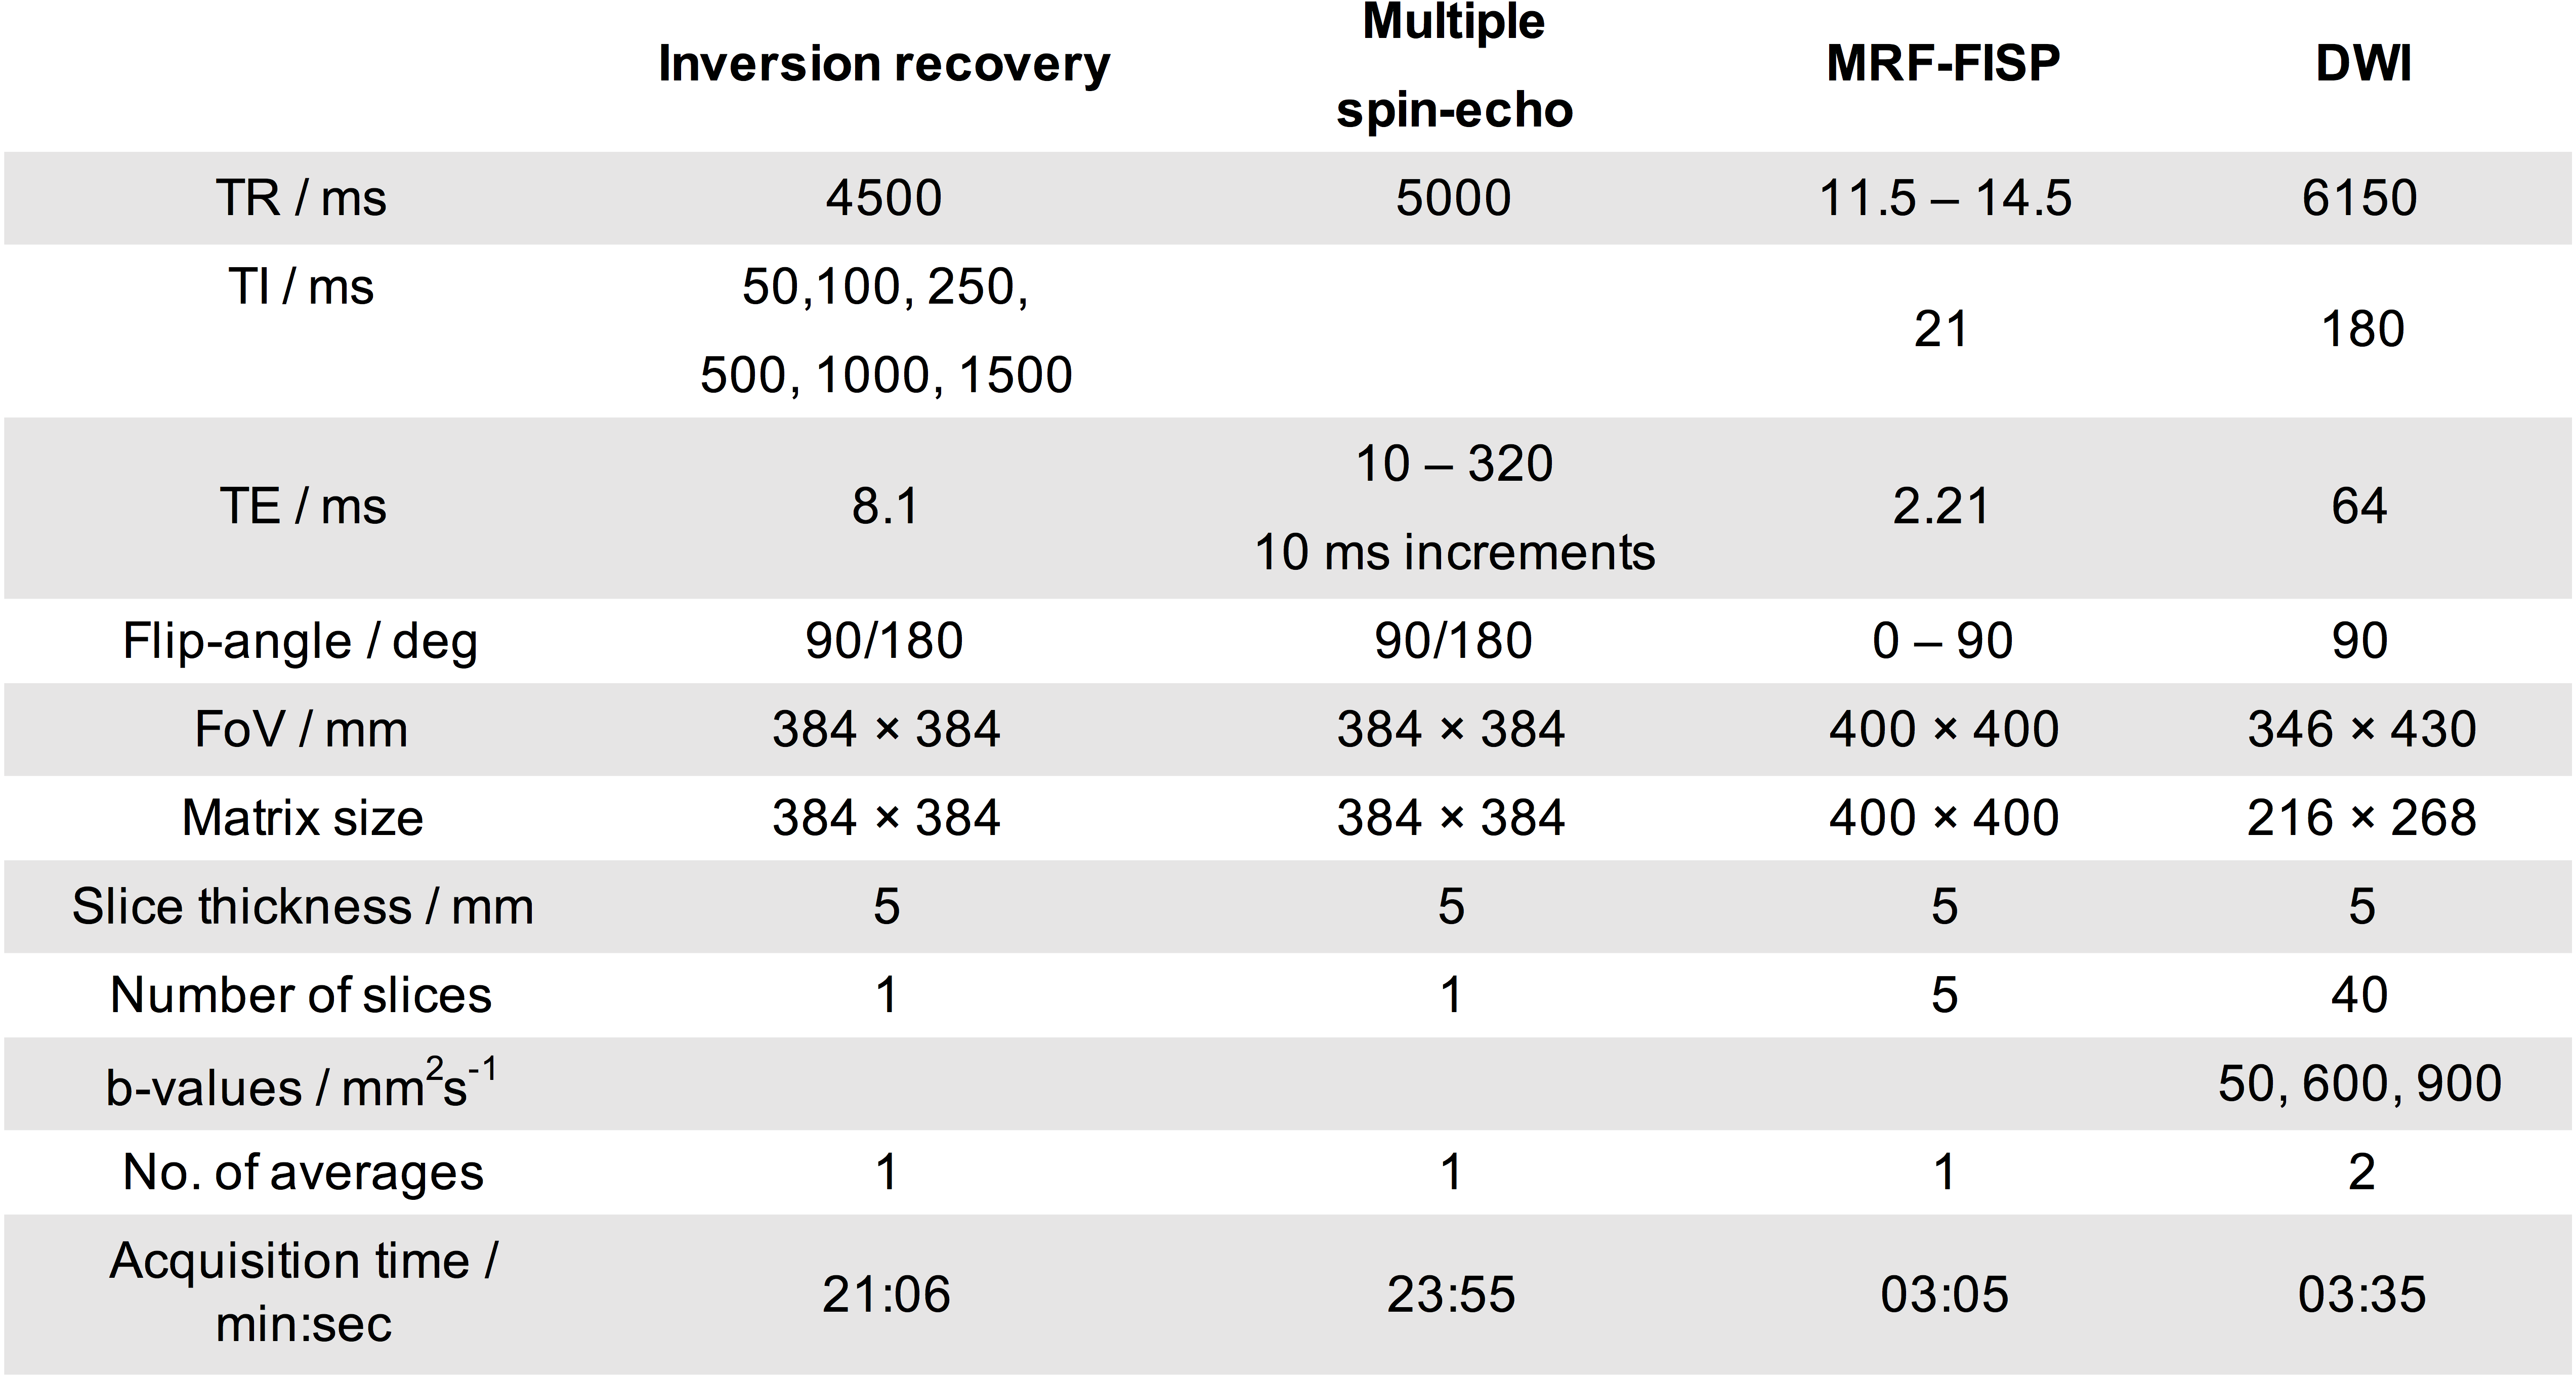
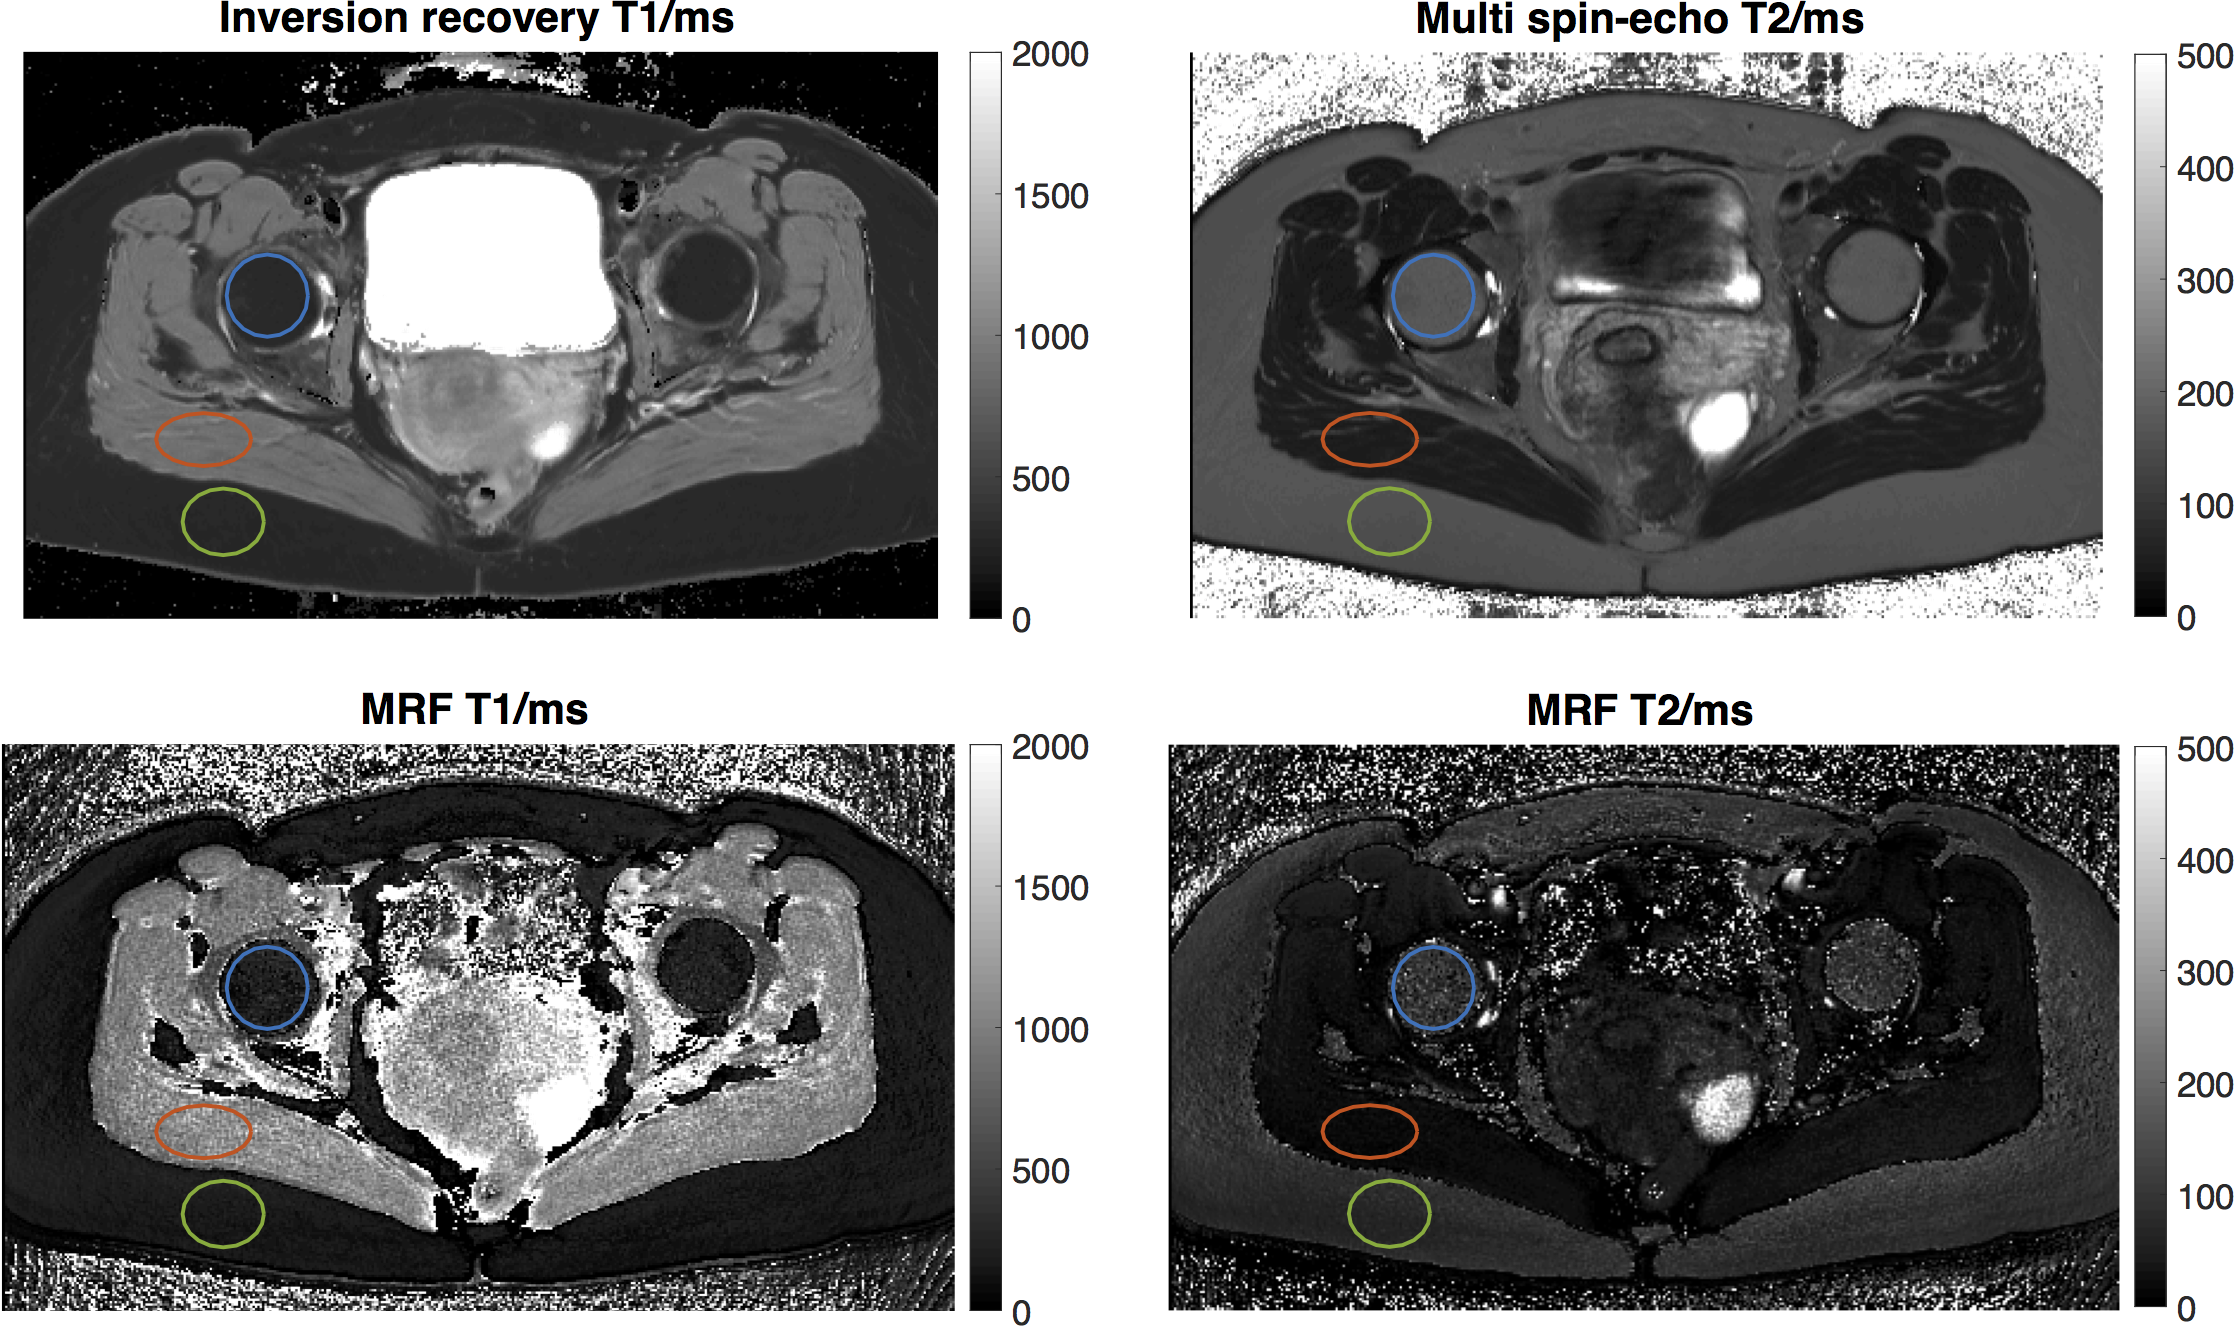
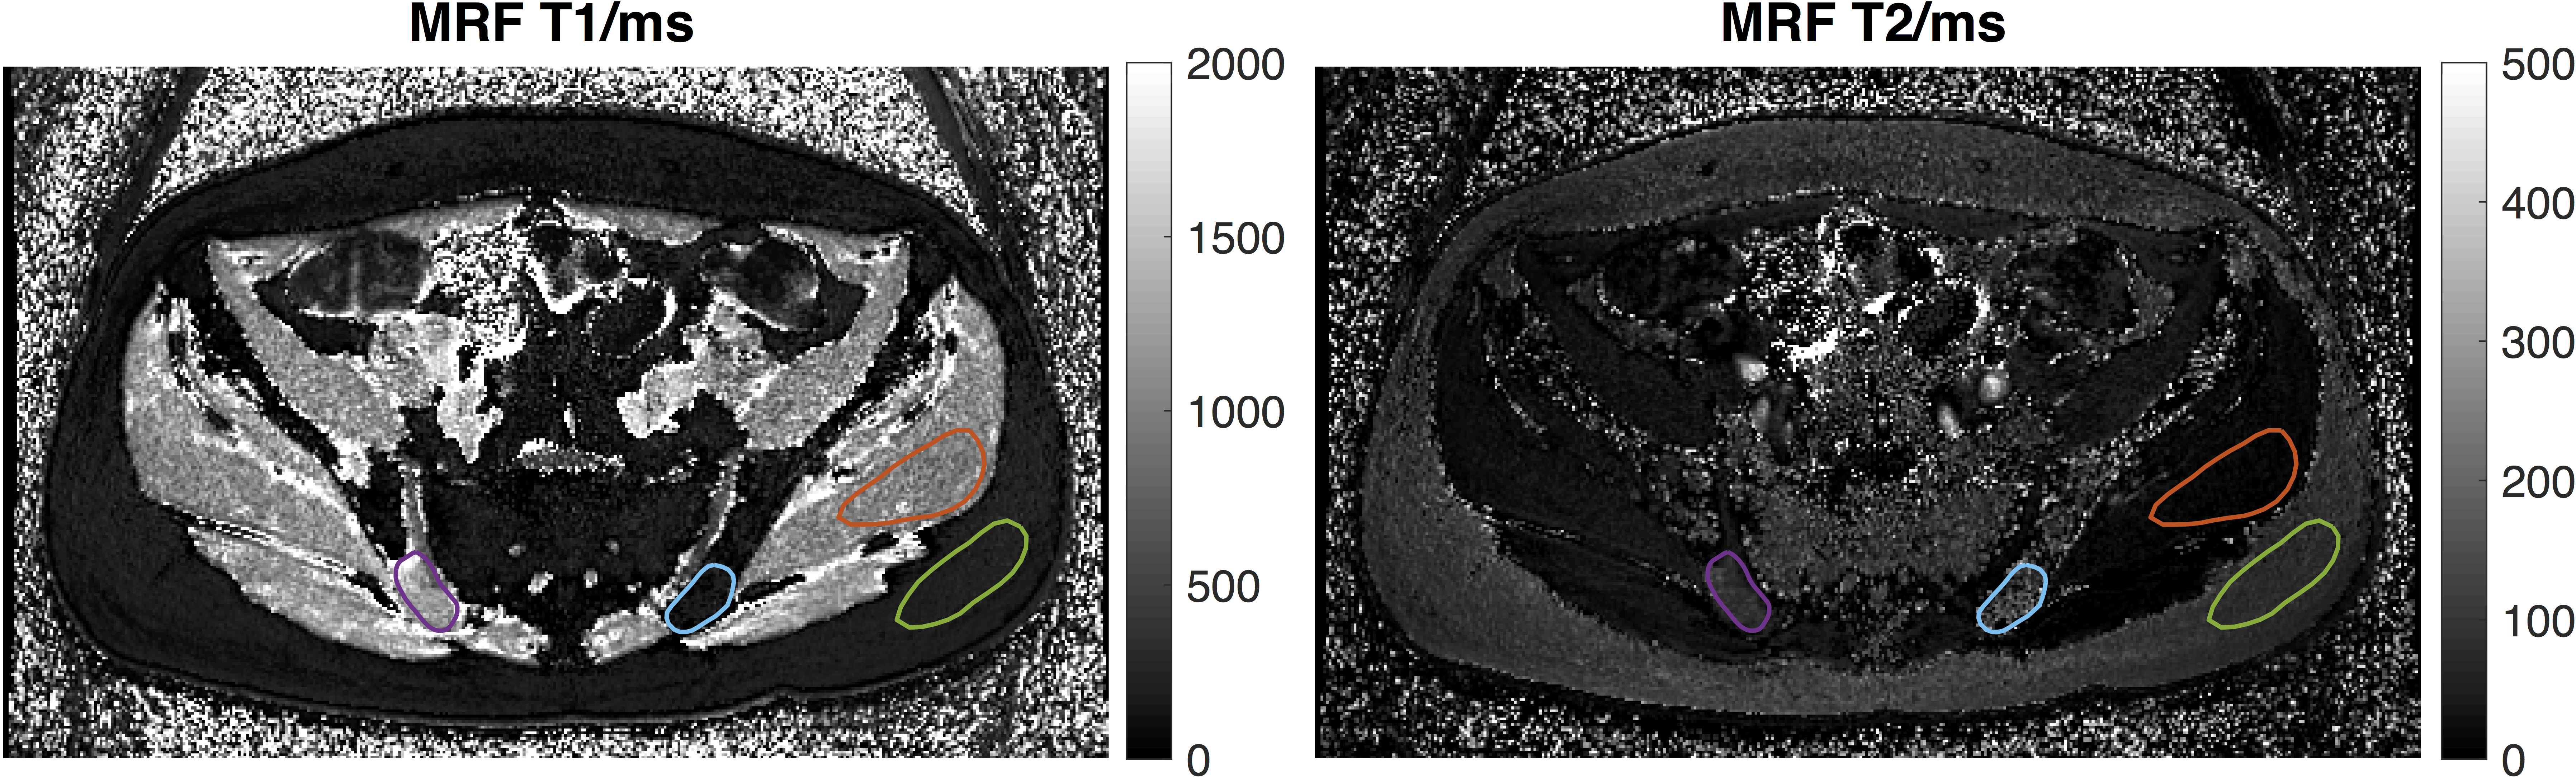
All imaging was performed axially on a 1.5T MAGNETOM Aera (Siemens Healthcare, Erlangen, Germany). In a continuing study, four volunteers (two male 41, 64 yrs, two female 45, 45 yrs) were imaged using a prototype MRF-FISP sequence2 with a Gadgetron-based reconstruction3 to generate T1 and T2 maps. Gold-standard maps were also acquired using a turbo-spin-echo inversion-recovery sequence, and a multiple-spin-echo sequence (Table1, validated using NIST/ISMRM MRI system phantom4). One slice was positioned to include the largest diameter of the femoral heads. Contours were drawn for the right femoral head, gluteus maximus, and the adjacent subcutaneous fat (Figure1). Four consented patients with previously treated metastatic bone disease in the pelvis (one primary breast cancer, 69 yrs; three primary prostate cancer, 68, 77, 69 yrs) were also imaged using the MRF sequence with five slices covering the pelvic lesion. Diffusion-weighted images (DWI) were also obtained in these patients (Table1), and a bone lesion was outlined on the b=900s/mm2 image on five slices matching the MRF. Lesion contours were transferred to the MRF-T1 maps and manually repositioned to account for DWI distortions. Contours were drawn on the MRF-T1 maps for the contralateral normal-appearing bone marrow region, the gluteus maximus and the adjacent subcutaneous fat (Figure2). Contours were drawn using Horos (Horosproject.org), saved as DICOM-RT structure sets using pyOsiriX5, and image statistics were obtained using MATLAB (R2018b The MathWorks, Inc.). For each volume of interest (VOI) the median value and the inter-quartile range (IQR) were computed, and these are summarised over subjects (either patients or volunteers) using the mean and range (Table2).Results
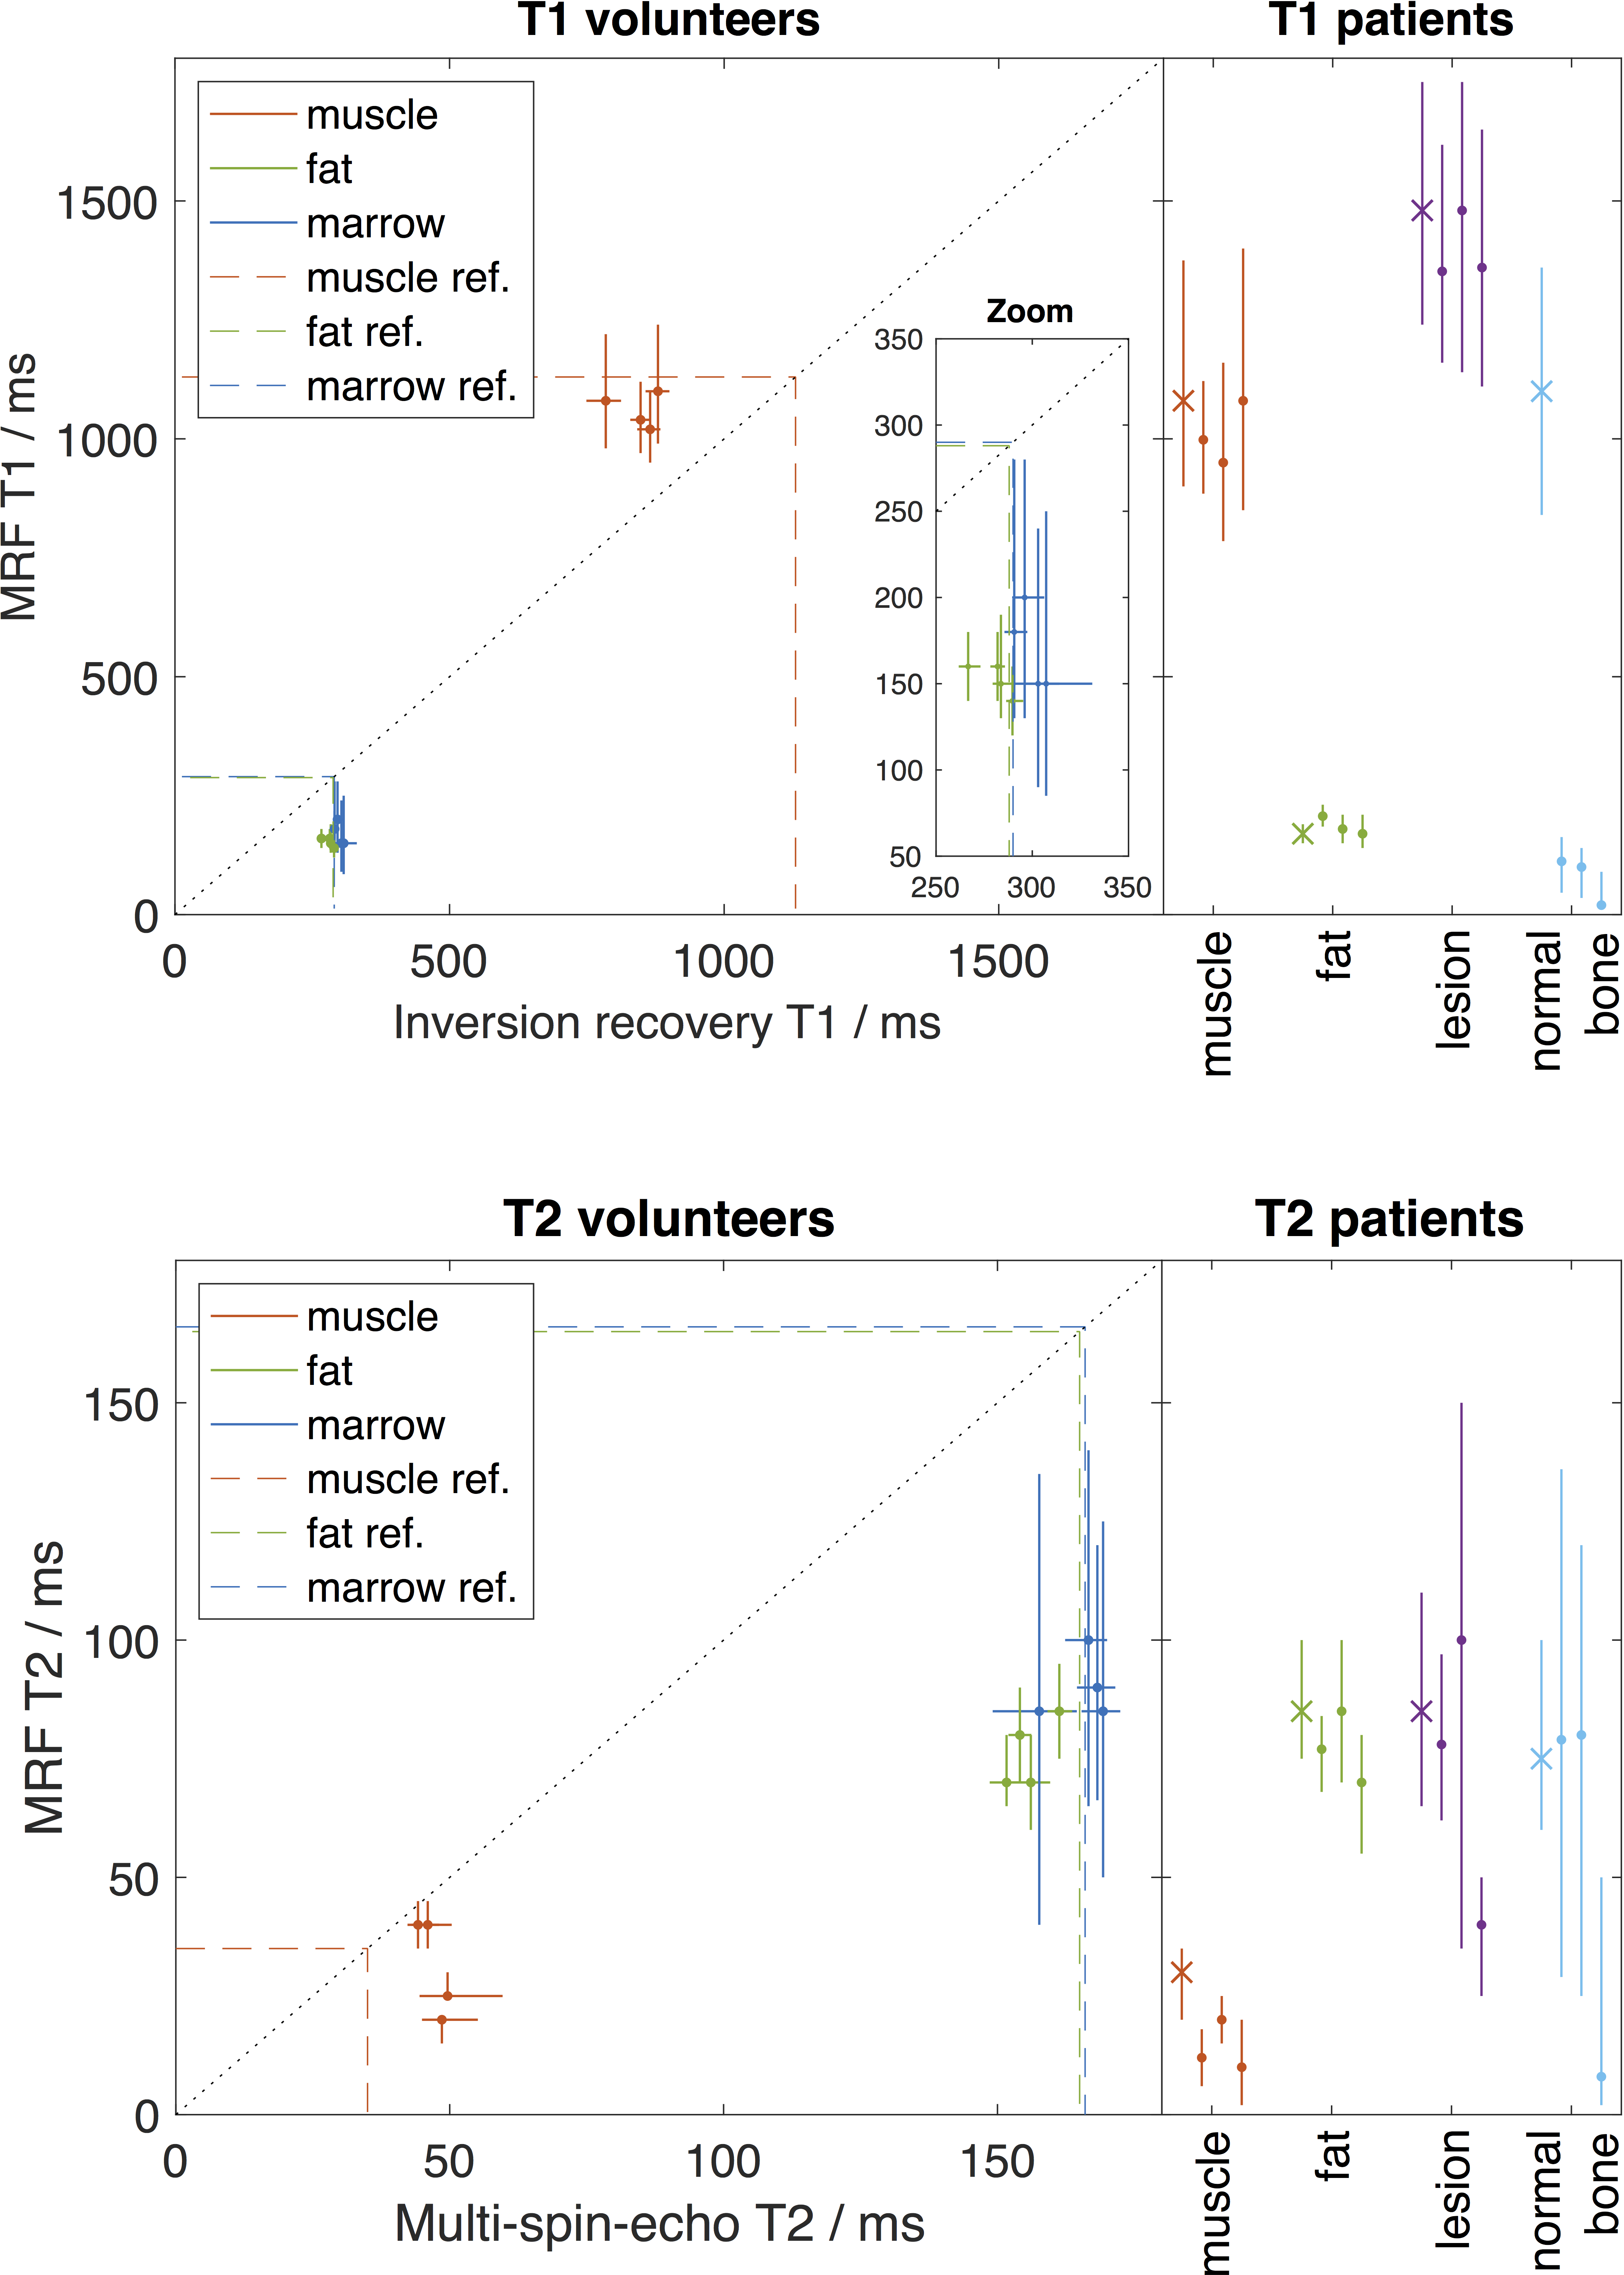
In addition to the tabular results, Figure3 presents results for all subjects, and these plots also show reference values6 of T1 and T2 for muscle, fat and marrow.
Volunteers Gold-standard T1 for fat and femoral head marrow is consistent with reference values (fat=288ms, marrow=288ms), whilst MRF underestimates both by ~45%. Conversely for muscle, the gold-standard T1 is lower than the reference value (1130ms) by ~25% and MRF is similar to the reference. Similar observations comparing MRF with gold-standard T1 in skeletal muscle and fat have been previously reported7. Inter-subject consistency (width of range of VOI medians) is similar for gold-standard and MRF-T1 in muscle and fat, but in marrow the width of the median range is around 3 times larger for MRF than gold-standard T1. Intra‑lesion voxel-wise variability (mean of VOI inter-quartile range) is about 4.5 times smaller in muscle and fat for gold-standard T1 than MRF, whilst in marrow this rises to a factor of 7. These comparisons are also evident in Figure1.
Patients MRF-T1 statistics for muscle and fat in patients are similar to those in volunteers, although the muscle mean IQR in patients is around double that in volunteers. The mean MRF-T1 in lesions is 1420ms with low inter-patient variability, and there is no distinction between breast and prostate patients. However, compared to values in femoral head marrow for normal volunteers, MRF-T1 in normal-appearing bone marrow is elevated in the female patient, and is reduced in the male patients, which is consistent with age and treatment-related differences in these tissues. Similar observations hold for T2 comparisons between volunteers and patients, although the inter-patient variability is notably high for MRF-T2 in lesions and normal-appearing bone marrow, and this does not correlate with disease type or sex.
Discussion
MRF relaxometry in muscle and fat in volunteers and patients is consistent with previous reports7, and is biased with respect to literature values. The elevated variability of MRF-T1 and T2 in marrow, compared with gold-standard, suggests that this is a challenging tissue for MRF relaxometry. The MRF acquisition utilized for this study did not include fat suppression pulses, such as the acquisition used by Chen et al. in the abdomen7, so further work in a larger patient cohort using sequences that include fat suppression or fat/water quantification are needed to determine if the intra-tissue variability observed in lesions and normal-appearing regions is affected by the fat content of these tissues.Acknowledgements
We acknowledge CRUK and EPSRC support to the Cancer Imaging Centre at ICR and RMH in association with MRC and Department of Health C1060/A10334, C1060/A16464 and NHS funding to the NIHR Biomedical Research Centre and the Clinical Research Facility in Imaging. This study represents independent research part funded by the National Institute for Health Research (NIHR) Biomedical Research Centre at the Royal Marsden NHS Foundation Trust and the Institute of Cancer Research. The views expressed are those of the author(s) and not necessarily those of the NHS, the NIHR or the Department of Health. MOL is an NIHR Emeritus Senior Investigator.References
1. Ma D, et al. Magnetic resonance fingerprinting. Nature. 2013 14;495(7440):187–192.
2. Jiang Y, et al. MR fingerprinting using fast imaging with steady state precession (FISP) with spiral readout, Magn. Reson. Med. 2015;74(6):1621-1631.
3. Lo W-C, et al. MR fingerprinting using a Gadgetron-based reconstruction, Proc. ISMRM 2018, #3525.
4. Russek SE, et al. Characterization of NIST/ISMRM MRI system phantom. Proc. ISMRM 2012, #2456.
5. Blackledge MD, et al. Rapid development of image analysis research tools: Bridging the gap between researcher and clinician with pyOsiriX. Comput. Biol. Med. 2016;69:203-12.
6. Han E, et al. In-Vivo T1 and T2 Measurements of Muskuloskeletal Tissue at 3T and 1.5T. Proc. ISMRM 2003, #450.
7. Chen Y, et al., MR fingerprinting for rapid quantitative abdominal imaging. Radiology. 2016 279(1):278-86.
Figures