1375
Clinical-Radiomics Nomograms for Preoperative Differentiation of Sacral Chordoma and Sacral Giant Cell Tumor Based on 3D Computed Tomography and Multiparametric Magnetic Resonance Imaging1Department of Radiology, Peking University People's Hospital, Beijing, China, 2Pharmaceutical Diagnostic team, GE Healthcare, Life Sciences, Beijing, China
Synopsis
The purpose of our study was to build and evaluate clinical-radiomics nomograms for the preoperative differentiation of SC and SGCT. We compared individual features and mixed features based on CT and MRI respectively. And we also added clinical data to compare these models in terms of their performance of distinguishing SC and SGCT. Our results reveal that the model based on DWI features had the highest performance among individual scans. Mixed CT features performed better than individual scan, while mixed MR features achieved a low performance. Radiomics model can perform better when combined with clinical data.
Objective
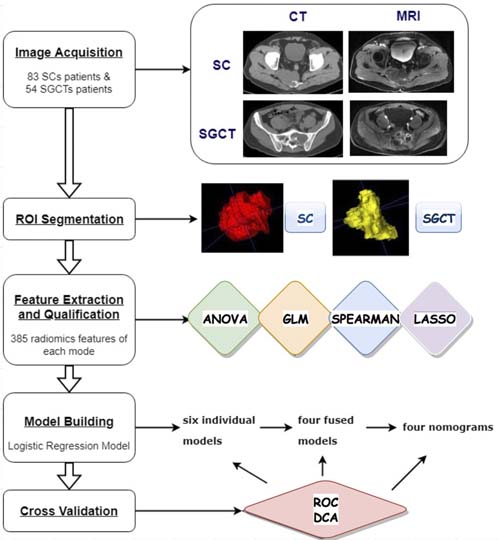
To develop and validate clinical-radiomics nomograms based on 3D computed tomography (CT) and multiparametric magnetic resonance imaging (mpMRI) for preoperative differentiation of sacral chordoma (SC) and sacral giant cell tumor (SGCT).
Materials and Methods
A total of 83 SC and 54 SGCT patients diagnosed through surgical
pathology were retrospectively analyzed. We built six models based on CT, CT
enhancement (CTE), T1-weighted, T2-weighted, diffusion weighted imaging (DWI),
and contrast-enhanced T1-weighted features, two radiomics nomograms based on
mixed CT or MRI features, and two clinical-radiomics nomograms combined
radiomics mixed features with clinical data. The area under the receiver
operating characteristic curve (AUC) and accuracy (ACC) analysis were used to
assess the performance of the models.
Results
SC and SGCT presented
significant differences in terms of age, sex, and tumor location (tage=9.00, χ2sex=10.86,
χ2location=26.20;
P<0.01). For individual scan,
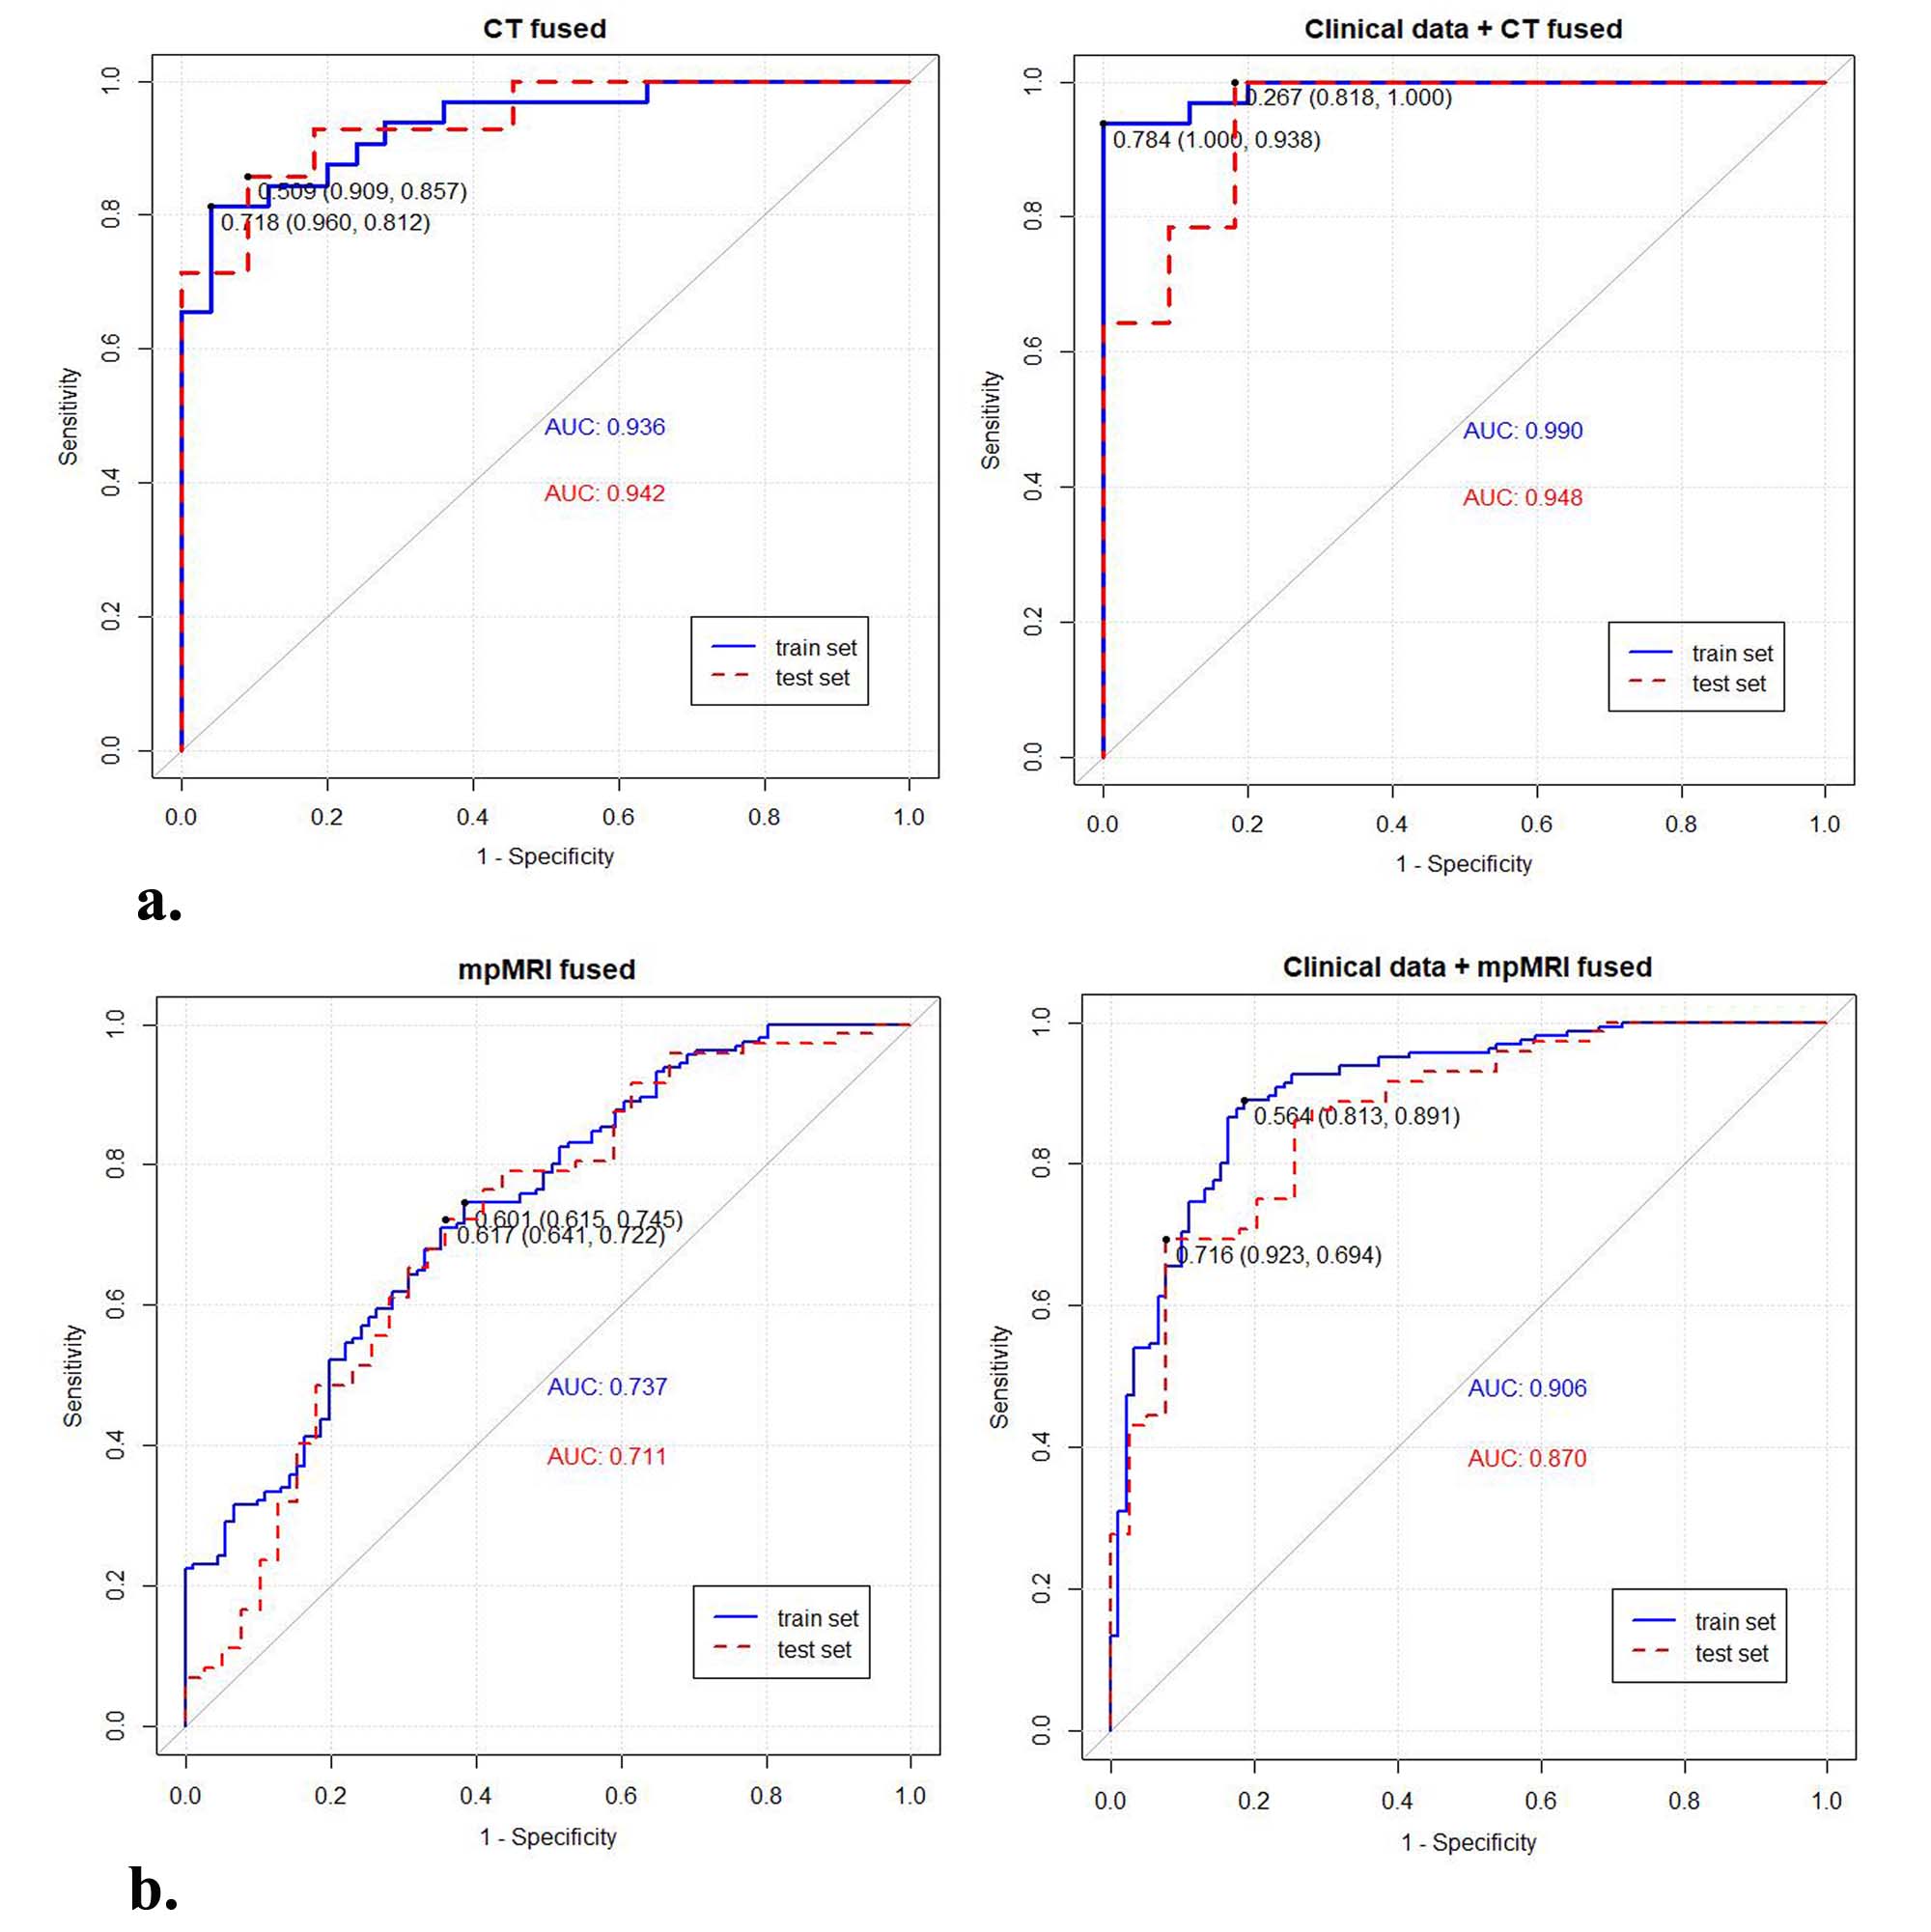
the radiomics model based on DWI features yielded the highest AUC of
0.889 and ACC of 0.885, followed by CT (AUC=0.857; ACC=0.846) and CTE
(AUC=0.833; ACC=0.769). For the combined
features, the radiomics model based on mixed CT features exhibited a better AUC of 0.942
and ACC of 0.880,
whereas mixed MRI features
achieved a lower performance than the individual scan. The clinical-radiomics
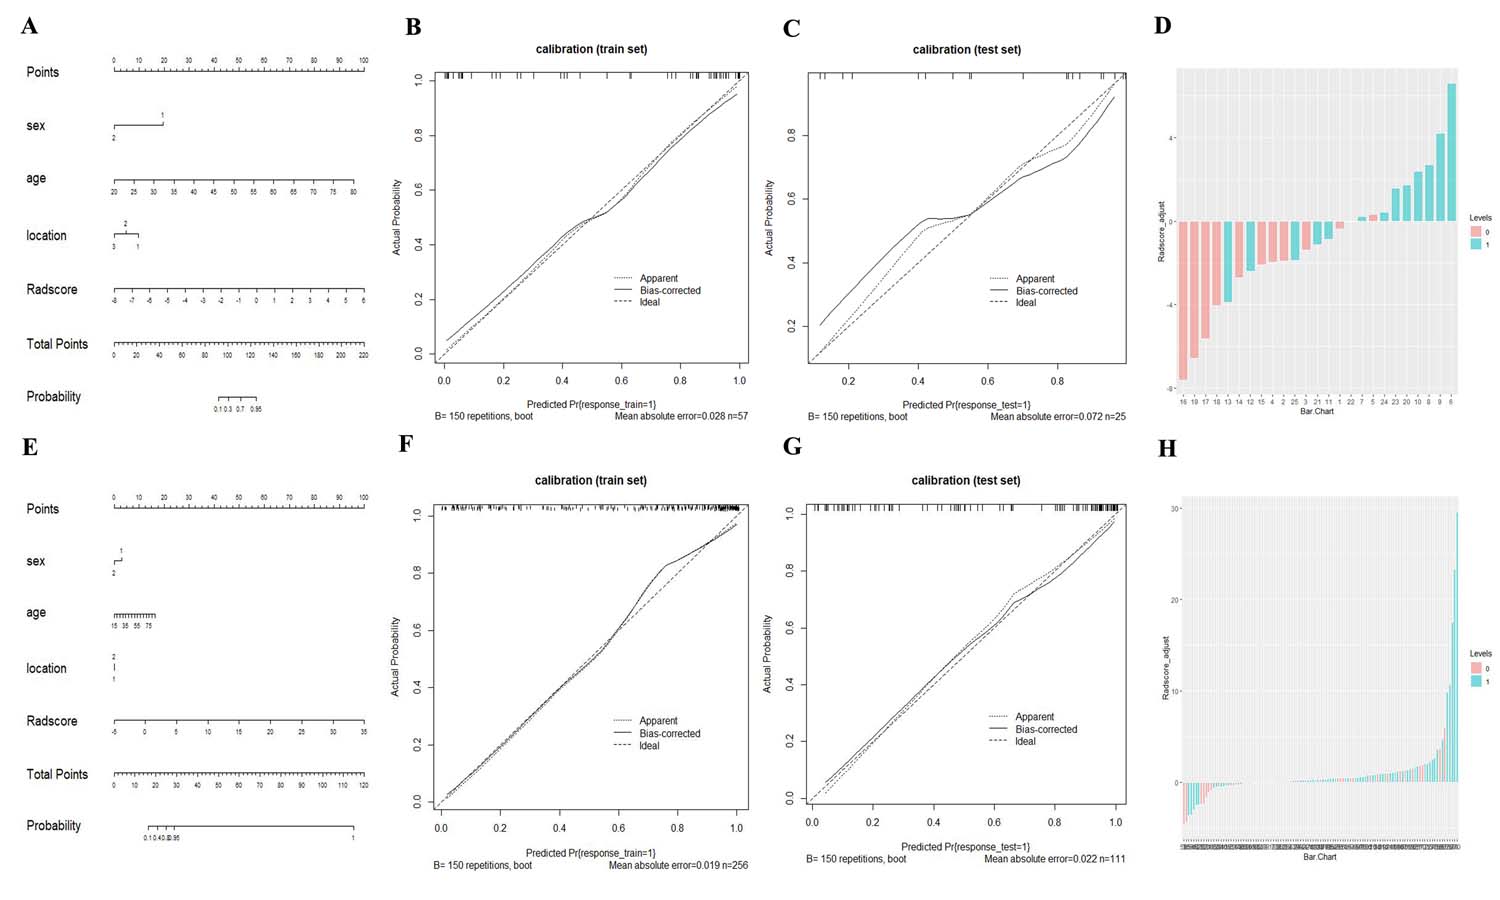
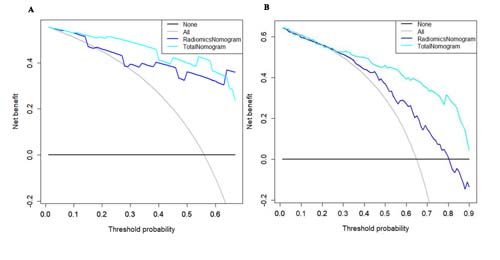
nomogram based on combined CT features achieved the highest AUC of 0.948 and
ACC of 0.920.
Conclusions
The radiomics model based on CT and mpMRI present a certain predictive value in distinguishing SC and SGCT, but combined CT features are more recommended. The performance of radiomics nomograms increases when combined with clinical data.Acknowledgements
No acknowledgement found.References
No reference found.Figures