1371
Impact of Hardware Timing Errors on Quantification of Bone Water with UTE and ZTE1Department of Radiology, University of Pennsylvania, Philadelphia, PA, United States
Synopsis
Radial MR sequences are sensitive to system timing errors, particularly for ultra-short echo time (UTE) and zero echo time (ZTE) techniques. The effects of these timing errors on image quality were systematically evaluated with both simulation and imaging experiments, and their impact on bone water quantification investigated in vivo. Error in bone water concentration in the mid-tibia was found to be up to 35.4% using UTE and 16.6% for ZTE in the presence of timing errors as small as 6 μs. Further, the severity of image artifacts were spatially dependent, with objects further from FOV center more highly distorted.
Introduction
Ultra-short echo time (UTE) and zero echo time (ZTE) MRI have recently been used to quantify bone matrix and mineral content.1-4 While it is well-known that these radial techniques are sensitive to hardware timing errors (e.g., gradient system, ADC) and various correction methods have been developed to reduce resulting image artifacts,5-7 studies evaluating the effects of these timing errors on MR quantification have been limited.8 In this work, simulation, phantom and in vivo experiments were carried out to investigate the effects of hardware timing errors on UTE and ZTE images and their mplications on bone water quantification.Methods
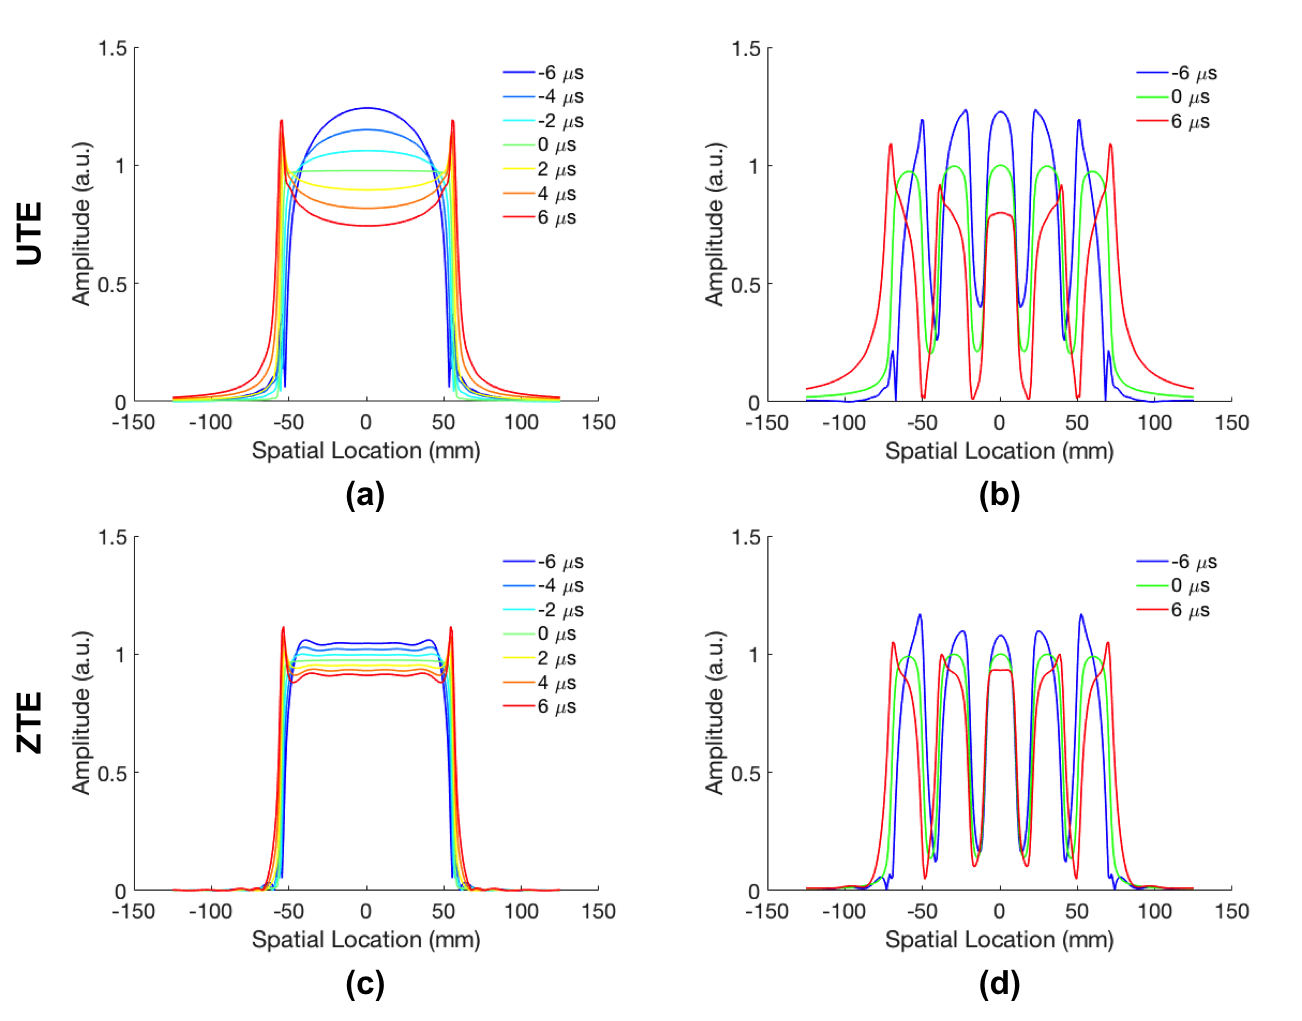
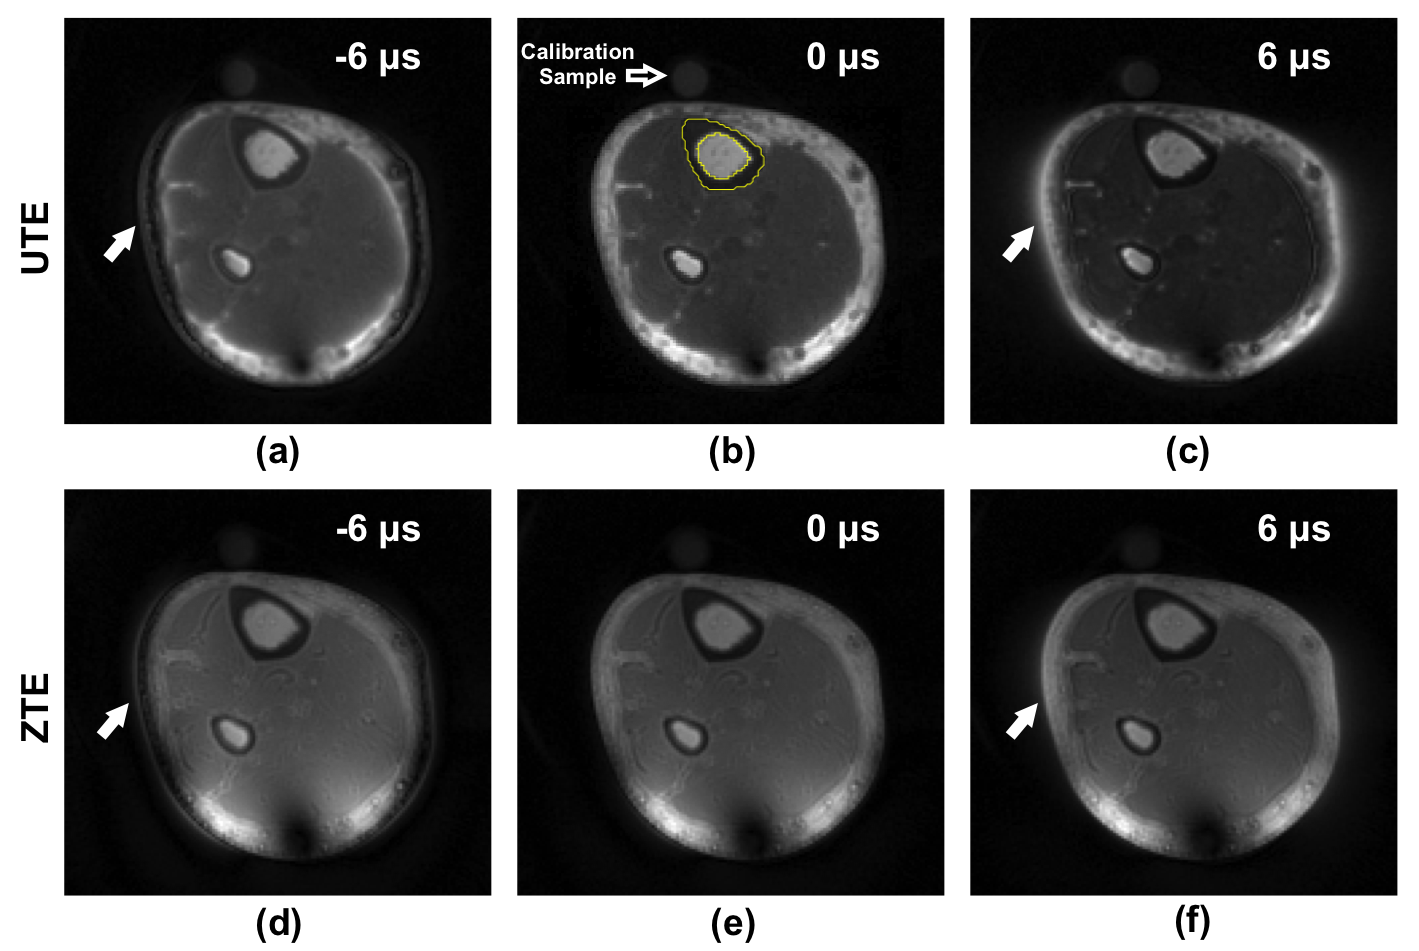
Two different phantoms were simulated to mimic the actual phantoms used for the imaging experiments: (1) a single cylindrical phantom (110 mm diameter) placed at the FOV center; (2) five smaller tubes (20 mm diameter) placed parallel in a row along the x-axis, to investigate the spatial dependence of the timing error-induced artifacts. 1D UTE and ZTE k-space data with different timing delays (-6 µs to +6 µs) were generated and their profiles reconstructed with NUFFT.9, 10 These timing delays correspond to the relative shift in the start of data acquisition (ADC) with respect to the beginning of gradient ramp up for UTE and with respect to the effective time of spin excitation for ZTE. Imaging and simulation parameters were as follows: FOV = 250 mm and number of reconstructed points = 256 for both sequences; UTE: pulse width = 80 µs, dwell time = 4 µs, ramp time = 240 µs; and ZTE: pulse width = 16 µs, dwell time = 8 µs, PETRA radius = 10. 3D UTE and ZTE imaging experiments were carried out on a Siemens 3T Trio system (Siemens Medical Solutions, Erlangen, Germany) and reconstructed as described in.11 The cylindrical phantom was imaged with a birdcage calf coil (Rapid Biomedical, Rimpar, Germany) used in an ongoing translational patient study, whereas the five smaller tubes were imaged with a wider, product 12-channel Siemens head coil to assess spatial dependence. After empirically correcting for existing timing delays along all three axes, the series of timing delays applied in the simulations were artificially introduced along the x-axis of the acquired phantom data for comparison. The mid-tibia of a 35 year-old healthy subject was scanned with the calf coil in the presence of a calibration sample of known T1, T2* and density to quantify bone water.4 In vivo data was processed in the same way as the phantom scan, and total bone water was quantified as described in4 on images reconstructed both with and without the applied timing errors.Results
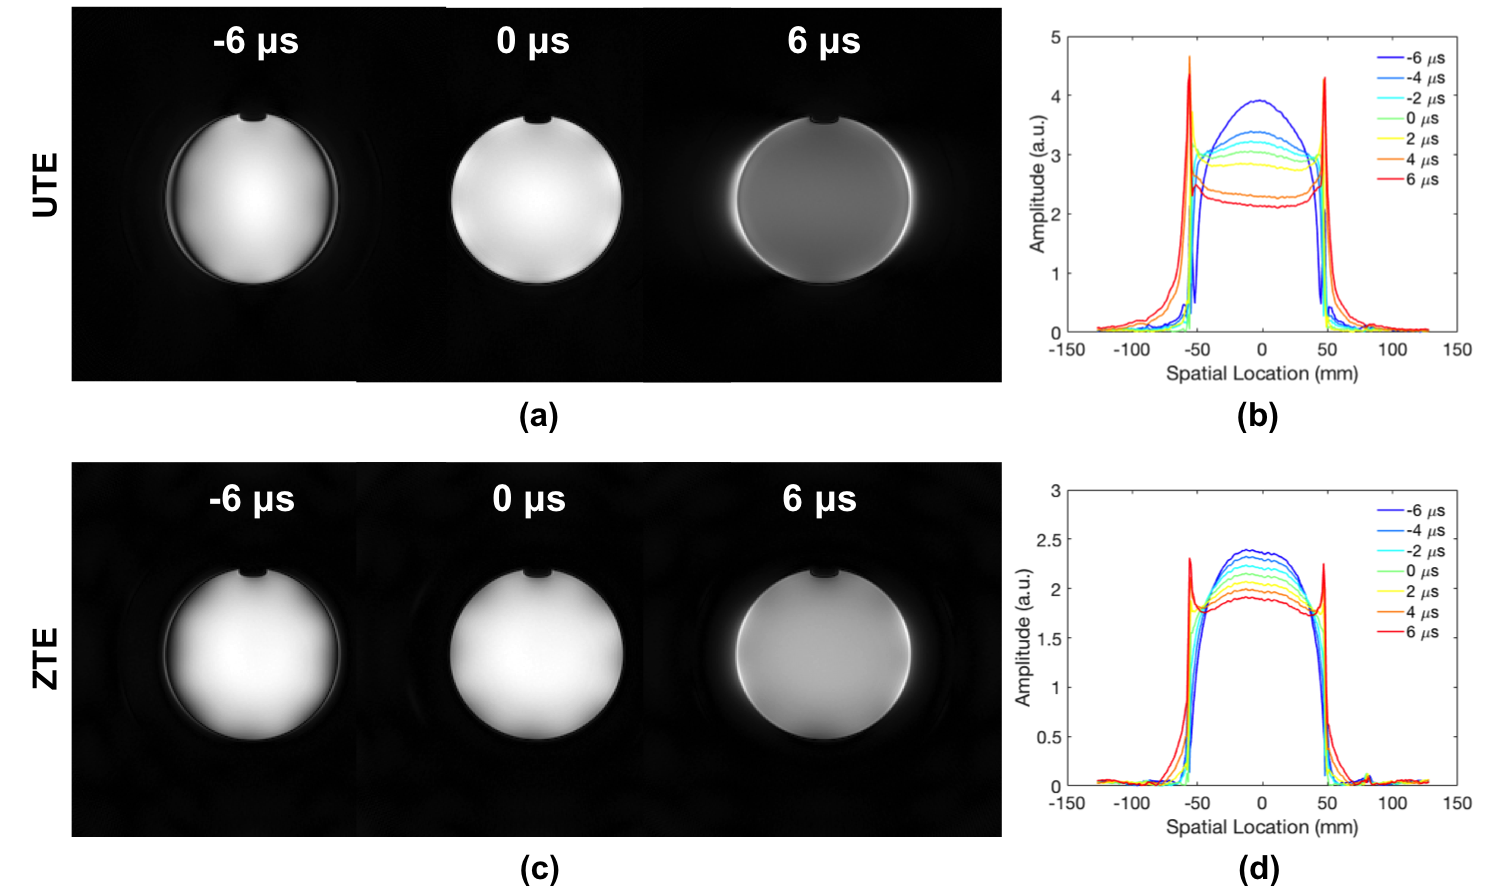
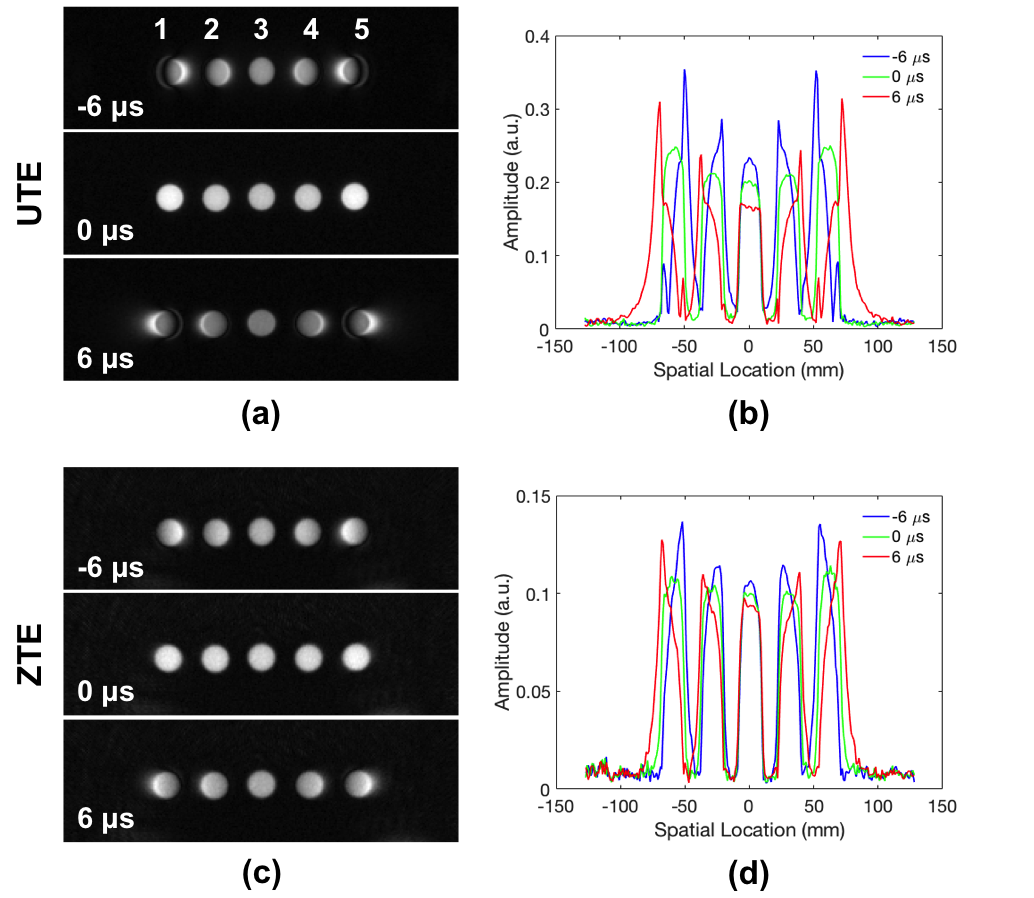
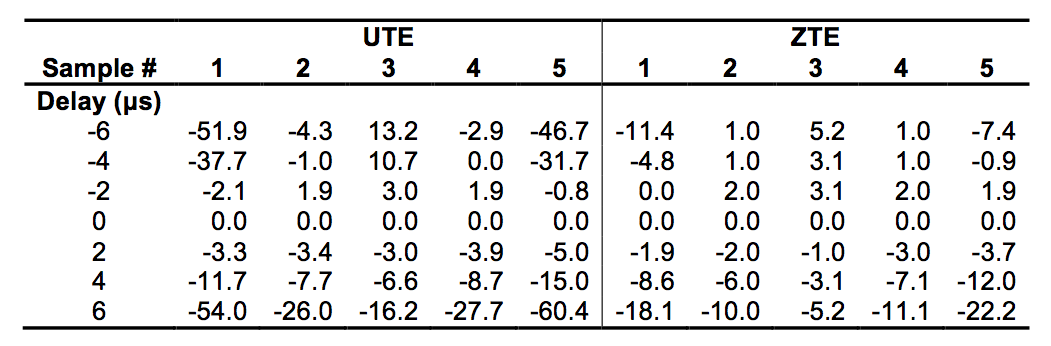
The simulation results in Fig. 1 demonstrate progressively increasing levels of image distortion with increasing timing errors. Results from the five smaller samples (Fig. 1b and d) show that these distortions are highly spatially dependent—the farther an object is away from the FOV center, more severe the distortions. Corresponding results from physical phantoms are shown in Figs. 2 and 3, showing artifacts closely matching those in the simulations. Compared to the average signal from an ROI placed at the center of the single large phantom without the timing errors, the average values measured from those with delays ranged from +24.8% (-6 µs delay) to -28.1% (+6 µs delay) for UTE, and between +11.2% and -10.9% for ZTE. The signal variations for the five smaller tubes are summarized in Table 1. In vivo results of the distal tibia with similarly applied timing delays are shown in Fig. 4. Compared to bone water concentration obtained without any timing delays, measured with -6 µs and +6 µs delays were off by +35.4% and -12.7% for UTE and +16.6% and -8.0% for ZTE, respectively.Discussion and Conclusions
This study demonstrates that even small pulse sequence timing errors in UTE and ZTE can cause substantial levels of image artifacts and errors in quantitative measurements. The pertinent factor is the amount of the timing error relative to the acquisition dwell time, and for our study, a 6 µs shift, which typically exists on clinical scanners,7 corresponds to 1.5 dwell times for UTE and 0.75 dwell time for ZTE. The observed quantification errors are much larger than the coefficients of variation for bone water reported in an earlier study (~3.5%).4 The spatial dependence of these artifacts, as best illustrated in Fig. 3 and Table 1, further emphasizes the critical importance of correcting for any timing errors for quantitative studies in order to minimize measurement variability.Acknowledgements
NIH R01-AR50068References
1. Manhard MK, Horch RA, Gochberg DF, Nyman JS, Does MD. In Vivo Quantitative MR Imaging of Bound and Pore Water in Cortical Bone. Radiology. 2015;277(1):221-9. doi: 10.1148/radiol.2015140336.
2. Seifert AC, Li C, Rajapakse CS, Bashoor-Zadeh M, Bhagat YA, Wright AC, et al. Bone mineral 31P and matrix-bound water densities measured by solid-state 31P and 1H MRI. NMR in Biomedicine. 2014;27(7):739-48. doi: 10.1002/nbm.3107.
3. Wu Y, Reese TG, Cao H, Hrovat MI, Toddes SP, Lemdiasov RA, et al. Bone mineral imaged in vivo by (31) P solid state MRI of human wrists. J Magn Reson Imaging. 2011;34(3):623-33. Epub 2011/07/16. doi: 10.1002/jmri.22637. PubMed PMID: 21761459; PubMed Central PMCID: PMC3197865.
4. Zhao X, Song HK, Seifert AC, Li C, Wehrli FW. Feasibility of assessing bone matrix and mineral properties in vivo by combined solid-state 1H and 31P MRI. PLoS One. 2017;12(3):e0173995. doi: 10.1371/journal.pone.0173995. PubMed PMID: 28296979; PubMed Central PMCID: PMCPMC5352014. 5. Atkinson IC, Lu A, Thulborn KR. Characterization and correction of system delays and eddy currents for MR imaging with ultrashort echo-time and time-varying gradients. Magn Reson Med. 2009;62(2):532-7. doi: 10.1002/mrm.22016. PubMed PMID: 19353662.
6. Latta P, Starcuk Z, Jr., Gruwel ML, Weber MH, Tomanek B. K-space trajectory mapping and its application for ultrashort Echo time imaging. Magn Reson Imaging. 2017;36:68-76. doi: 10.1016/j.mri.2016.10.012. PubMed PMID: 27742433.
7. Peters DC, Derbyshire JA, McVeigh ER. Centering the projection reconstruction trajectory: reducing gradient delay errors. Magn Reson Med. 2003;50(1):1-6. doi: 10.1002/mrm.10501. PubMed PMID: 12815671; PubMed Central PMCID: PMCPMC2034322.
8. Latta P, Starcuk Z, Jr., Gruwel MLH, Lattova B, Lattova P, Stourac P, et al. Influence of k-space trajectory corrections on proton density mapping with ultrashort echo time imaging: Application for imaging of short T2 components in white matter. Magn Reson Imaging. 2018;51:87-95. doi: 10.1016/j.mri.2018.04.020. PubMed PMID: 29729437.
9. Greengard L, Lee JY. Accelerating the nonuniform fast Fourier transform. Siam Rev. 2004;46(3):443-54. doi: 10.1137/S003614450343200x. PubMed PMID: WOS:000223448700003.
10. Lee JY, Greengard L. The type 3 nonuniform FFT and its applications. J Comput Phys. 2005;206(1):1-5. doi: 10.1016/j.jcp.2004.12.004. PubMed PMID: WOS:000229101600001.
11. Zwart NR, Johnson KO, Pipe JG. Efficient sample density estimation by combining gridding and an optimized kernel. Magn Reson Med. 2012;67(3):701-10. doi: 10.1002/mrm.23041. PubMed PMID: 21688320.
Figures