1370
Bone Fraction Mapping with SyNthetic Auto-interpolated in-Phase (SNAP) MRI1UCL Centre for Medical Imaging, University College London, London, United Kingdom, 2Department of Medical Physics, University College London Hospitals, London, United Kingdom
Synopsis
Quantification of bone mineral density (BMD) and/or bone fraction (BF) has long been a goal of MRI research, but thus far no method has successfully translated into clinical practice. Methods including R2* mapping, susceptibility mapping and ultrashort echo time MRI have shown promise but remain difficult to implement. A simpler approach to BMD/BF quantification is to measure the signal loss occurring in bone-containing voxels compared to the signal occurring in a bone-free voxel. We propose a method called SyNthetic Auto-interpolated in-Phase (SNAP) imaging which uses this principle and accounts for spatial variations in B1/coil sensitivity, enabling practical estimation of BMD/BF.
Introduction
MRI-based quantification of bone mineral density (BMD) and/or bone fraction (BF) has potential clinical utility in diseases of bone marrow. Whilst a number of methods have shown promise, each has inherent pitfalls: R2* measurements correlate with BMD but are confounded by variations in fat fraction (FF)1; quantitative susceptibility mapping (QSM)2 is sensitive to both phase errors and variations in FF3; UTE/ZTE acquisitions4 remain difficult to implement and are not widely available.
Ho et al. proposed an alternative approach to BMD/BF quantification, whereby the reduction in signal due to bone occupying space within a voxel is normalised to an estimated ‘maximum’ signal that would occur in a voxel without any zero-signal minerals5. For application to the knee, Ho et al. assumed a fixed maximum (i.e. the highest signal intensity in the image). However, this is inaccurate if there is inhomogeneity in the B1 field or receive coil, for example at high field or in the abdomen.
Here, we propose a method called SyNthetic Auto-interpolated in-Phase (SNAP) imaging, in which a hypothetical background maximum signal estimate is derived from pixels in a local neighbourhood, rather than from the entire image. We demonstrate this approach in phantoms and in the sacrum of a volunteer.
Theory
The fat and water signals from a voxel are decomposed using a fat-water separation algorithm such as IDEAL6. T1-bias is minimised by using a low flip angle; T2* relaxation and the spectral complexity of fat are accounted for through incorporation into the signal model7. A ‘synthetic’ in-phase (sIP) image is generated by summing the resulting fat and water images. It is assumed that bone consists of only fat, water and zero-signal mineral. If the signal occurring in a voxel with no mineral (SBMD=0) is known, BMD/BF can be estimated based on the reduction of signal in each voxel against this baseline. Our proposed approach to determining a spatially varying SBMD=0 baseline is as follows (see also Figure 1).
It is assumed that voxels consisting of (almost) pure fat (FF>90%) or pure water (FF<10%) are not within bone and do not contain mineral (in the pelvis, voxels meeting these criteria predominantly correspond to adipose tissue and muscle respectively). These voxels are used as ‘seed voxels’ to derive a spatially varying estimate of SBMD=0. The missing parts of the image are interpolated to give an estimate of SBMD=0 for the entire image. The BF in each voxel is then calculated using:
$$BF=\frac{S_{BMD=0}-S_{sIP}}{S_{BMD=0}}$$
where SsIP is the signal in the sIP image.
BF can, in turn, be used to calculate BMD using $$$BMD=BF\cdot ρ_{mineral}$$$.
Methods
We conducted a series of phantom experiments on a Philips Ingenia 3T system to validate this method:
1. Hydroxyapatite was added to tubes containing 3% agar (with BMD values varying from 0-0.5g/cm3), which were set in a matching agar surround (Figure 2b). The phantom was scanned using mDixon Quant (a vendor-supplied proton density fat-fraction package1 - acquisition parameters in Figure 2a). The tubes containing mineral were excluded from the seed voxel image. The sIP image was calculated as in Figure 1; interpolation was performed using a smoothing spline line-by-line across the image (implemented using the MATLAB ‘smoothingspline’ function; Figure 3a).
2. A second phantom with tubes containing a fat-agar mixture (FF=50%), with identical BMD values to the first phantom, was scanned with the same acquisition parameters and post-processing.
For both phantoms, measured BMD/BF was compared with reference BMD/BF using linear regression.
To provide proof-of-principle in vivo, we generated BMD images from the sacrum of a single subject (Figure 5).
Results and discussion
Interpolation results for the two phantoms are shown in Figure 3 (a-d and e-h for experiments 1 and 2 respectively). In both phantoms, a smooth fitted surface (c,g) was produced from the masked images (b,f), enabling measurement of the signal reduction due to hydroxyapatite in each of the tubes; an example line profile is shown (d,h).
Results of the regression analysis between reference and measured BF/BMD are shown in Figures 4c and 4d. There was a significant linear relationship between measured BMD/BF and reference BMD/BF for both phantoms. The proposed method was sensitive to changes in BMD over the range expected in human bone marrow, suggesting potential clinical utility for disorders causing both new bone formation (increased BMD) and bone destruction (reduced BMD), such as spondyloarthritis3 and multiple myeloma.
Conclusions
We propose a method for BF/BMD mapping called SyNthetic Auto-interpolated in-Phase (SNAP) imaging, which separates signal loss occurring due to mineral from scanner-related variations across the image. This method is shown to be viable in hydroxyapatite-agar phantoms and a volunteer dataset.Acknowledgements
NS, ST and MHC receive funding from the UCL/UCLH BRC. NS is supported by the Radiological Research Trust (RRT) for this work. TJPB is supported by Arthritis Research UK Grant 21369. This work was undertaken at UCLH/UCL, which receives funding from the UK Department of Health’s the National Institute for Health Research (NIHR) Biomedical Research Centre (BRC) funding scheme. The views expressed in this publication are those of the authors and not necessarily those of the UK Department of Health.References
1. Bray TJP, Bainbridge A, Punwani S, Ioannou Y, Hall-Craggs MA. Simultaneous Quantification of Bone Edema/Adiposity and Structure in Inflamed Bone Using Chemical Shift-Encoded MRI in Spondyloarthritis. Magn Reson Med [Internet]. 2018 [cited 2018 May 17];79:1031–42.
2. Dimov A V., Liu Z, Spincemaille P, Prince MR, Du J, Wang Y. Bone quantitative susceptibility mapping using a chemical species–specific R2* signal model with ultrashort and conventional echo data. Magn Reson Med. 2018;79:121–8.
3. Karsa, A, Bray, TJP, Bainbridge, A, Punwani, S, Hall-Craggs, MA, Shmueli K. Bone Marrow Susceptibility as a Marker of Bone Mineral Density in Spondyloarthritis. In: Intl Soc Mag Reson Med. 2018. p. 4989.
4. Du J, Bydder GM. Qualitative and quantitative ultrashort-TE MRI of cortical bone. NMR Biomed [Internet]. 2013 [cited 2018 May 17];26:489–506.
5. Ho K-Y, Hu HH, Keyak JH, Colletti PM, Powers CM. Measuring bone mineral density with fat-water MRI: comparison with computed tomography. J Magn Reson Imaging [Internet]. 2013 [cited 2018 May 11];37:237–42.
6. Reeder SB, Wen Z, Yu H, Pineda AR, Gold GE, Markl M, et al. Multicoil Dixon Chemical Species Separation with an Iterative Least-Squares Estimation Method. Magn Reson Med. 2004;51:35–45.
7. Hines CDG, Yu H, Shimakawa A, McKenzie CA, Brittain JH, Reeder SB. T1 independent, T2* corrected MRI with accurate spectral modeling for quantification of fat: Validation in a fat-water-SPIO phantom. J Magn Reson Imaging. 2009;30:1215–22.
Figures
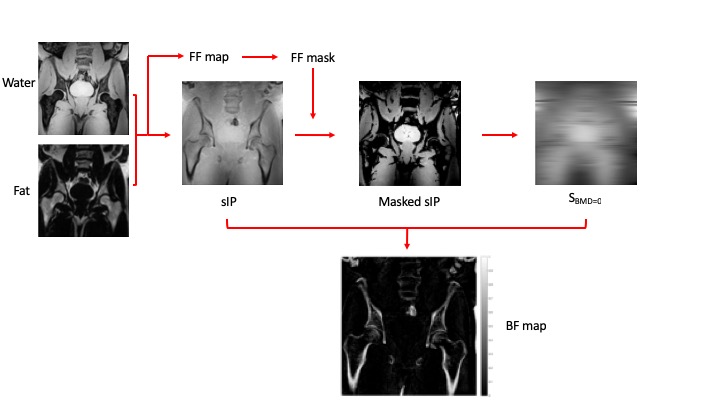
Proposed processing pipeline.
Fat-only and water-only images are combined to produce a “synthetic” in-phase (sIP) image. Pixels containing mineral were excluded from the image automatically using thresholds for water and fat fraction to give a “masked sIP”. Interpolation was performed using a smoothing spline line by line across the image to create the SBMD=0 image which was used to generate the BF map.
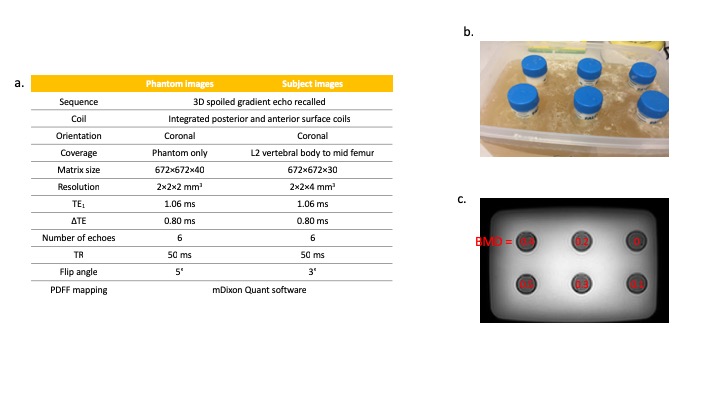
a. MRI acquisition parameters
b. Photograph of water-CHA phantom surrounded with agar
c. Water-only image with reference BMD values (g/cm3)
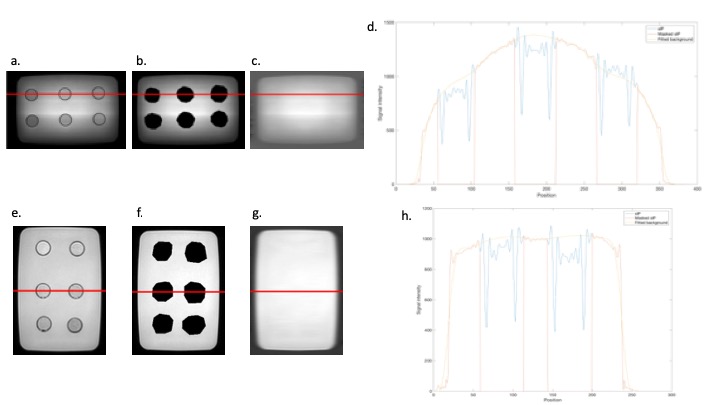
Interpolation of the phantom “masked sIP” images.
a. Position of a single line profile through the sIP, masked sIP and SBMD=0 images in the water-CHA phantom
b. Single line profile generated from 3.a. demonstrating the smoothing spline (fitted background; yellow line)
c. Position of a single line profile through the sIP, masked sIP and SBMD=0 images in the fat-water-CHA phantom
d. Single line profile generated from 3.c. demonstrating the smoothing spline (fitted background; yellow line)
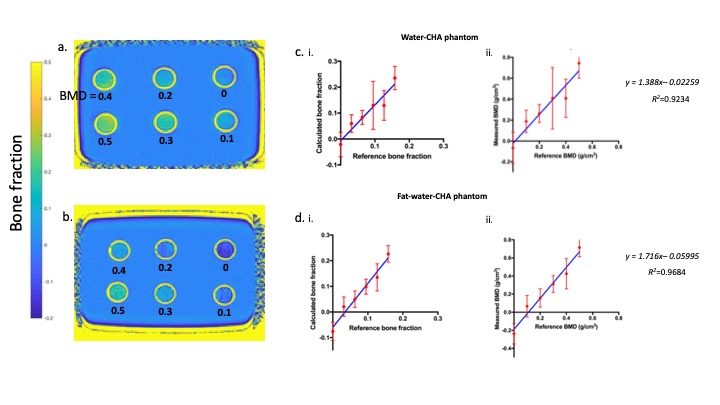
Results of the phantom experiments.
a. Bone fraction map generated from the water-CHA phantom
b. Bone fraction map generated from the fat-water-CHA phantom
c. Plots of i) calculated bone fraction vs. reference bone fraction and ii) calculated BMD vs. reference BMD in the water-CHA phantom and results of linear regression
d. Plots of i) calculated bone fraction vs. reference bone fraction and ii) calculated BMD vs. reference BMD in the fat-water-CHA phantom and results of linear regression
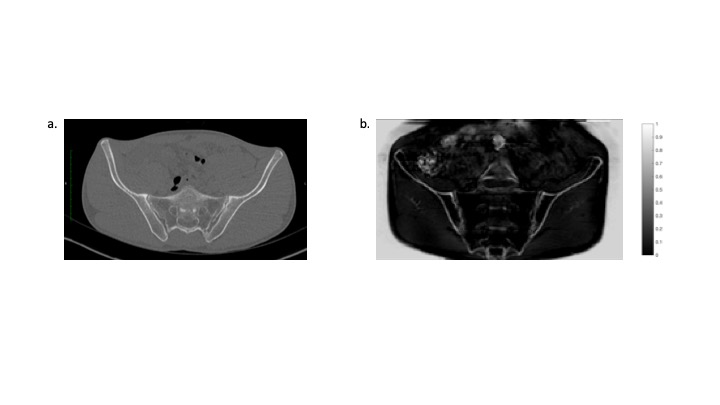
Example images of the sacroiliac joints in a volunteer.
a. Computed tomography (CT)
b. Bone fraction map generated using SNAP post-processing