1369
T2* quantification of the cranial bone using ultra-short echo-time (UTE) imagingBenedikt Herzau1, Martin Krämer1, and Jürgen R Reichenbach1,2,3,4
1Medical Physics Group, Institute of Diagnostic and Interventional Radiology, Jena University Hospital - Friedrich Schiller University Jena, Jena, Germany, 2Michael Stifel Center for Data-driven and Simulation Science Jena, Friedrich Schiller University Jena, Jena, Germany, 3Abbe School of Photonics, Friedrich Schiller University Jena, Jena, Germany, 4Center of Medical Optics and Photonics, Friedrich Schiller University Jena, Jena, Germany
Synopsis
Quantification of T2* of the human cranial bone was performed by using high resolution multi-echo ultra-short echo time (UTE) imaging. Due to the extracted different short T2* values across the skull, it became possible to identify and differentiate the three-layer structure of the cranial bone consisting of the two compact bone layers lamina externa and lamina interna as well as the spongy interlayer diploe. Significant differences between the spongy interlayer and the two compact layers were obtained as regards their respective T2* relaxation times.
Introduction
MR imaging of the human skull requires signal acquisition with ultra-short echo times (UTE)1, as the very rapidly decaying tissue signal of the compact bone cannot be captured directly by conventional MRI techniques2. Typically, computed tomography (CT) is used for imaging of the cranial bone. However, for pediatric imaging, radiation reduction in cases of repeated scans, or in combination with other diagnostic MR contrasts, direct imaging of the cranial bone and its internal structure by means of UTE MRI could be a valuable alternative. This works explores the possibilities of using UTE MRI for high resolution imaging of the cranial bone. It aims to quantify T2* of the human skull and investigates whether the three specific layers of the cranial bone can be distinguished by their T2* relaxation times.Methods
A non-selective 3D UTE sequence with radial center-out acquisition technique1 was used for data sampling at ultra-short echo times immediately after hard-pulse excitation. Multi-echo readouts were acquired to sample three, in-phase signal echoes at echo times TE of 0.12 ms, 2.48 ms and 4.84 ms. Further parameter settings were: 256 x 256 x 213 acquisition matrix, (200 x 200 x 167) mm³ field of view, 930 Hz/px bandwidth, 35° flip angle, 7.5 ms TR, 57 min TA, two averages, 181136 radial readouts per k-space and fat saturation. Three volunteers without known pathologies participated in this study, which was performed on a 3T Siemens Magnetom PRISMA scanner using a vendor supplied 20-channel head coil. Image reconstruction and data analysis were done offline using MATLAB.After squaring the input data to minimize the noise level3, the T2* relaxation time constant was estimated voxel-wise by applying a squared mono-exponential fit to the multi-echo data. Magnitude images of the second echo were used to draw manually regions-of-interest (ROI) into the three different layers of the human cranial bone (Figure 1). These ROIs were then copied to the T2* maps to determine the different T2* relaxation times of the two compact laminae and the spongy diploe. The cranial bone was also manually segmented in several slices of the 3D T2* map to investigate the frequency distribution of T2* values (Figure 2a). The distribution of T2* across the three specific bone layers was analyzed by using profile lines through the cranial bone (Figure 2b).Results
The estimated T2* values of the cranial bone layers lamina externa, diploe and lamina interna are summarized in Figure 3 for all subjects. The average T2* relaxation time of the diploe is 2.44 ms ± 0.16 ms, which is significantly longer than the average T2* values of the two compact bone layers. This is due to the different tissue structure of the compact and spongy bone layers, as the diploe contains small compact trabecular bones and red bone marrow. As there are no structural differences between the lamina externa and the lamina interna, their T2* relaxation times are almost identical (1.65 ms ± 0.12 ms vs. 1.69 ms ± 0.08 ms).The histogram (Figure 4a) reveals a skewed frequency distribution with a maximum of T2*at 1.7 ms, which corresponds to the estimated averaged relaxation times of the compact laminae. A smooth crossover between the bone layers is visible from the profile lines (Figure 4b). While T2* does not change significantly across the compact layers, it increases towards the center of the spongy diploe.Discussion and Conclusion
Ultra-short echo time MRI enables T2* quantification of rapidly relaxing tissues, such as the cranial bone, for which the structure-related differences between the compact laminae and the spongy diploe become apparent in the T2* values. However, the results of this work are subject to various limitations. For example, only in-phase echoes were acquired due to the long acquisition time of the 3D radial center-out UTE sequence, which made application of echo train shifting unpractical. Using 2D slice-selective spiral4 or 2D UTE radial sampling techniques5 might provide greater accuracy in T2* quantification, as intermediate echoes can be additionally acquired. Nevertheless, our results demonstrate that the layers of the cranial bone can be distinguished and characterized by their T2* relaxation times. Estimating T2* of the cranial bone also provides a potential information source for segmenting the cranial bone from its surrounding tissues, which in turn is interesting for PET-MRI attenuation correction6.Acknowledgements
Martin Krämer was supported by the German Research Foundation (DFG, RE 1123/22-1)References
- Herrmann KH, Krämer M, Reichenbach JR. Time Efficient 3D Radial UTE Sampling with Fully Automatic Delay Compensation on a Clinical 3T MR Scanner. PLoS One. 2016;Mar14;11(3):e01503712.
- Robson MD, Gatehouse PD, Bydder M, Bydder GM. Magnetic resonance: An introduction to ultrashort TE (UTE) imaging. 2003. Journal of Computer Assisted Tomography. 27(6):825–846.
- Schweser F, Krumbein I, Herrmann KH, Mentzel HJ, Reichenbach JR. Which one is most accurate and has highest precision? - A comprehensive analysis of T2* estimation techniques. 2014. In Proceedings of the International Society for Magnetic Resonance in Medicine, vol. 22, 3133
- Du J, Bydder M, Takahashi AM, Chung CB. Two-dimensional ultrashort echo time imaging using a spiral trajectory. 2008. Magnetic Resonance Imaging. 26(3):304–312.
- Gatehouse P and Bydder G. Magnetic resonance imaging of short T2 components in tissue. 2003. Clinical Radiology. 58(1):1–19.
- Keereman V, Fierens Y, Broux T, Deene YD, Lonneux M Vandenberghe S. MRI-based attenuation correction for PET/MRI using ultrashort echo time sequences. 2010. Journal of Nuclear Medicine, 51(5):812–818.
Figures
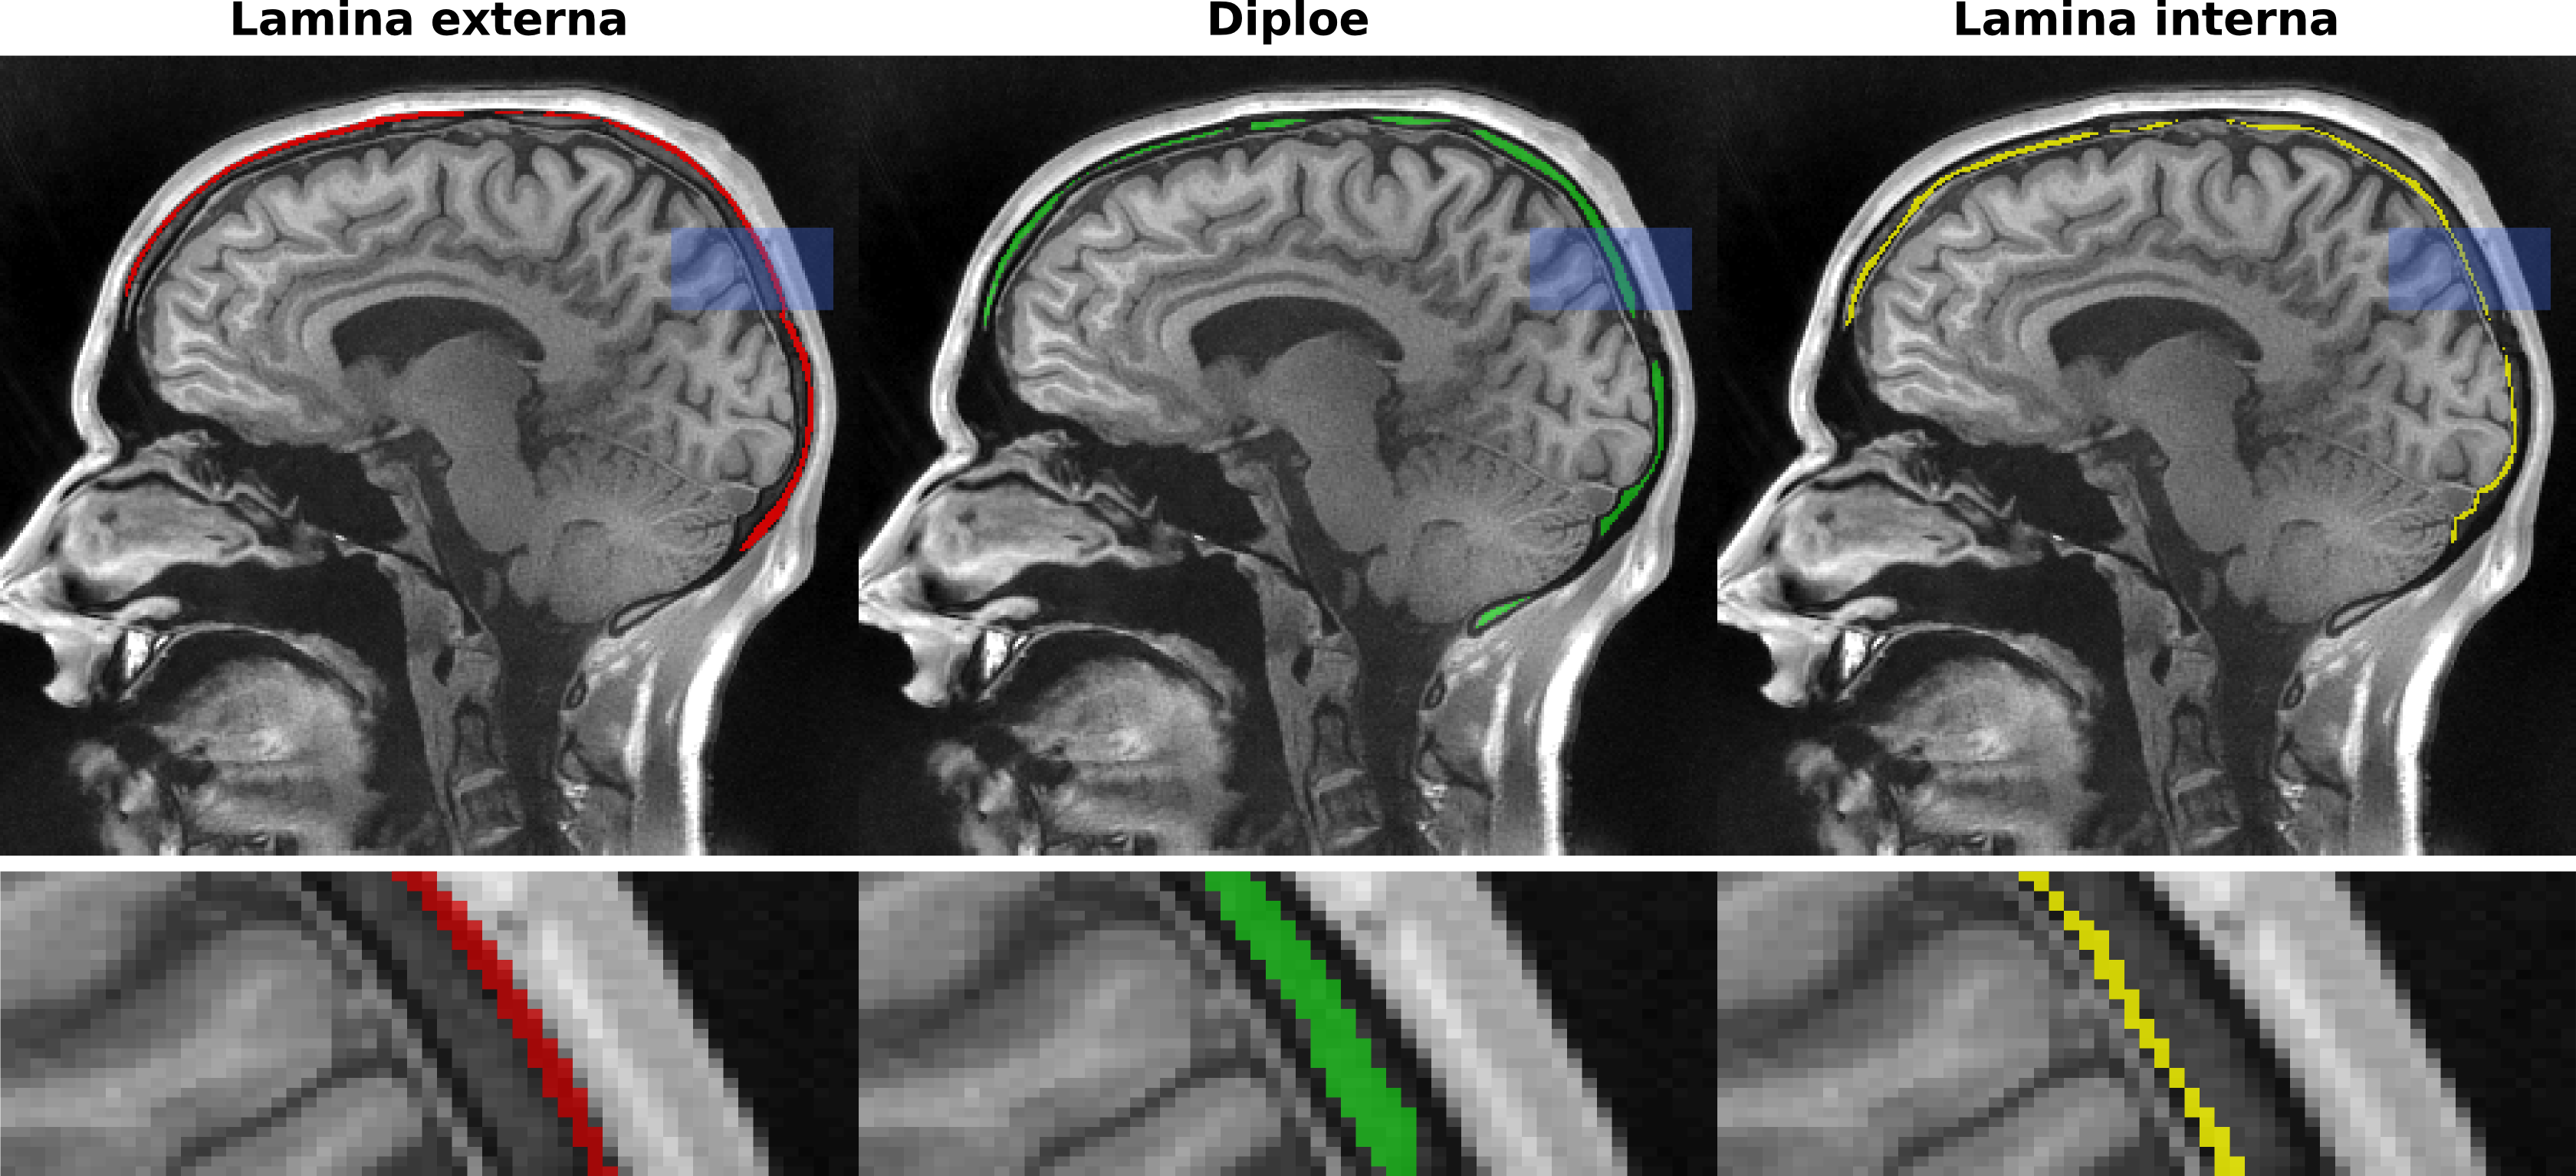
Figure 1: Top row: Magnitude images of the second echo at 2.48 ms. Bottom row: Enlarged sections (indicated by blue boxes in top row), showing in detail parts of the manually drawn regions-of-interest in the three layers of the cranial bone. Left to right: lamina externa, diploe and lamina interna.
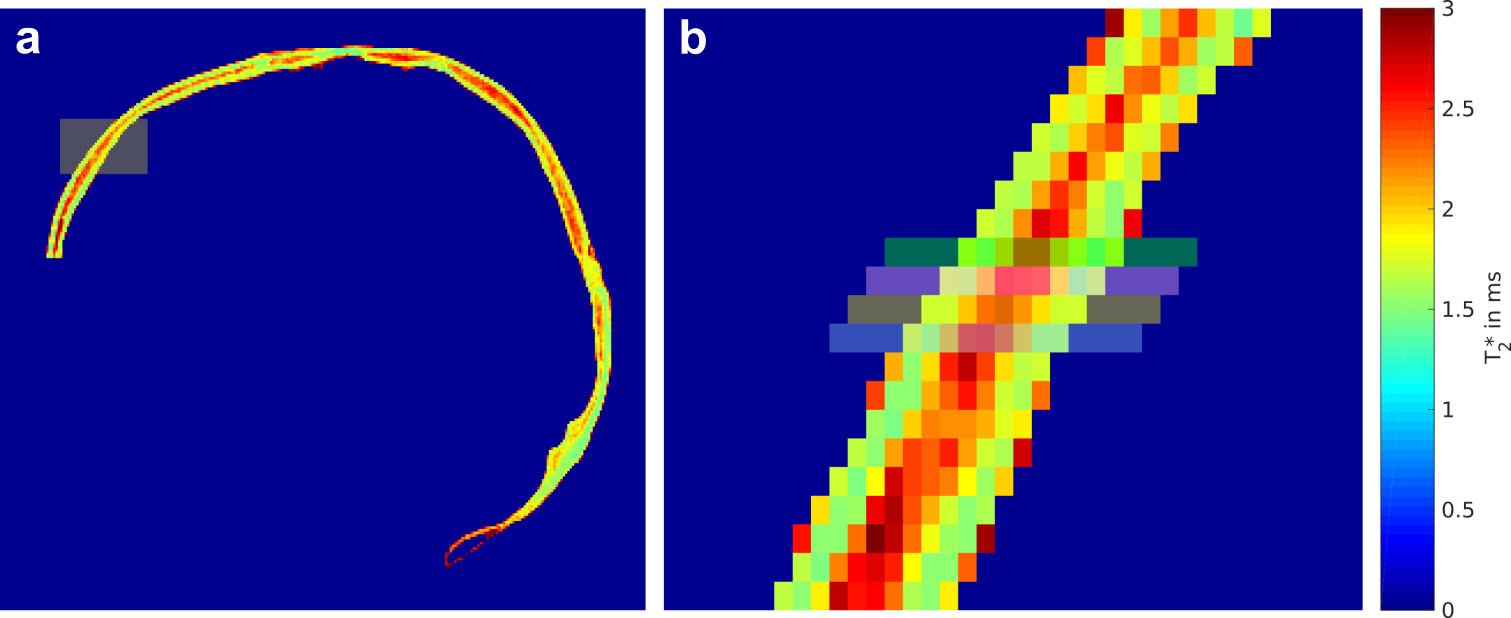
Figure 2: a) Manually segmented T2* map of the human skull from which the T2* frequency distribution (histogram) was derived. b) Zoomed section (indicated by orange box in (a)) with various profile lines through the three-layered cranial bone.
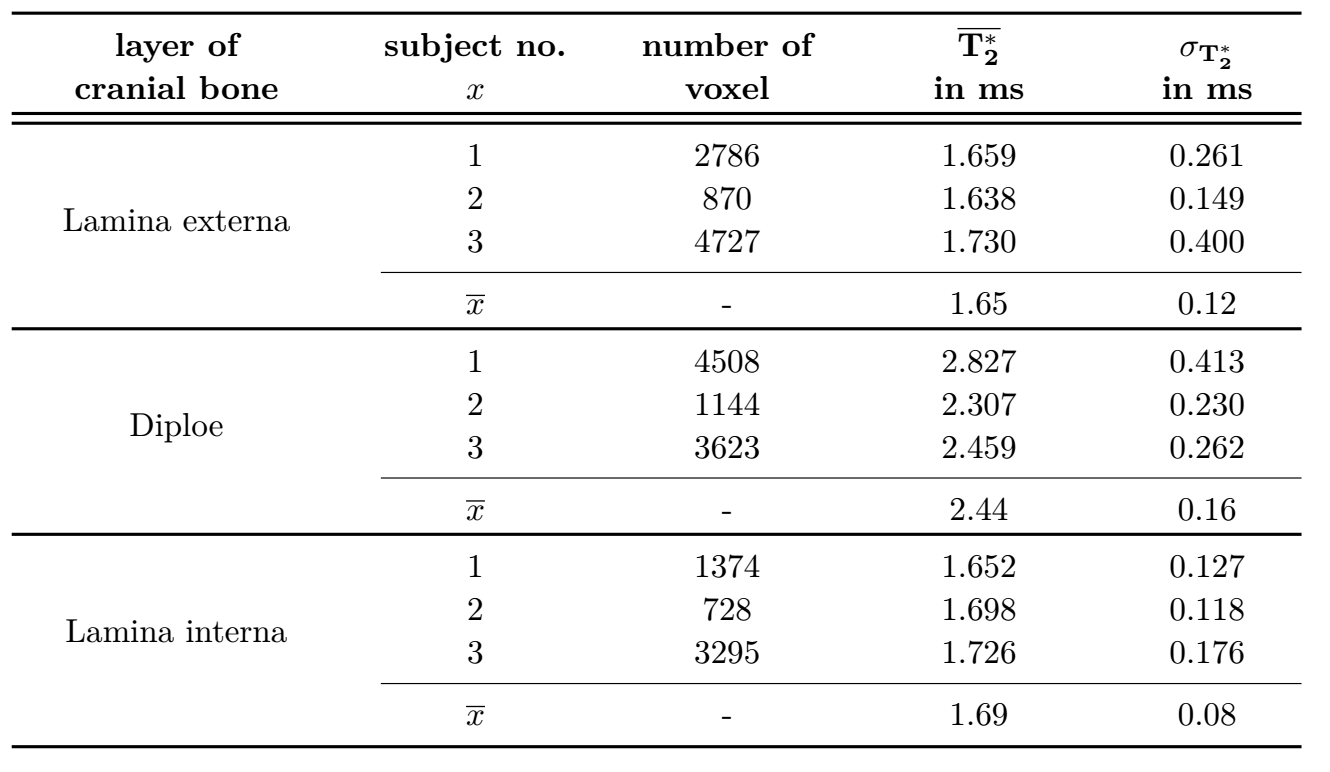
Figure 3: Summary of the analyzed voxel number, the estimated mean values and standard deviations of the T2* relaxation times for the three cranial bone layers lamina externa, diploe and lamina interna for each subject.
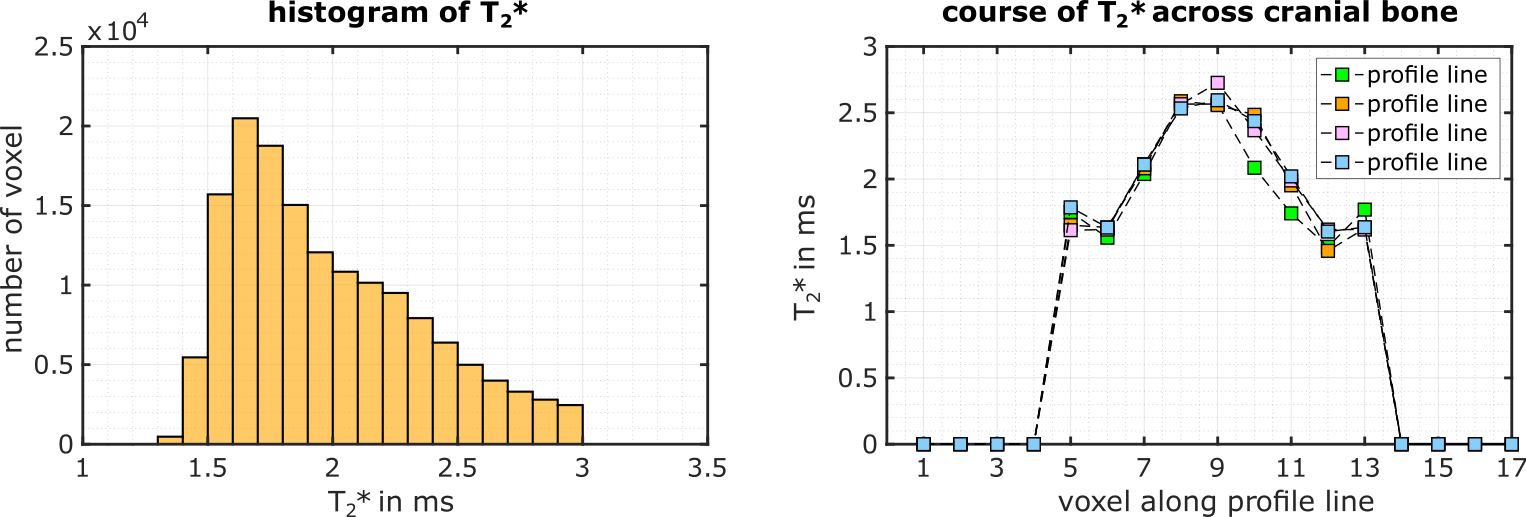
Figure 4: Left: T2* frequency distribution derived from the segmented T2* map of the human cranium (see Fig. 2a). Right: T2* values along the profile lines through the cranial bone (see Fig. 2b).