1368
Bone marrow adipose tissue with 3T CSE-MRI in vivo: Preliminary study for long-term repeatibility assessment1Radiology, NYU LANGONE HEALTH, New York City, NY, United States, 2Université de Lyon; CREATIS CNRS UMR 5220, Inserm U1206, INSA-Lyon, UCBL Lyon 1, Villeurbanne, France, 3Osteoporosis Center, Hospital for Joint Diseases, NYU LANGONE HEALTH, New York City, NY, United States
Synopsis
Bone is composed of two tissues: a mineralized cortical and trabecular bone component and a fatty and hematopoietic marrow component. Osteoporosis is a disease of weak bone and increased fracture risk due to low bone mass. Recent studies pointed link between bone marrow adipose tissue (bMAT) and osteoporosis notably in term of bMAT composition. Chemical Shift- Encoded MRI (CSE-MRI) allows detection of fat amount and fat composition. Our aim was to assess long term repeatability of CSE-MRI in proximal femur bMAT.
Introduction
Bone is composed of two tissues: a mineralized cortical and trabecular bone component and a fatty and hematopoietic marrow component 1. Osteoporosis is a disease of weak bone and increased fracture risk due to low bone mass and microarchitectural deterioration of bone tissue2.In clinical settings the diagnosis of osteoporosis has focused predominantly on the assessment of areal bone mineral density by dual-energy x-ray absorptiometry. Recent studies point to a link between bone marrow adipose tissue (BMAT) and osteoporosis notably in term of BMAT composition3. Chemical Shift- Encoded MRI (CSE-MRI) allows quantitative assessment of fat quantity and recent technical developments allow quantification of fat composition4-6. These methods have been evaluated in vivo notably in subcutaneous adipose tissue and liver in term of accuracy, reproducibility and repetability. Therefore, our aim is to assess long term repeatability of CSE-MRI in proximal femur BMAT.Material & Method
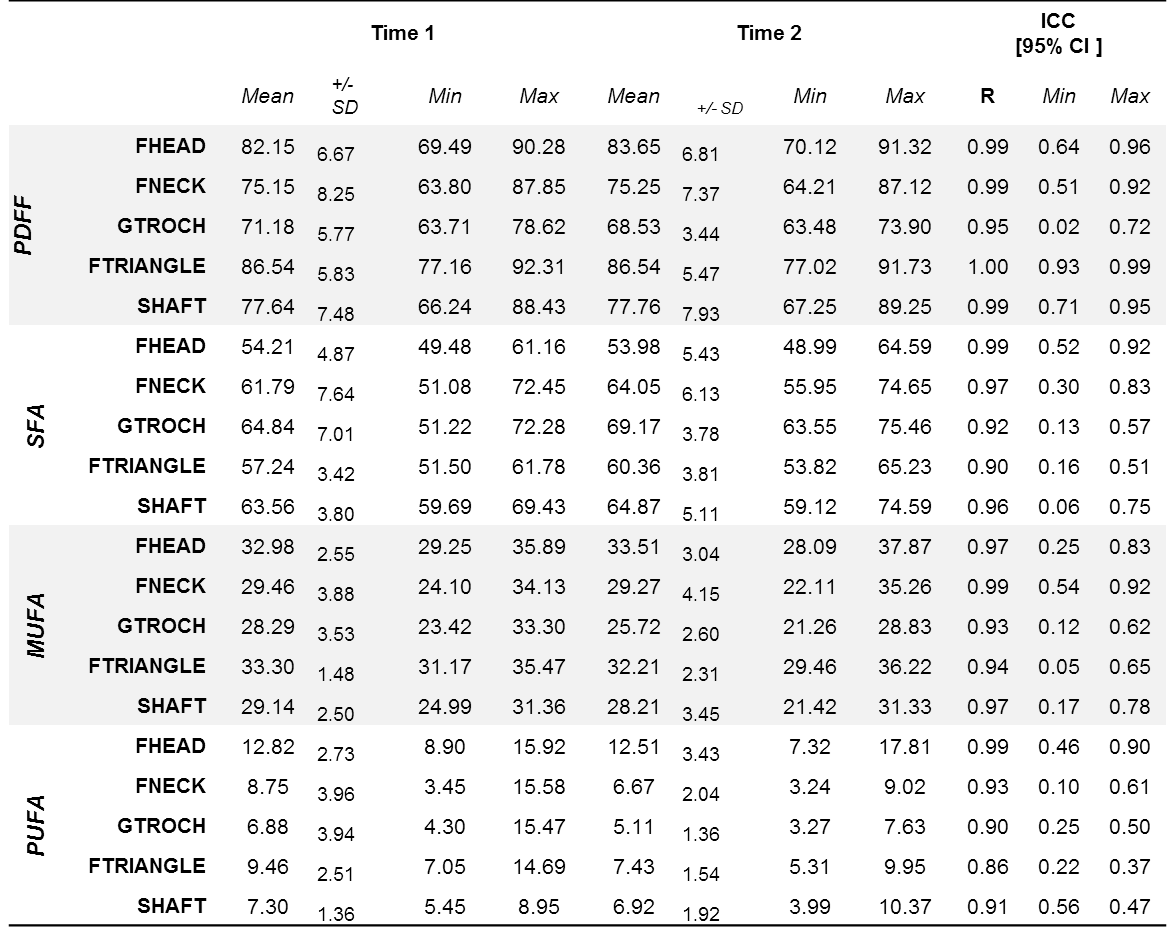
This study had institutional review board approval and written informed consent was obtained from all subjects. All subjects were recruited from the Rheumatology division at our institution. 6 subjects were recruited (6 females, bone mineral density T-score -0.12 ±0.7, age = 36.3 ±-13.7 years, BMI= 25.5 ±-3.2 kg/m2) . MR acquisitions were performed on a 3T MRI system (Skyra, Siemens Healthineers) using 3D spoiled gradient echo sequence with a 12 echoes train with flyblack readout gradient 32 coronal slices were acquired were acquired with the following parameters: TE/ΔTE/TR/FA/NA = 1.2ms/1.2ms/16ms/5°/4 and BW= 2000 Hz/px. Then images were processed using methods previously described5,7 to compute Proton Density Fat Fraction (PDFF) and fatty acid composition (i.e. saturated (SFA), monounsaturated (MUFA) and polyunsaturated (PUFA)) parametric maps). For long term repeatability, acquisitions were performed at two time points (time 1 and time 2 with difference of time of three months).Regions of Interest were then drawn and integrated in several proximal femur subregions: femoral head, neck, ward’s triangle, greater trochanter and in the shaft. Values were analyzed using Bland-Altman method of agreement8 intraclass correlation coefficient (ICC) and its 95% confidence intervals and coefficient of variation (CV, percentage ratio between standard deviation and mean of values) were calculated to assess reliability.Results
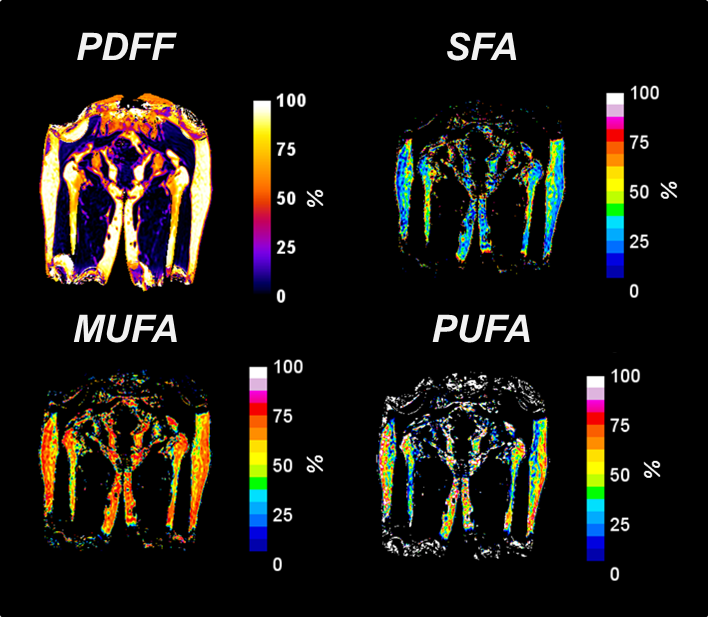
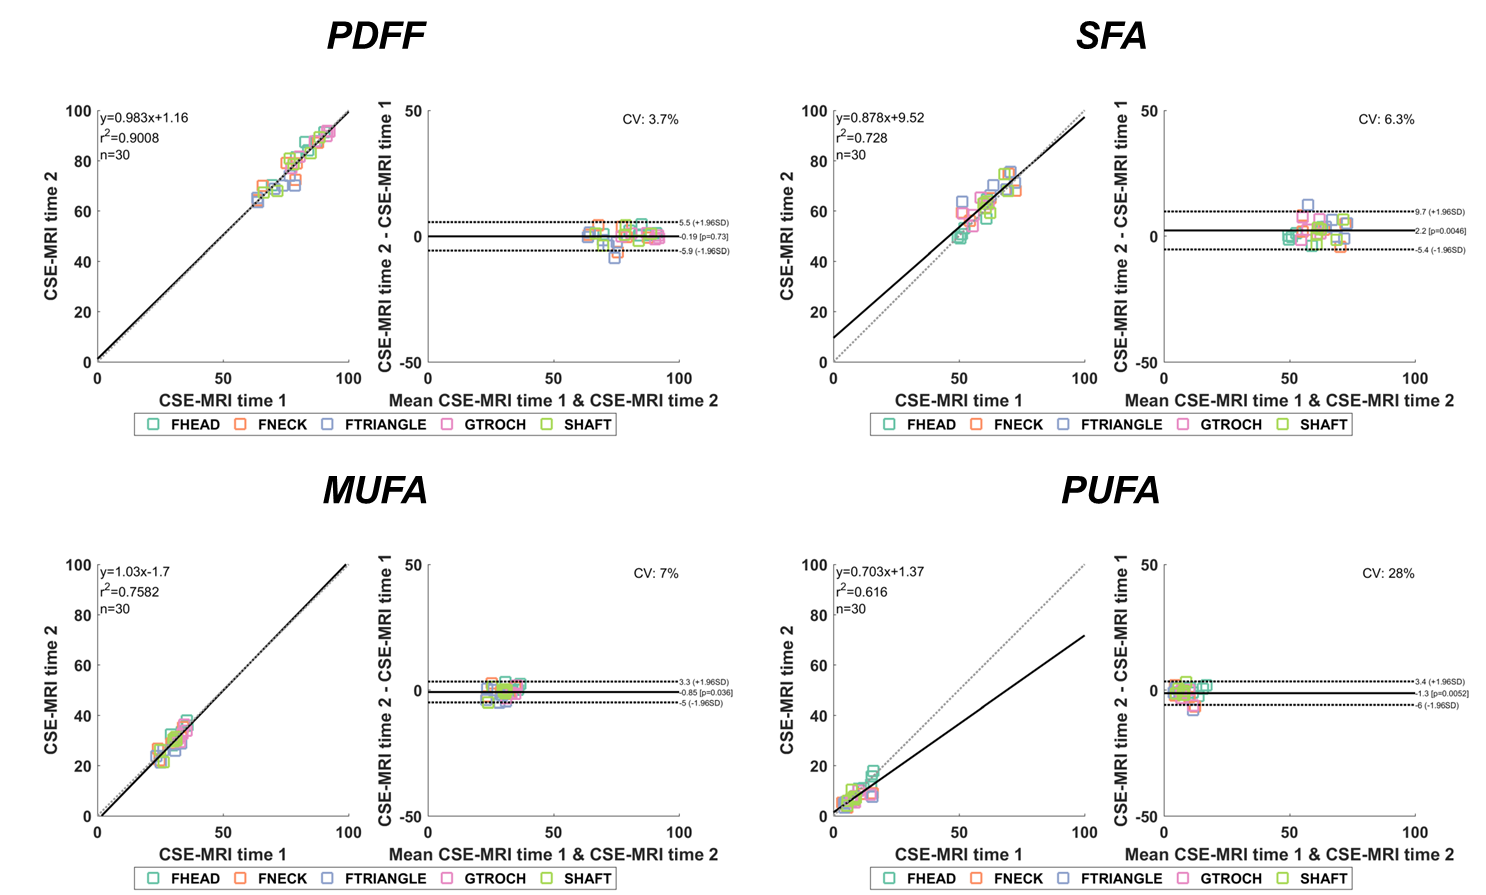
Figure 1 depicts typical parametric maps obtained. Figure 2 shows correlation plot and Bland-Altman plot for measurement of each parameter in each subregions. Table 1 gives values and ICC for each parameter in subregions. Excellent agreement is found for each parameter among each subregions between time 1 and time 2. ICC values goes from 0.86 to 0.99 reflecting good repeatability between time points. CVs are low for PDFF and SFA whereas index reflecting higher unsaturation especially for the femoral shaft in term of PUFA and femoral neck which could be due to remodeling of bone which can appears between time points.
Conclusion
CSE-MRI demonstrates between time point high long term repeatability of measurement for quantitative assessment of bone marrow adipose tissue composition.Acknowledgements
No acknowledgement found.References
1. Griffith JF, Guglielmi G. Bone Marrow Changes in Osteoporosis. In Osteoporos Bone Densitom Meas Edited by Berlin Heidelberg Springer Berlin Heidelberg.2013 SRC - GoogleScholar:69-85.
2. Consensus development conference: diagnosis, prophylaxis, and treatment of osteoporosis. Am J Med. 1993;94(6):646-650.
3. Yeung DK, Griffith JF, Antonio GE, Lee FK, Woo J, Leung PC. Osteoporosis is associated with increased marrow fat content and decreased marrow fat unsaturation: a proton MR spectroscopy study. J Magn Reson Imaging. 2005;22(2):279-285.
4. Leporq B, Lambert SA, Ronot M, Vilgrain V, Van Beers BE. Simultaneous MR quantification of hepatic fat content, fatty acid composition, transverse relaxation time and magnetic susceptibility for the diagnosis of non-alcoholic steatohepatitis. NMR Biomed. 2017;30(10):e3766.
5. Leporq B, Lambert SA, Ronot M, Vilgrain V, Van Beers BE. Quantification of the triglyceride fatty acid composition with 3.0 T MRI. NMR Biomed. 2014;27(10):1211-1221.
6. Nemeth A, Segrestin B, Leporq B, et al. 3D Chemical Shift-Encoded MRI for Volume and Composition Quantification of Abdominal Adipose Tissue During an Overfeeding Protocol in Healthy Volunteers. J Magn Reson Imaging.0(0).
7. Leporq B, Lambert SA, Ronot M, et al. Hepatic fat fraction and visceral adipose tissue fatty acid composition in mice: Quantification with 7.0T MRI. Magn Reson Med. 2016;76(2):510-518.
8. Martin Bland J, Altman D. Statistical Methods for Assessing Agreement between Two Methods of Clinical Measurement. The Lancet. 1986;327(8476):307-310.
Figures