1365
Evaluation of the Activity of Ankylosing Spondylitis by Diffusion Kurtosis Imaging in Sacroiliitis1Radiology, Drum Tower Hospital, School of Medicine, Nanjing University, Nanjing, China, 2Philips Healthcare, Shanghai, China
Synopsis
Forty-four patients with AS underwent MRI including DKI to evaluate the disease activity of AS. Four disease activity states were chosen: inactive disease and moderate, high, and very high disease activity. The D and ADC values of sacroiliac joints in the active group were significantly higher, while the K value was significantly lower than those of the inactive group. The D value performed best in distinguishing different activity grades. The D and ADC values correlated positively, while the K value correlated negatively, with activity grade significantly. DKI of sacroiliac joints might be useful to evaluate the disease activity of AS.
INTRODUCTION
Conventional
magnetic resonance (MR) imaging is limited in providing sufficient information
on microstructureor in quantitatively evaluating certain inflammation
processes. Functional MR sequences such as diffusion kurtosis
imaging (DKI)
might help to evaluate the sacroiliac joint in ankylosing spondylitis (AS)
patients.METHODS
Forty-four
patients with a diagnosis of AS according to the Assessment in
SpondyloArthritis International Society (ASAS) criteria underwent 3.0T MRI
including the DKI sequence (b=50, 500, 1000, 1500, 2000 s/mm2). Two-independent-samples
t-test and one-way analysis of variance (ANOVA) were used to compare the DKI
parameters among different groups, and post-hoc Scheffe’s method was adopted.
Receiver operating characteristic
(ROC) analysis
and Spearman’s rank correlation were performed to test the diagnostic
performance of DKI parameters in distinguishing different activity grades and
the correlation between them, respectively. AS disease
activity was evaluated according to the Ankylosing Spondylitis Disease Activity
Score (ASDAS), and four disease activity states were chosen by consensus:
inactive disease and moderate, high, and very high disease activity. The three
cutoffs selected to separate these states were: 1.3, 2.1, and 3.5 units,
respectively.RESULTS
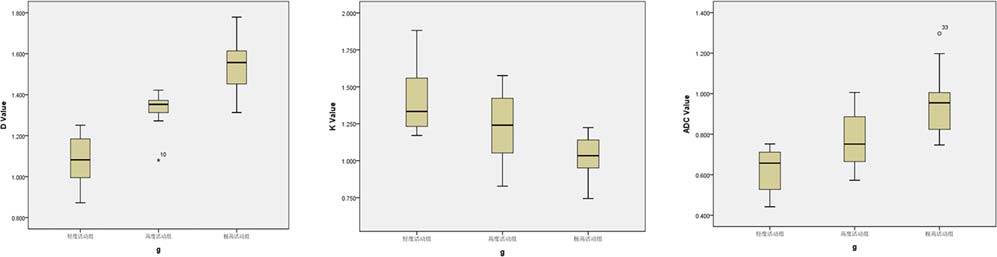
The corrected ADC
(D) and apparent diffusion coefficient (ADC) values of sacroiliac joints in the
active group were significantly higher, while the the kurtosis of diffusion (K
value) value was significantly lower than those of the inactive
group (all P<0.001). The D value performed best in
distinguishing different activity grades (all P<0.001). The D and ADC values correlated positively, while
the K value correlated negatively, with activity grade significantly (r=50.918,0.798, and –0.765, respectively; all P<0.001).DISCUSSION
In the current
study, it was observed that the D and ADC values of the sacroiliac joints in
active AS patients were significantly higher than those in inactive patients,
and the D and ADC values were correlated positively with the active grade of
AS. Previous study showed that in active AS, bone marrow edema and increased
vascular permeability caused an enlarged extracellular space and increased
water molecular diffusion. Meanwhile, the D values were closely related to
ASDAS and showed high sensitivity in distinguishing different activity grades,
indicating that the DKI-derived D value was superior to the DWI-derived ADC value
in reflecting the microstructure of the tissues. Therefore, the D value shows
great potential to evaluate the disease activity of AS. In our study, it was found
that the K value of the active group was significantly lower than that of the inactive
group and the K value was negatively correlated with the activity grade, which
might be due to decreased microstructural complexity in high active AS. We
speculated that with the increase in activity, bone marrow edema, microstructural
damage of the trabecular bone, and loss of bone mass would be aggravated;
therefore, the heterogeneity of the sacroiliac joint structure would decrease,
resulting in a decreased K value.CONCLUSION
DKI parameters have a high sensitivity and specificity in
distinguishing between the inactive and active groups. With a close correlation
with ASDAS, the D value could differentiate among different activity grades of
AS; thus, it is superior to traditional ADC values. In addition, the DKI
sequence can not only characterize the sacroiliac joints, but also provide a
more convenient and efficient way to assess the
disease activity compared with ASDAS.Acknowledgements
No acknowledgement found.References
1. Hermann KG, Bollow M. Magnetic resonance imaging of sacroiliitis in patients with spondyloarthritis: correlation with anatomy and histology. RoFo 2014;1863:230–237.
2. Bozgeyik Z, Ozgocmen S, Kocakoc E. Role of diffusion-weighted MRI in the detection of early active sacroiliitis. AJR Am J Roentgenol 2008;1914:980–986.
3. Rudwaleit M, Jurik AG, Hermann KG, et al. Defining active sacroiliitis on magnetic resonance imaging (MRI) for classification of axial spondyloarthritis: a consensual approach by the ASAS/OMERACT MRI group. Ann Rheum Dis 2009;6810:1520–1527.
4. Zhao YH, Li SL, Liu ZY, et al. Detection of active sacroiliitis with ankylosing spondylitis through intravoxel incoherent motion diffusionweighted MR imaging. Eur Radiol 2015;259:2754–2763.
5. Huang L, Li XH, Huang SY, et al. Diffusion kurtosis MRI versus conventional diffusion-weighted imaging for evaluating inflammatory activity in Crohn’s disease. J Magn Reson Imaging 2018;473:702–709.
Figures