1364
Construction of a population-based anatomical knee atlas and a probabilistic map of the spatial BML distribution1National Institute for Health Research (NIHR) Nottingham Biomedical Research Centre, Nottingham, United Kingdom, 2Sir Peter Mansfield Imaging Centre, University of Nottingham, Nottingham, United Kingdom, 3Arthritis Research UK Pain Centre and NIHR Nottingham BRC, University of Nottingham, Nottingham, United Kingdom, 4Division of Rheumatology, Orthopaedics and Dermatology, University of Nottingham, Nottingham, United Kingdom
Synopsis
The distribution of bone marrow lesions (BMLs) is an important factor in the assessment of osteoarthritis (OA) in the knee. We present a population-based (PB) anatomical atlas of the knee and a probabilistic map of the spatial distribution of BMLs.
INTRODUCTION
Osteoarthritis (OA) affects approximately 4% of the world’s population with the knee being one of the most commonly affected joints.1 OA is a polymorphic disease characterised by joint stiffness and chronic pain associated with pathological changes in the articular cartilage and in the bone and joint margins. One prominent pathology related to pain is subchondral bone marrow lesions (BMLs).2 Several classification schemes and individual atlases3,4,5 have been developed to provide classification criteria and radiographic descriptions. However, commonly used classification schemes3,4 use ordinal scales to assess pathology in pre-defined regions of interest and, consequently, do not take full advantage of the spatial information. Individual subject-specific atlases provide radiographic descriptions as reference but are not capable of showing the topography of lesions across populations. BMLs at specific locations might contribute differently to OA pain and structural progression, due to interaction with spatially discrete biomechanical and pathophysiological factors. Evaluation of BML topography is essential for mechanistic studies into the link between spatial location of BMLs, joint disease and pain.
The aim of our retrospective study was to construct the first population-based (PB) high-resolution anatomical knee atlas with a probabilistic map of spatial locations of BMLs.
METHODS
Eighteen OA patients (age=71±6 yoa) were scanned on a 3T GE MR 750 Discovery scanner (GE Healthcare, Massachusetts, US) with an 8 channel knee coil. A PD sequence was used to acquire sagittal $$$\{SAG_i\}_{i=1…N}$$$, coronal $$$\{COR_i\}_{i=1…N}$$$, and axial $$$\{AX_i\}_{i=1…N}$$$ scans with a high in-plane resolution of 0.3125 x 0.3125 mm (SAG: TE/TR=29/3270 ms, COR: TE/TR=29/2767ms, AX: TE/TR=32/2718 ms; FA=142°, FOV=16 cm, matrix=512 x 512, 27-32 slices, slice thickness=3 mm).
All images were N4 bias field corrected and up-sampled to isotropic voxel size. One high-resolution image $$$S_i$$$ was estimated for each subject by averaging the corresponding upsampled $$$SAG_i$$$, $$$COR_i$$$ and $$$AX_i$$$ (Fig. 1).
Similarly to a method previously described,6 the PB anatomical atlas was constructed by iteratively registering each $$$S_i$$$ to their average (Fig. 2). We performed 5 iterations of affine registrations and 10 iterations of nonlinear registrations. As a byproduct we also obtained a set of deformation fields $$$\{D_i\}_{i=1…N}$$$ mapping each $$$S_i$$$ to the atlas. Pathologies were masked to avoid the introduction of registration errors due to hyperintense voxels.
Masks were created by inverting individual labelmaps, which included segmentations for BMLs, cysts and osteophytes. These labelmaps were acquired with a semi-automatic segmentation pipeline similar to the one previously described7 (Figure 3). The bone structure was manually outlined by a trained radiologist. Groups of connected hyperintense voxels were highlighted based on mean intensity and standard deviation within the region and confirmed as pathology by a trained radiologist. Labelmaps were acquired in the subjects’ native spaces followed by upsampling to isotropic voxel size, fusion of coronal and sagittal segmentations and transformation to the average atlas by applying the corresponding $$$D_i$$$. Linear interpolation was used for all steps which provided us with one probabilistic labelmap per subject in the space of the atlas. The final PB probabilistic labelmap in atlas space was estimated by averaging over all individual probabilistic labelmaps.
RESULTS
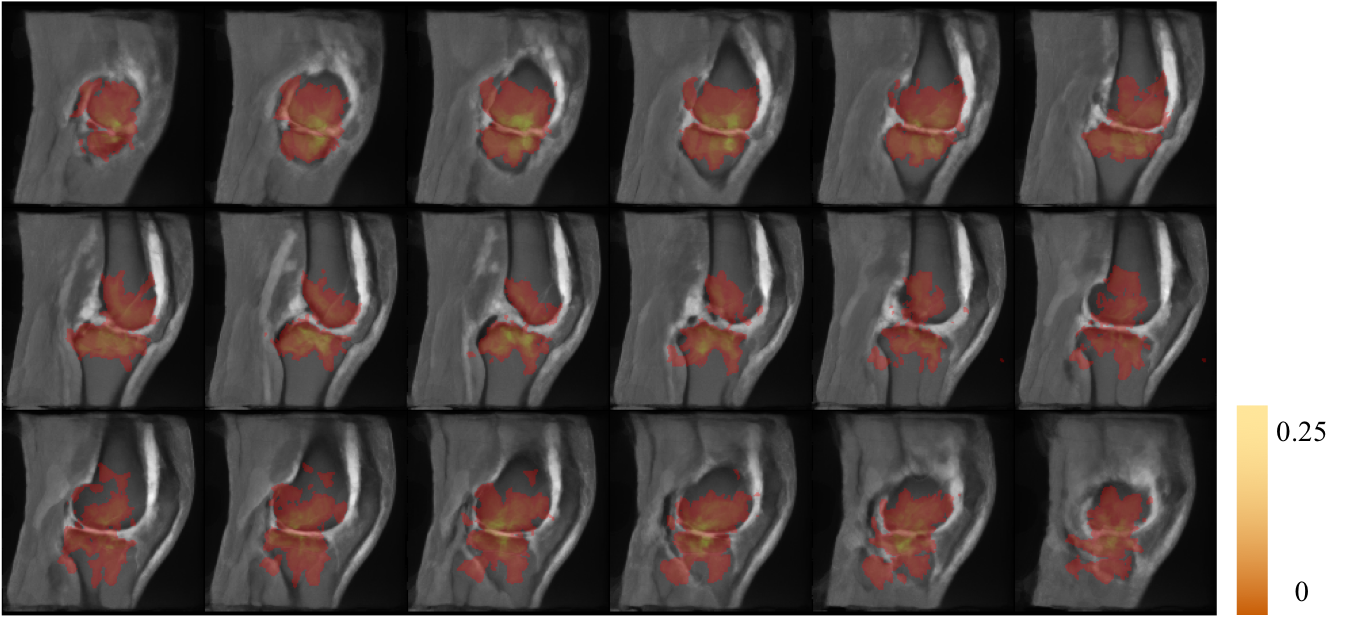
The PB anatomical atlas after 5 affine registrations (top) and after further 10 nonlinear registrations (bottom) is shown in Figure 4. Note how its appearance becomes crisper after each iteration. Sagittal slices of the final anatomical atlas and the probability map are illustrated in Figure 5. A higher probability of BMLs around the articular cartilage is noticeable.DISCUSSION
We constructed a high-resolution PB anatomical atlas from high in-plane resolution scans of OA patients and a probabilistic map of BMLs from individual labelmaps acquired with a semi-automated segmentation method. Upsampling to isotropic voxel size and concurrent fusion of anatomical scans caused blurring due to interpolation as would be expected. However, the appearance of the final anatomical atlas is clear with crisp borders. Individual labelmaps were acquired in the subjects’ low through-plane native spaces before upsampling and fusion due to the time intensive slice-by-slice segmentation method and crisp appearance of pathology. Imprecision of the final PB probabilistic labelmap will be caused by interpolation and registration errors. Future work will integrate additional subjects to capture a larger variability within the OA population. We will also develop a fast automated segmentation method applicable to high-resolution 3D images to avoid interpolations and further reduce segmentation time. Our atlas will also be an essential tool for topographic studies to mechanistically understand the link between BMLs and joint pathology (space narrowing, pressure) and between BMLs and pain.CONCLUSION
Our PB atlas of the knee and probabilistic map provide a space for normalisation, a reference for inter-subject comparison and give an estimate of the spatial locations of BMLs.Acknowledgements
Partly funded by the NIHR Nottingham BRCReferences
1. Vos T, Flaxmann AD, Naghavi M, et al. Years lived with disability (YLDs) for 1160 sequelae of 289 diseases and injuries 1990–2010: a systematic analysis for the Global Burden of Disease Study 2010. Lancet 2012;380:2163–2196.
2. Sowers MF, Hayes C, Jamadar D, et al. Magnetic resonance-detected subchondral bone marrow and cartilage defect characteristics associated with pain and X-ray-defined knee osteoarthritis. Osteoarthritis and Cartilage 2003;11(6):387-393.
3. Hunter DJ, Guermazi A, Lo GH, et al. Evolution of semi-quantitative whole joint assessment of knee OA: MOAKS (MRI Osteoarthritis Knee Score). Osteoarthritis and Cartilage 2011;19(8):990-1002
4. Altman RD, Gold GE. Atlas of individual radiographic features in osteoarthritis, revised. Osteoarthritis and Cartilage 2007;15(Sup1):A1-A56
5. Peterfy CG, Guermazi A, Zaim S, et al. Whole-organ magnetic resonance imaging score (WORMS) of the knee in osteoarthritis. Osteoarthritis Cartilage 2004;12:177e90.
6. Carballido-Gamio J, Majumdar S. Atlas-Based Knee Cartilage Assessment. Magn Reson Med 2011;66(2):574-583
7. Pang J, Driban J, Destenaves G, et al. Quantification of bone marrow lesion volume and volume change using semi-automated segmentation: data from the osteoarthritis initiative. BMC Musculoskelet Disord 2013;14:3
Figures