1363
Evaluation of the Condylar Position and Volume in the Temporomandibular Joint Using Zero Echo Time MRI1Institute of Biomedical Engineering, National Yang-Ming University, Taipei, Taiwan, 2Department of Radiology, Taipei Veterans General Hospital, Taipei, Taiwan, 3GE Healthcare, Taipei, Taiwan
Synopsis
The first clinical application with zero echo time (ZTE) based MR bone depiction and segmentation in the temporomandibular joint (TMJ) was presented in this study. Our result revealed that ZTE showed computed tomography (CT)-like bone contrast and more detailed demonstration of bony structures, which contributed more reliable structure images and volume measurements. A potential alternative radiation-free diagnostic approach, especially for patients who receive initial workups or serial follow-ups, can be adopted to assess the staging of temporomandibular disorder (TMD) by segmenting cortical bone of the condyle into normal bone, erosion, and sclerosis.
Purpose:
The condyloid process (also named condyle) plays a critical role in mandibular movements of gliding and hinge of the temporomandibular joint (TMJ). The previous studies suggested that the volume and shape of the condyle in patients with temporomandibular disorder (TMD) have been continuously altered and remodeled in a process of flattening, sclerosis, erosion, osteophytes, and absorption. Many imaging modalities, such as cone-beam computed tomography (CT) and MRI1 have been applied to facilitate the assessment of TMD, including the condyle-disc position, condylar cortical thickness, volume, and so on. The correlation of the signs (e.g., the positions of condyle, articular disc and fossa) and symptoms (e.g., pain) has been reported but with controversial results.2 With zero-echo time (ZTE) MR imaging, the bone-tissue discrepancy in the bilateral condyles can be more distinguishable than conventional MR images due to efficient sampling short T2* signals in cortical bone. The aim of this study is to quantify each subgroup volume of the bilateral condyles via three-dimensional (3D) reconstructed ZTE images and evaluate its value in clinical TMD.Methods:
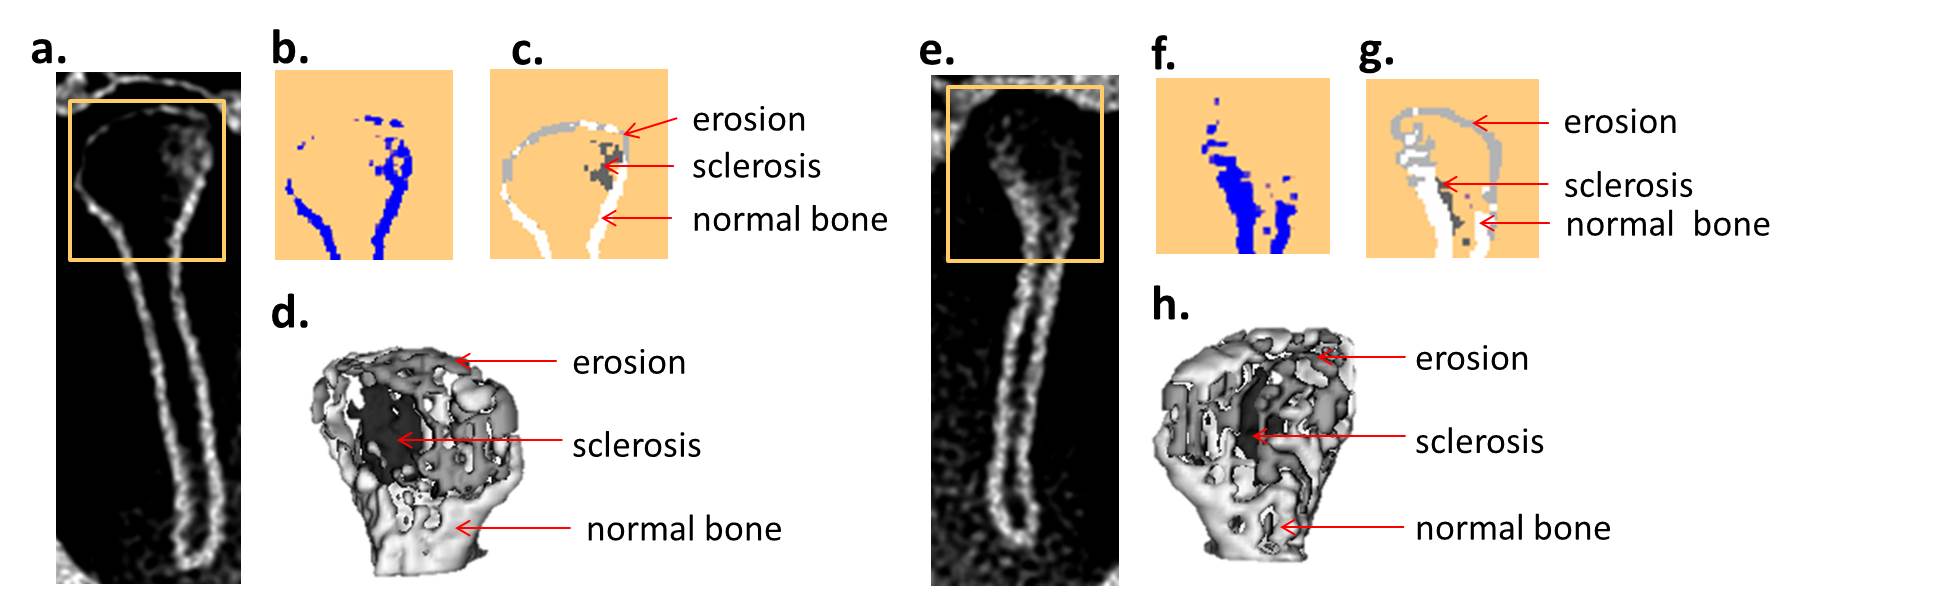
Six patients with clinically proved TMD were enrolled in this study. All six patients were assessed based on the clinical Wilkes stage (staging of internal derangement of TMJ by dentist: Stage I: early, II: early/intermediate, III: Intermediate, IV: Intermediate/late, V: late) . All MRI acquisitions were performed on a 1.5 T clinical scanner (Optima MR450w, GE Healthcare, Milwaukee, USA) using a head and-neck array coil as the signal detection and whole-body coil for radio-frequency excitation. ZTE data were carried out in a supine position and acquired using a non-selective hard pulse excitation followed by 3D center-out radial sampling. The scanning parameters were as follows: TR=548 ms, flip angle=1 degree, receiver bandwidth= 31.2 kHz, field-of-view= 20 cm, in-plane resolution= 0.39 mm, slice thickness=0.8 mm, scan time ≈ 3 mins. 2D sagittal and 3D view of the bilateral condyles were obtained and post-processed with ImageJ and a semi-automatic segmentation tool, ITK-SNAP. The condylar position in bilateral sides was calculated according to the formula3: CP= (posterior-anterior)/(posterior+anterior)×100%. Three subgroups in the cortex of corresponding condyle were classified as normal bone (normal cortex osseous component), erosion (including flattening) and sclerosis. The classified cortical volumes of condyles in bilateral sides of each patient were assessed and correlated with Wilkes stages. Statistics was performed with SPSS 17.0.Results and Discussions:
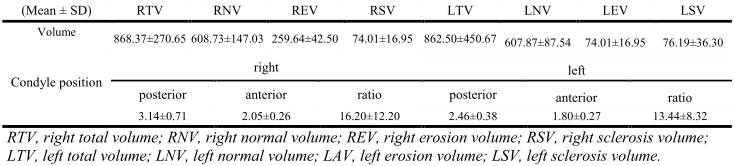
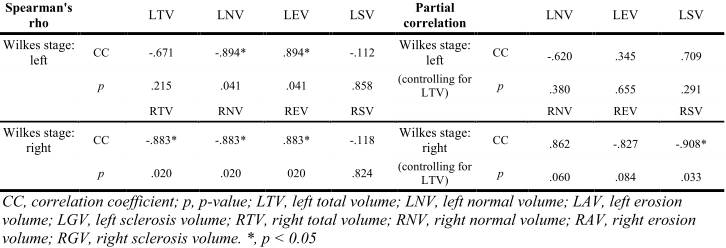
The bilateral condyle with ZTE MRI of a representative patient was shown in Fig. 1. The descriptive and inferential statistics were shown in Table 1 and Table 2, respectively. The consistency of the bilateral CP4 and the total volumes was found (p > 0.05). Sperman’s rank correlation coefficient was calculated for the correlation between the Wilkes stage and the volume of each group. The correlations between the subgroup volumes (normal and erosion) of the corresponding condyle and the Wilks stage were found (p < 0.05). In order to exclude the effect of the total volume (the sum of the normal bone and erosion) on the correlation between the Wilkes stage and the volume of each subgroup, the partial correlation was performed. It showed correlation between the volume of the sclerosis in the right condyle and Wilkes stage (p < 0.05), which may explain the pain dysfunction syndrome orally described by patients, even with the signs of condyle displacement (the recommended value of the centric position ranged within ±12)3. Even if there is no significant correlation between clinical staging and each volume (except the volume of the right-condyle sclerosis) while controlling for the total volume, accurate description of the temporomandibular size and shape is critical for clinical diagnosis and surgical planning.Conclusion:
We reported the first clinical application of ZTE MRI to segment TM condyles into three subgroups (normal, erosion, and sclerosis) and measure the condylar position and volume of each subgroup. A potential alternative radiation-free diagnostic option can be provided, especially for young patients who will receive the initial checkup or serial follow-ups and even surgeries. Further assessment of more TMJ with different stages is mandatory.Acknowledgements
No acknowledgement found.References
1. Bag AK, Gaddikeri S, Singhal A, et al. Imaging of the temporomandibular joint: An update. World J Radiol. 2014;6(8):567-582.
2. Liu Q, Wei X, Guan J, Wang R, Zou D, Yu L. Assessment of condylar morphology and position using MSCT in an Asian population. Clin Oral Investig. 2018;22(7):2653-2661.
3. Colonna AD, Manfredini D Dds PM, Lombardo LD, et al. Comparative analysis of jaw morphology and temporomandibular disorders: A three-dimension imaging study. Cranio. 2018:1-10.
4. Ren YF, Isberg A, Westesson PL. Condyle position in the temporomandibular joint. Comparison between asymptomatic volunteers with normal disk position and patients with disk displacement. Oral Surg Oral Med Oral Pathol Oral Radiol Endod. 1995;80(1):101-107.
Figures