1362
Percentage fat fraction in magnetic resonance imaging: an upgrade of the osteoporosis detecting parameter1Honghui Hospital, Xi'an Jiaotong University College of Medicine, Xi'an,Shaanxi, China, 2First Affiliated Hospital, Medical College Xi'an Jiaotong University, Xi'an, Shaanxi, China
Synopsis
The diagnosis of osteoporosis (OP) is mainly based on orthopedic imaging approaches. The percentage fat fraction (FF%) in magnetic resonance imaging (MRI) has the potential to be used to predict and diagnose OP. In both 1-H MRS and mDIXON Quant MRI, the FF% exhibited a negative correlation with BMD. Among the three groups, the OP patients had significantly higher FF% compared to healthy subjects. In addition, the FF% according to mDIXON exhibited a positive correlation with age, and BMD showed a negative linear relationship with age. Furthermore, females had a higher FF% level compared to males. Furthermore, height was correlated with BMD but not FF%. MRI investigation (especially the FF% according to the mDIXON Quant imaging system) is useful in OP assessment. Parameters including gender and age, as well as height, are important factors for OP prediction and diagnosis.
Introduction
The diagnosis of osteoporosis (OP) is mainly based on orthopedic imaging approaches. The percentage fat fraction (FF%) in magnetic resonance imaging (MRI) has the potential to be used to predict and diagnose OP.Methods
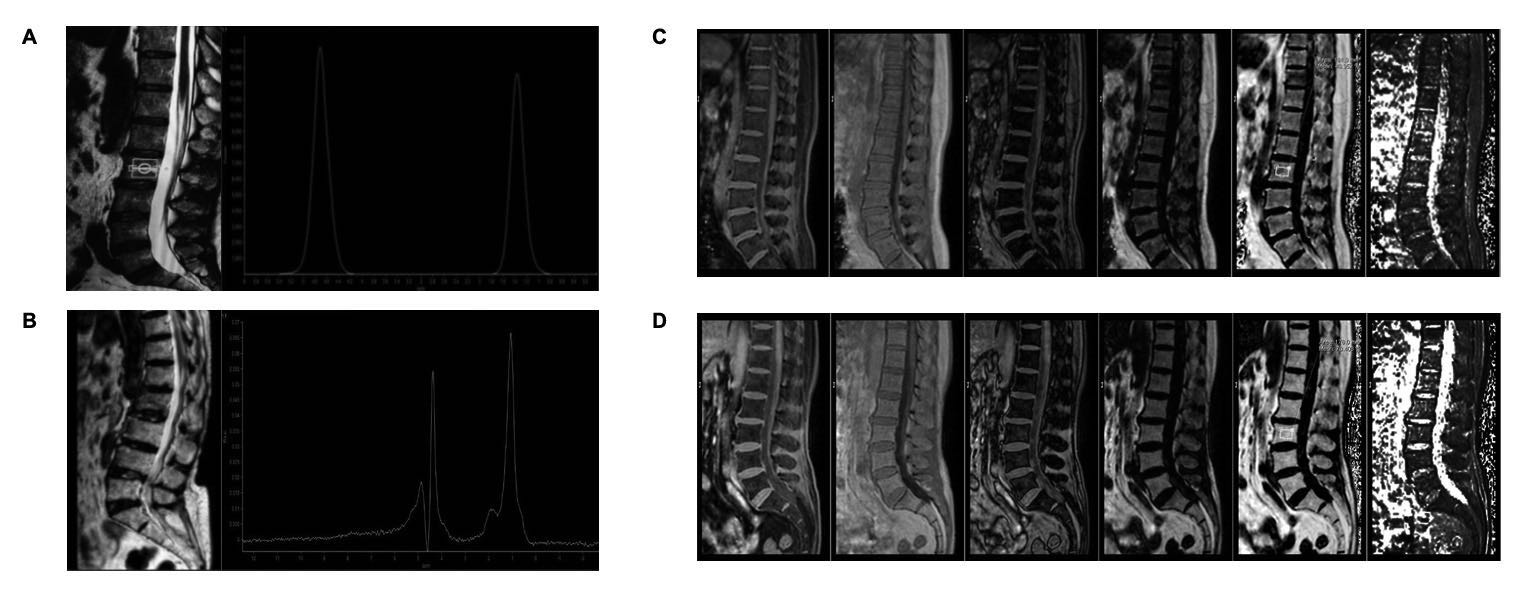
We enrolled 76 subjects and used quantitative computed tomography (QCT) to determine the bone mineral density (BMD). Patients with BMD higher than 120 mg/cm3 were categorized as normal controls, those with BMD between 80-120 mg /cm3 were diagnosed with osteopenia, and those with BMD lower than 80 mg/cm3 as having OP. The following parameters were recorded: gender, age, height, body weight, waist circumference, hip circumference. The FF% values as determined by 1-H MRS examination and mDIXON Quant scanning were acquired at the same time.Results
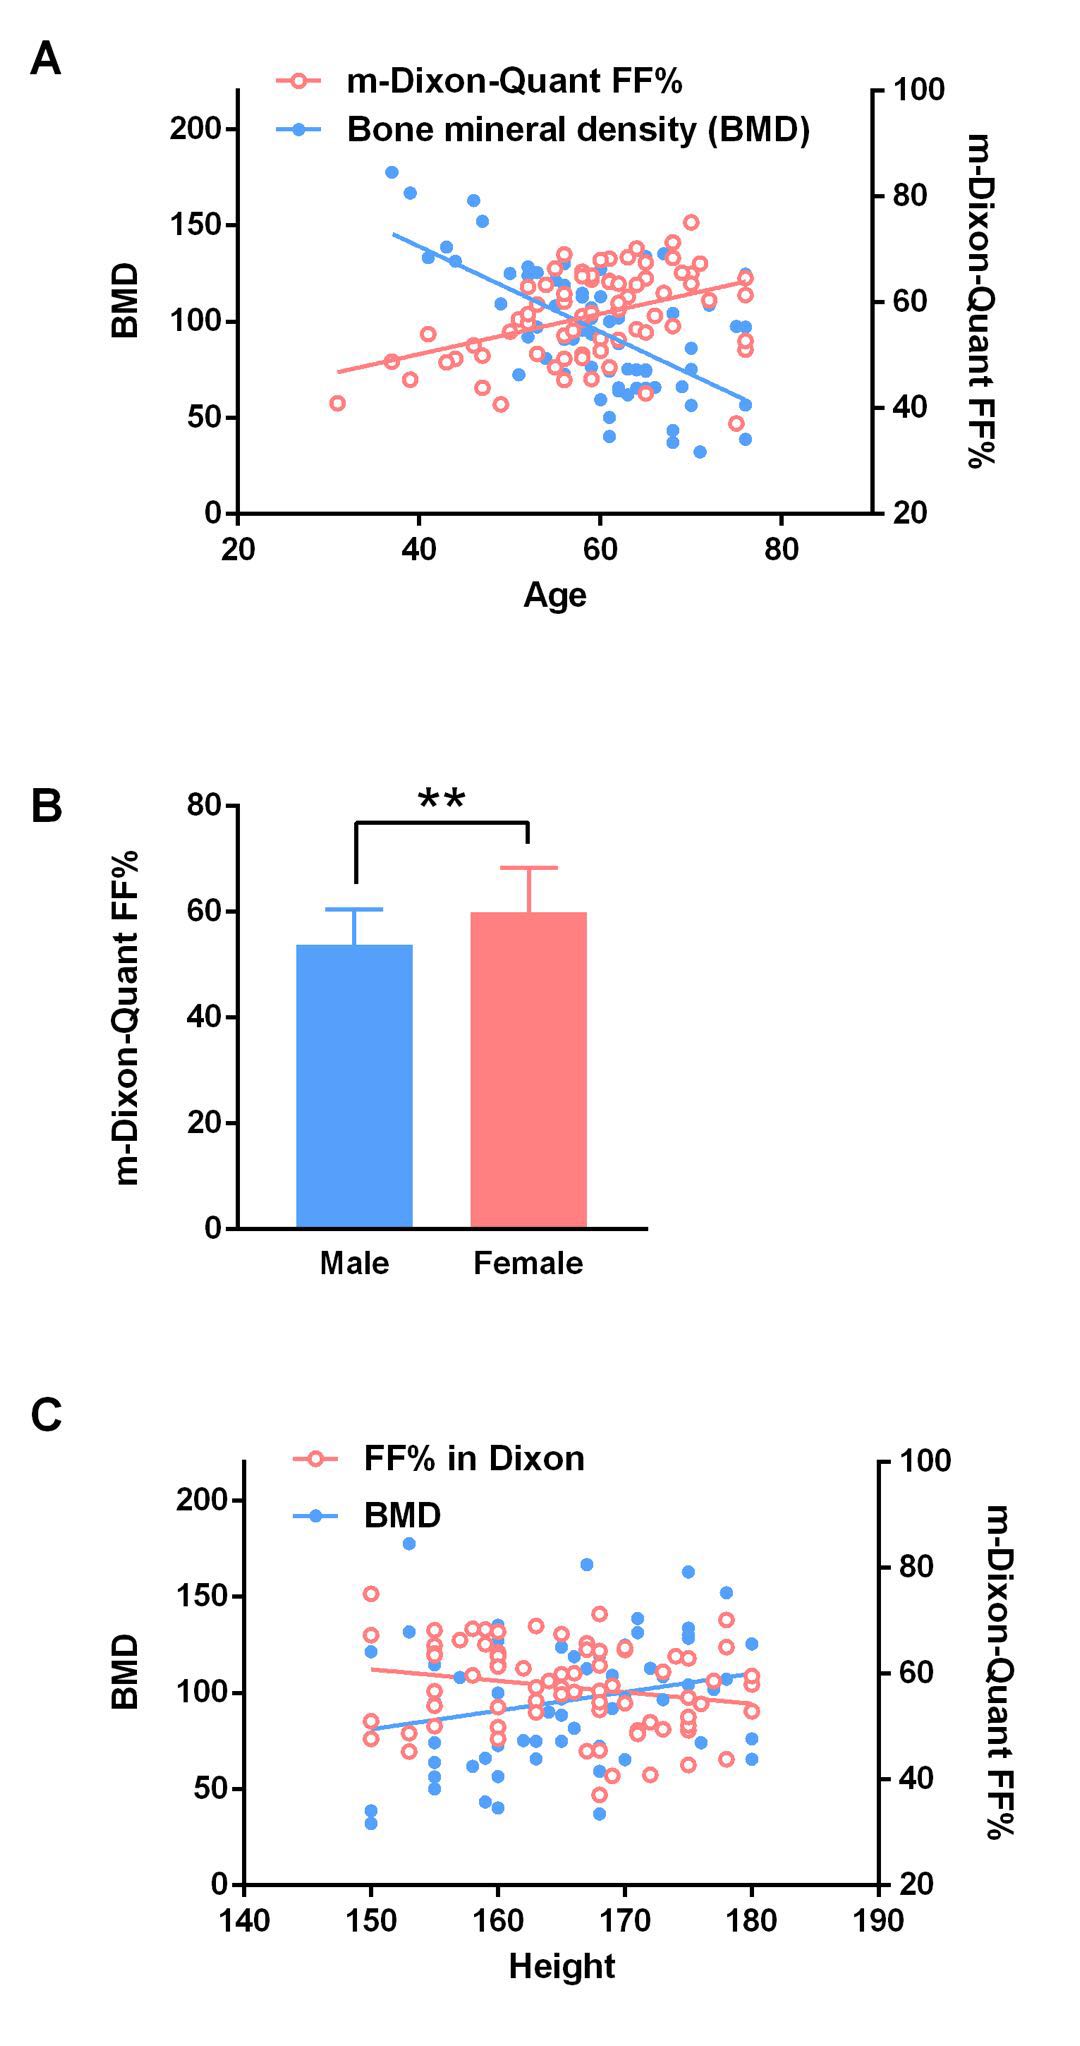
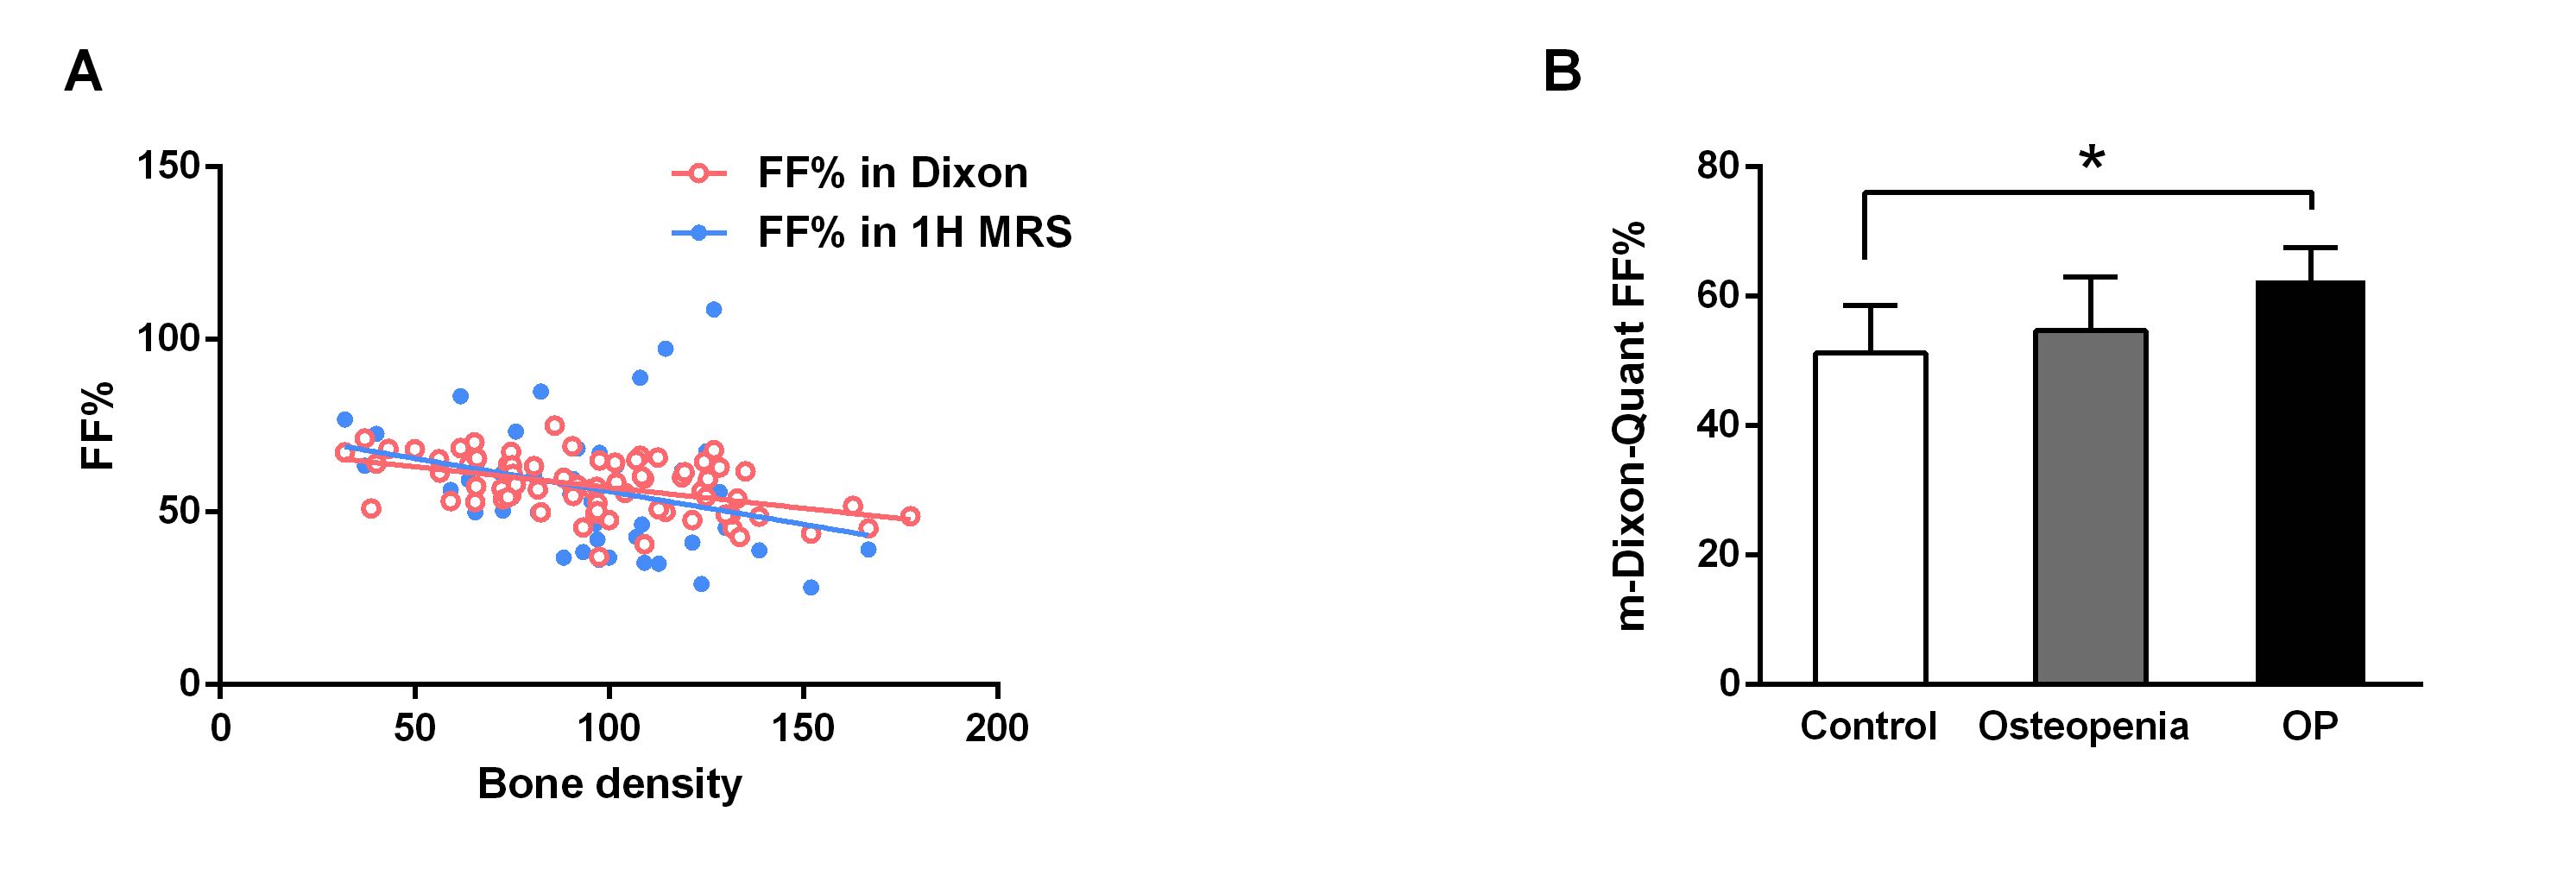
In both 1-H MRS and mDIXON Quant MRI, the FF% exhibited a negative correlation with BMD. Among the three groups, the OP patients had significantly higher FF% compared to healthy subjects. In addition, the FF% according to mDIXON exhibited a positive correlation with age, and BMD showed a negative linear relationship with age. Furthermore, females had a higher FF% level compared to males. Furthermore, height was correlated with BMD but not FF%.Conclusion
MRI investigation (especially the FF% according to the mDIXON Quant imaging system) is useful in OP assessment. Parameters including gender and age, as well as height, are important factors for OP prediction and diagnosis.Acknowledgements
We thank Prof. Ming Zhang for the critical review of this paper.References
1.E.M. Curtis, R.J. Moon, N.C. Harvey, C. Cooper. Reprint of: The impact of fragility fracture and approaches to osteoporosis risk assessment worldwide. International journal of orthopaedic and trauma nursing. 26 (2017) 7-17, https://doi.org/10.1016/j.ijotn.2017.04.004.
2.J.S. Bae, J.H. Park, K.J. Kim, H.S. Kim, I.T. Jang, Analysis of Risk Factors for Secondary New Vertebral Compression Fracture Following Percutaneous Vertebroplasty in Patients with Osteoporosis, World Neurosurg. 99 (2017), https://doi.org/10.1016/j.wneu.2016.12.038.
3.C.T. Chao, C.K. Chiang, J.W. Huang, D.C. Chan, Effect Of Frail Phenotype on Bone Mass And Vertebral Compression Fracture In Individuals Undergoing Dialysis, J. Am. Geriatr. Soc. 64 (2016) E19-E21, https://doi.org/10.1111/jgs.14296.
4.L. Oei, F. Koromani, F. Rivadeneira, M.C. Zillikens, E.H.G. Oei, Quantitative imaging methods in osteoporosis, Quant Imag Med Surg. 6 (2016) 680-698, http://dx.doi.org/10.21037/qims.2016.12.13.
5.O. Johnell, J.A. Kanis, A. Oden, H. Johansson, C. De Laet, P. Delmas, J.A. Eisman, S. Fujiwara, H. Kroger, D. Mellstrom, P.J. Meunier, L.J. Melton, T. O'Neill, H. Pols, J. Reeve, A. Silman, A. Tenenhouse, Predictive value of BMD for hip and other fractures, J. Bone Miner. Res. 20 (2005) 1185-1194, https://doi.org/10.1359/JBMR.050304.
6.D. Marshall, O. Johnell, H. Wedel, Meta-analysis of how well measures of bone mineral density predict occurrence of osteoporotic fractures, Br. Med. J. 312 (1996) 1254-1259, https://doi.org/10.1136/bmj.312.7041.1254.
7.S.A. Wainwright, L.M. Marshall, K.E. Ensrud, J.A. Cauley, D.M. Black, T.A. Hillier, M.C. Hochberg, M.T. Vogt, E.S. Orwoll, S.O.F.R. G, Hip fracture in women without osteoporosis, J. Clin. Endocrinol. Metab. 90 (2005) 2787-2793, https://doi.org/10.1210/jc.2004-1568.
8.E. Seeman, Is a change in bone mineral density a sensitive and specific surrogate of anti-fracture efficacy? , Bone. 41 (2007) 308-317, https://doi.org/10.1016/j.bone.2007.06.010.
9.J. Deng, J. Ding, S. Xu, R. Geng, A. He, Software Design for a Portable Ultrasound Bone Densitometer, Sheng wu yi xue gong cheng xue za zhi= Journal of biomedical engineering= Shengwu yixue gongchengxue zazhi. 32 (2015) 1026-1030.
10.Z. Yu, L. Yang, S. Xu, J. Deng, Q. Dong, A. He, An improved software design of ultrasound bone densitometer, Sheng wu yi xue gong cheng xue za zhi= Journal of biomedical engineering= Shengwu yixue gongchengxue zazhi. 31 (2014) 1061-1064
11.E.M. Stein, F. Rosete, P. Young, M. Kamanda-Kosseh, D.J. McMahon, G.M. Luo, J.J. Kaufman, E. Shane, R.S. Siffert, Clinical Assessment Of the 1/3 Radius Using a New Desktop Ultrasonic Bone Densitometer, Ultrasound Med. Biol. 39 (2013) 388-395, https://doi.org/10.1016/j.ultrasmedbio.2012.09.024.
12.J.J. Kaufman, G. Luo, R.S. Siffert, A portable real-time ultrasonic bone densitometer, Ultrasound Med. Biol. 33 (2007) 1445-1452, https://doi.org/10.1016/j.ultrasmedbio.2007.04.007.
13. K. Ecklund, S. Vajapeyam, R.V. Mulkern, H.A. Feldman, J.M. O'Donnell, A.D. DiVasta, C.M. Gordon, Bone marrow fat content in 70 adolescent girls with anorexia nervosa: Magnetic resonance imaging and magnetic resonance spectroscopy assessment, Pediatr. Radiol. 47 (2017) 952-962, https://doi.org/10.1007/s00247-017-3856-3.
14.R. Meenambal, P. Poojar, S. Geethanath, S. Kannan, Substitutional limit of gadolinium in beta-tricalcium phosphate and its magnetic resonance imaging characteristics, J Biomed Mater Res B. 105 (2017) 2545-2552, https://doi.org/10.1002/jbm.b.33775.
15.Y. Iwata, S. Nakajima, E. Plitman, Y. Mihashi, F. Caravaggio, J.K. Chung, A. Graff-Guerrero, Neurometabolite levels in antipsychotic-naïve/free patients with schizophrenia: A systematic review and meta-analysis of 1 H-MRS studies, Progress in Neuro-Psychopharmacology and Biological Psychiatry. (2018), https://doi.org/10.1016/j.pnpbp.2018.03.016.
16.Y. Yoshimura, D. Suzuki, K. Miyahara, Measurement Accuracy of Fat and Iron Deposits in the Liver Using 1H-MRS (HISTO), Nihon Hoshasen Gijutsu Gakkai zasshi. 74 (2018) 148-153, https://doi.org/10.6009/jjrt.2018_JSRT_74.2.148.
17.V. Veeramuthu, P. Seow, V. Narayanan, J.H.D. Wong, L.K. Tan, A.T. Hernowo, N. Ramli, Neurometabolites Alteration in the Acute Phase of Mild Traumatic Brain Injury (mTBI): An In Vivo Proton Magnetic Resonance Spectroscopy (1H-MRS) Study, Academic radiology. (2018), https://doi.org/10.1016/j.acra.2018.01.005.
18. N. Zhou, C. Chu, X. Dou, W.B. Chen, J. He, J. Yan, Z.Y. Zhou, X.F. Yang, Early evaluation of radiation-induced parotid damage in patients with nasopharyngeal carcinoma by T2 mapping and mDIXON Quant imaging: initial findings, Radiation Oncology. 13 (2018), https://doi.org/10.1186/s13014-018-0970-9.
19. Y.Y. An, H.X. Li, Y. Zhan, X.W. Lei, Value of mDIXON-Quant sequence, diffusion-weighted imaging in quantitatively diagnosing the sacroiliitis stages, Zhonghua yi xue za zhi, 97 (2017) 2908-2912, https://doi.org/10.3760/cma.j.issn.0376-2491.2017.37.007.
20.Y. Kise, T. Chikui, Y. Yamashita, K. Kobayashi, K. Yoshiura, Clinical usefulness of the mDIXON Quant the method for estimation of the salivary gland fat fraction: comparison with MR spectroscopy, Br. J. Radiol. 90 (2017), https://doi.org/10.1259/bjr.20160704
21.Y.F. Chang, C.S. Chang, M.W. Wang, C.F. Wu, C.Y. Chen, H.J. Chang, P.H. Kuo, C.H. Wu, Effects of Age and Body Mass Index on Thoracolumbar Spine X-Ray for Diagnosing Osteoporosis in Elderly Women: Tianliao Old People (TOP) Study 07, PLoS One. 11 (2016), https://doi.org/10.1371/journal.pone.0161773.
22. M.Y. Liu, Y. Zhang, X.L. Cheng, Y.H. Lu, N. Li, Y.P. Gong, Y. Pei, C.L. Li, The effect of age on the changes in bone mineral density and osteoporosis detection rates in Han Chinese men over the age of 50, Aging Male. 17 (2014) 166-173, https://doi.org/10.3109/13685538.2014.940308.
23. C. Tanprasertkul, P. Wattanaruangkowit, K. Panyakhamlerd, The combination of body mass index and age as a new index for identifying osteoporosis in Thai postmenopausal women, J Med Assoc Thai. 93 (2010) S76-S82.
24. L. Xu, Y. Duanmu, G.M. Blake, C.X. Zhang, Y. Zhang, K. Brown, X.Q. Wang, P. Wang, X.G. Zhou, M.L. Zhang, C. Wang, Z. Guo, G. Guglielmi, X.G. Cheng, Validation of goose liver fat measurement by QCT and CSE-MRI with biochemical extraction and pathology as reference, Eur. Radiol. 28 (2018) 2003-2012, https://doi.org/10.1007/s00330-017-5189-x
25. T. Lowitz, O. Museyko, V. Bousson, L. Laouisset, W.A. Kalender, J.D. Laredo, K. Engelke, Bone marrow lesions identified by MRI in knee osteoarthritis are associated with locally increased bone mineral density measured by QCT, Osteoarthritis Cartilage. 21 (2013) 957-964, https://doi.org/10.1016/j.joca.2013.04.006.
26. Y. Ishida, S. Kawai, Diagnostic imaging in osteoporosis (CT and MRI), Clinical calcium. 11 (2001) 1561-1567.
27. J. Hong, J.A. Hipp, R.V. Mulkern, D. Jaramillo, B.D. Snyder, Magnetic resonance imaging measurements of bone density and cross-sectional geometry, Calcif. Tissue Int., 66 (2000) 74-78.
28. K.Y. Ho, H.C.H. Hu, J.H. Keyak, P.M. Colletti, C.M. Powers, Measuring bone mineral density with fat-water MRI: comparison with computed tomography, J. Magn. Reson. Imaging. 37 (2013) 237-242, https://doi.org/10.1002/jmri.23749.
29. K. Lekadir, C. Hoogendoorn, P. Armitage, E. Whitby, D. King, P. Dimitri, A.F. Frangi, Estimation of trabecular bone parameters in children from multisequence MRI using texture-based regression, Med. Phys. 43 (2016) 3071-3079, https://doi.org/10.1118/1.4950713.
30. S.K. Hui, L. Arentsen, T. Sueblinvong, K. Brown, P. Bolan, R.G. Ghebre, L. Downs, R. Shanley, K.E. Hansen, A.G. Minenko, Y. Takhashi, M. Yagi, Y. Zhang, M. Geller, M. Reynolds, C.K. Lee, A.H. Blaes, S. Allen, B.B. Zobel, C. Le, J. Froelich, C. Rosen, D. Yee, A phase I feasibility study of multi-modality imaging assessing rapid expansion of marrow fat and decreased bone mineral density in cancer patients, Bone. 73 (2015) 90-97, https://doi.org/10.1016/j.bone.2014.12.014.
31. J. He, H. Fang, X.N. Li, Vertebral bone marrow diffusivity in normal adults with varying bone densities at 3T diffusion-weighted imaging, Acta Radiol. 59 (2018) 89-96, https://doi.org/10.1177/0284185117704235.
32. C. Becker, A.W. Baltzer, M. Schneppenheim, A. Becker, J. Assheuer, H.R. Merk, R. Krauspe, Experimental validation of DXA and MRI-based bone density measurement by ash-method, Zentralblatt fur Chirurgie. 126 (2001) 402-406, https://doi.org/ 10.1055/s-2001-14755.
33. M.K. Manhard, J.S. Nyman, M.D. Does, Advances in imaging approaches to fracture risk evaluation, Translational Research. 181 (2017) 1-14, https://doi.org/10.1016/j.trsl.2016.09.006.
34.T.M. Link, Radiology of Osteoporosis, Canadian Association of Radiologists Journal-Journal De L Association Canadienne Des Radiologistes. 67 (2016) 28-40, https://doi.org/10.1016/j.carj.2015.02.002. 35. M. Rebuzzi, V. Vinicola, F. Taggi, U. Sabatini, F.W. Wehrli, S. Capuani, Potential diagnostic role of the MRI-derived internal magnetic field gradient in calcaneus cancellous bone for evaluating postmenopausal osteoporosis at 3 T, Bone. 57 (2013)155-163,https://doi.org/10.1016/j.bone.2013.07.027.
Figures