1361
Intravoxel Incoherent Motion Outperforms Monoexponential and Kurtosis Models of Diffusion Attenuation in Normal and Inflamed Bone Marrow1Centre for Medical Imaging, University College London, London, United Kingdom, 2Magnetic Resonance Imaging Physics, University College London Hospitals, London, United Kingdom, 3Centre for Medical Image Computing, University College London, London, United Kingdom
Synopsis
Recently, there has been interest in the use of diffusion-weighted imaging (DWI) for quantifying inflammation of the skeleton. In spondyloarthritis, inflammatory exudates in the bone marrow increase the apparent diffusion coefficient (ADC), likely reflecting increased extracellular water. However, the ADC is a simplistic ‘summary’ measure and fails to disentangle the complex pathophysiological changes occurring at inflamed sites. Here, we show that the intravoxel incoherent motion (IVIM) model captures both the rapid ‘perfusion’ component and the slower ‘tissue’ components of the bone marrow diffusion signal, and thus provides a more accurate description of the signal than monoexponential and kurtosis models.
Introduction
Spondyloarthritis is an immune-mediated inflammatory disease characterised by inflammation and new bone formation in the spine, associated with substantial morbidity and disability. MRI is commonly used to monitor inflammation and guide treatment in spondyloarthritis, but conventional techniques are limited and provide only indirect information about tissue characteristics. Therefore, diffusion-weighted imaging has been investigated as method for quantifying inflammation, with promising initial results [1,2]. However, the apparent diffusion coefficient (ADC) is a simplistic ‘summary’ measure and fails to disentangle the complex pathophysiological changes occurring in the inflammatory exudate [3]. As a result, more sophisticated models of diffusion attenuation have been investigated. For example, the intravoxel incoherent motion (IVIM) model incorporates translational movements in addition to diffusion [4], and might therefore capture changes in perfusion at inflamed sites [5]. Similarly, diffusion kurtosis imaging (DKI) [6] has recently been investigated as a means to capture complexities in microstructure [7]. However, to our knowledge there have been no studies examining whether these models better fit the observed data, and no studies justifying their use over the simple monoexponential model. Similarly, the size of the error introduced by the simple monoexponential assumption – and the potential effect on diagnostic accuracy - is unknown.Methods
Fifty-three patients with known or suspected spondyloarthritis underwent MRI of the sacroiliac joints on a 1.5T Siemens Avanto scanner. Diffusion-weighted images were acquired using a conventional Stejskal-Tanner sequence with SPAIR fat suppression, using b-values of 0,50,100,300 and 600 s/mm2 (TR 3600ms, TE 89ms, 4 averages, 8mm slice thickness, matrix size 120x192, FOV 197x316mm). All subjects also underwent ‘conventional’ MRI [8] consisting of T2-weighted short inversion time inversion recovery (STIR), T1-weighted turbo spin echo (TSE) and fat-suppressed post-contrast T1-weighted TSE sequences. The conventional MRI scan was used to determine whether subjects had evidence of active inflammation; all those who did not were treated as controls.
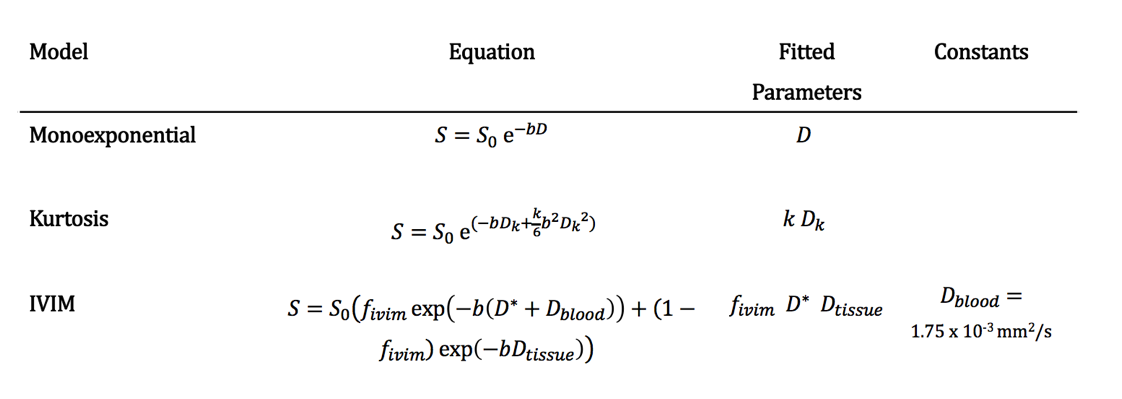
Voxels to be included in the fitting were defined by placing a region-of-interest (ROI) on the vendor-supplied ADC maps in an anatomical location corresponding to the areas of high signal (in patients) or normal marrow (in controls) on the STIR images; this ROI was automatically transferred to each of the diffusion-weighted images, and the mean signal intensity at each b-value was taken to create a single dataset for each subject. Each of the three models investigated (monoexponential, IVIM and kurtosis – see Figure 1) were then fit to the acquired data using a nonlinear least-squares solver with a trust-region fitting algorithm. For each model, we evaluated the goodness-of-fit in terms of the sum of squared errors (SSE) and the Akaike information criterion (AIC). Linear regression was performed between ADC and Dk and between ADC and Dtissue, and slope values were compared to 1 using two-sided t-tests.
Results and Discussion
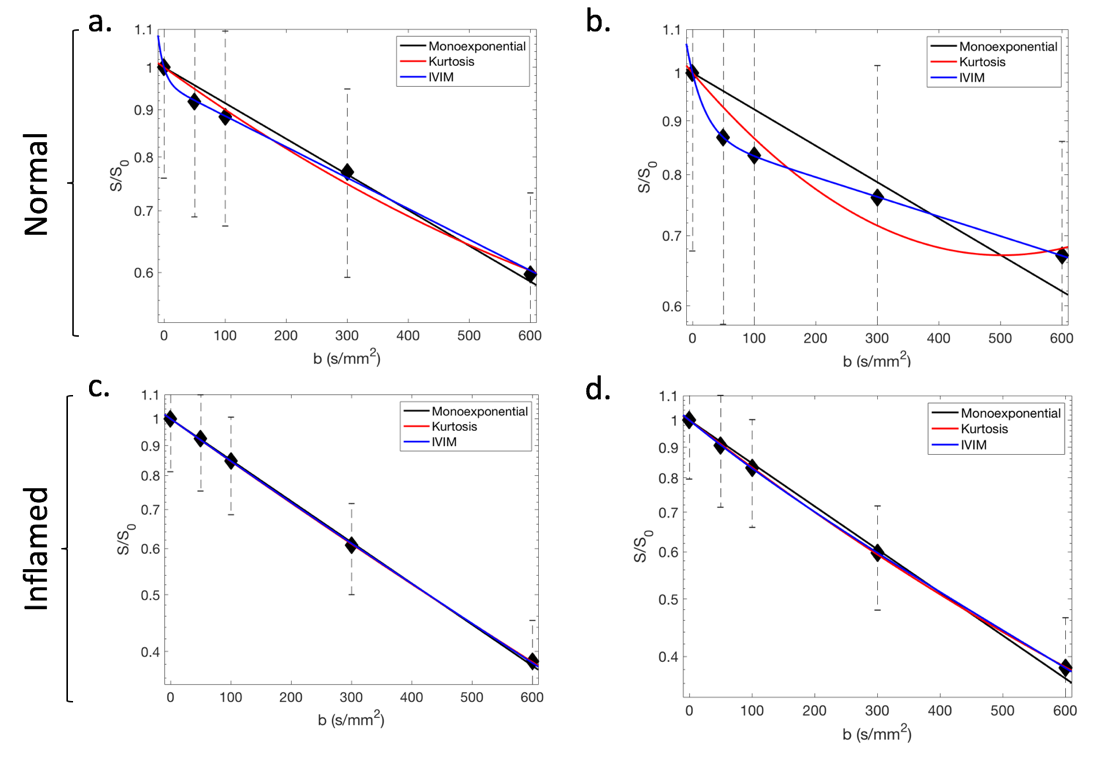
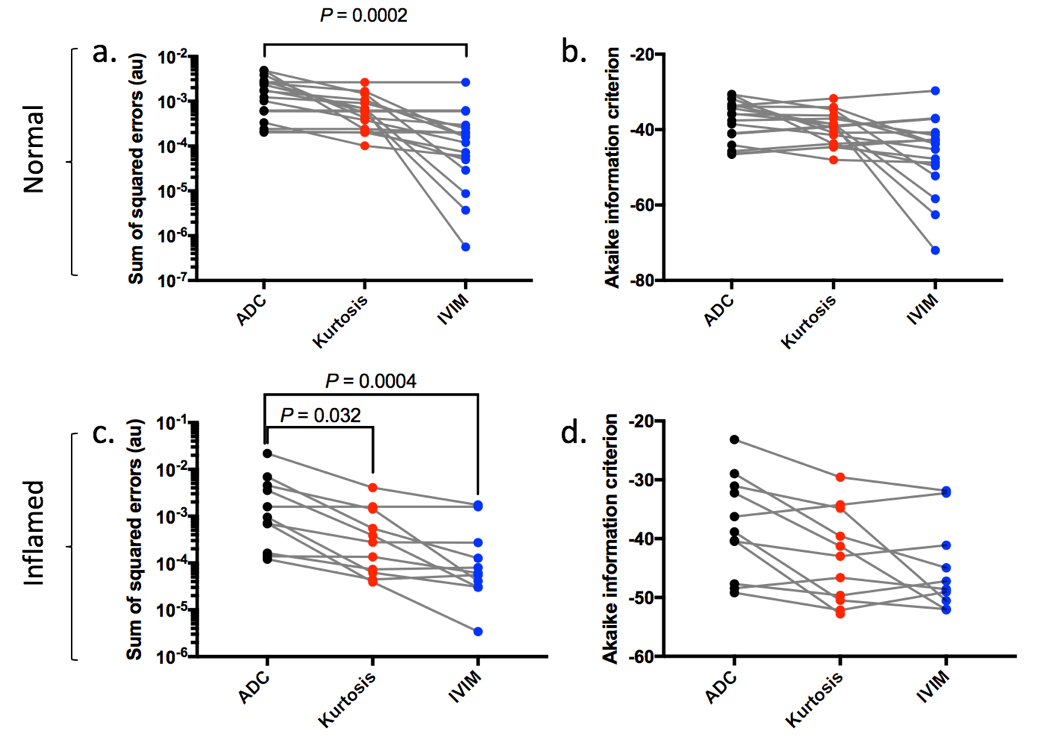
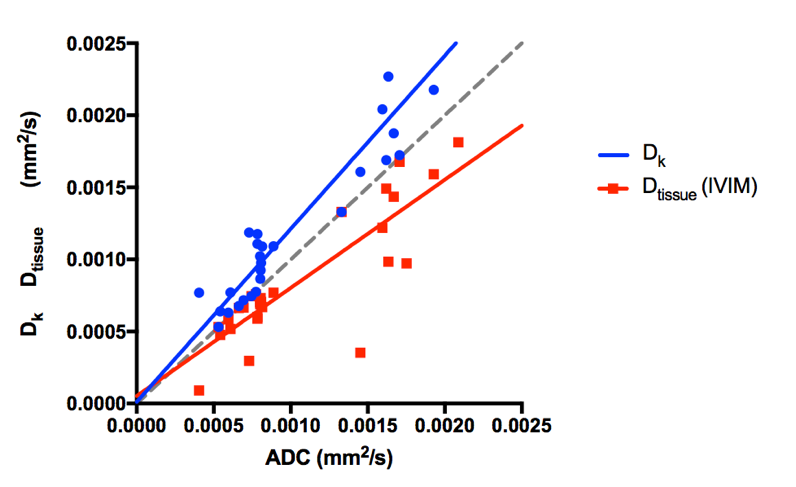
Examples of the data and fitted curves are shown in Fig 2a,b for normal marrow, and in Fig 2c,d for inflamed marrow. Fig 2b is a pronounced example of the departure from monoexponential decay in normal bone marrow: here the kurtosis model fails because it is unable to capture the early, rapid decay in addition to the slower ‘tissue’ decay at higher b-values. SSE and AIC values for each of the three models are shown in Fig 3. The IVIM model had a significantly lower error than the monoexponential model in both normal marrow (P=0.0002) and inflamed marrow (P=0.0004), whilst the kurtosis model also had a lower error than the monoexponential model in inflamed marrow (P=0.032), but not normal marrow (P=0.077). Information content was higher (i.e. AIC was lower) for the IVIM model than for the kurtosis and ADC models in both normal and inflamed marrow. Figure 4 shows the results of the linear regression analysis between ADC and Dk, and between ADC and Dtissue. Dk results in systematically higher estimates of tissue diffusivity than ADC (slope = 1.20, P=0.031), whilst Dtissue results in lower estimates than ADC (slope = 0.75, P=0.010).Conclusions
The IVIM model provides the most faithful description of the data, and is superior to both monoexponential and kurtosis models in normal and inflamed marrow. IVIM is able to capture both the rapid ‘perfusion’ component at b = 0-100 s/mm2 and the slower decay at b>100 s/mm2, whereas the kurtosis model [6,7] cannot. Future work should therefore focus on the IVIM model rather than the kurtosis model in bone marrow. Failure to model the early diffusion component (Divim) leads to an overestimation of tissue diffusivity in the order of 10-20%, particularly in health subjects, which might reduce the sensitivity and specificity with which normal and inflamed marrow can be separated.Acknowledgements
TJPB was supported by Arthritis Research UK Grant 21369. This work was undertaken at UCLH/UCL, which receives funding from the UK Department of Health’s the National Institute for Health Research (NIHR) Biomedical Research Centre (BRC) funding scheme. The views expressed in this publication are those of the authors and not necessarily those of the UK Department of Health.References
1. Gaspersic N, Sersa I, Jevtic V, Tomsic M, Praprotnik S. Monitoring ankylosing spondylitis therapy by dynamic contrast-enhanced and diffusion-weighted magnetic resonance imaging. Skeletal Radiol. 2008 Feb;37(2):123–31.
2. Bray TJP, Vendhan K, Ambrose N, Atkinson D, Punwani S, Fisher C, et al. Diffusion-weighted imaging is a sensitive biomarker of response to biologic therapy in enthesitis-related arthritis. Rheumatol (United Kingdom). 2017 Dec 19;56(3):399–407.
3. Le Bihan D. Apparent Diffusion Coefficient and Beyond: What Diffusion MR Imaging Can Tell Us about Tissue Structure. Radiology. 2013;268(2):318–22.
4. Le Bihan D, Turner R. The capillary network: a link between IVIM and classical perfusion. Magn Reson Med. 1992;27:171–8.
5. Zhao Y, Li S, Liu ZZ, Chen X, Zhao X, Hu S, et al. Detection of Active Sacroiliitis with Ankylosing Spondylitis through Intravoxel Incoherent Motion Diffusion-Weighted MR Imaging. Eur Radiol. 2015 Sep;25(9):2754–63.
6. Jensen JH, Helpern JA, Ramani A, Lu H, Kaczynski K. Diffusional kurtosis imaging: The quantification of non-Gaussian water diffusion by means of magnetic resonance imaging. Magn Reson Med. 2005;53(6):1432–40.
7. Wang F, Chu C, Zhao C, Wei Y, Zhang Q, Feng Q, et al. Diffusion kurtosis imaging in sacroiliitis to evaluate the activity of ankylosing spondylitis. J Magn Reson Imaging. 2018;
8. Sieper J, Rudwaleit M, Baraliakos X, Brandt J, Braun J, Burgos-Vargas R, et al. The Assessment of SpondyloArthritis international Society (ASAS) handbook: a guide to assess spondyloarthritis. Ann Rheum Dis. 2009;68 Suppl 2(May):ii1-44.
Figures