1360
A fully automatic and robust system for quantitative measurement of lumbar curvature1Academy for Advanced Interdisciplinary Studies, Peking University, beijing, China, 2College of Engineering, Peking University, beijing, China, 3Department of Radiology, Peking University First Hospital, beijing, China
Synopsis
The change of lumbar curvature is used as the intuitionistic reflection for nearly all lumbar spine lesions, such as low back pain. Although several automatic segmentation methods have been proposed for the lumbar spine, those techniques cannot be directly applied to the diagnosis of spinal lesions due to the lack of quantitative estimation in lumbar curvature. In this study, by using a machine learning strategy, we designed an analysis pipeline and developed a fully automated measurement system of lumbar curvature, then validated it against a dataset of 45 subjects with T2w images.
Purpose
To accurately estimate the lumbar curvature with a fully automated strategy in T2w images and design a fully automatic analysis pipeline.Introduction
As the best imaging modality for evaluating suspected lumbar disease, MRI can provide the maximum amount of information, exceptionally high-resolution, multi-axial, multi-planar views 1. However, the physicians’ visual judgment of lumbar curvature is qualitative and easily misled by the surrounding soft tissue. Abundant efforts have been taken in many previous studies to segment the lumbar vertebra automatically, but the quantitative lumbar curvature estimation based on images is lacked 2. Actually, an accurate, robust, automatic diagnostic system for lumbar curvature is desirable to reduce analysis time and increase diagnostic consistency, especially for lumbar degenerative disease and lumbar disc protrusion. In this study, we designed an analysis pipeline and developed a fully automated measurement system of lumbar curvature, then validated it against a dataset of T2w images.Data
The retrospective dataset included 45 subjects with different lumbar curvature from the hospital. Images were acquired on 3.0 T systems with a typical T2w contrast (TR: 2905 ms; TE: 90 ms; FOV: 240 mm×240 mm; matrix: 324×280; slice thickness: 4 mm with no gap).Methods
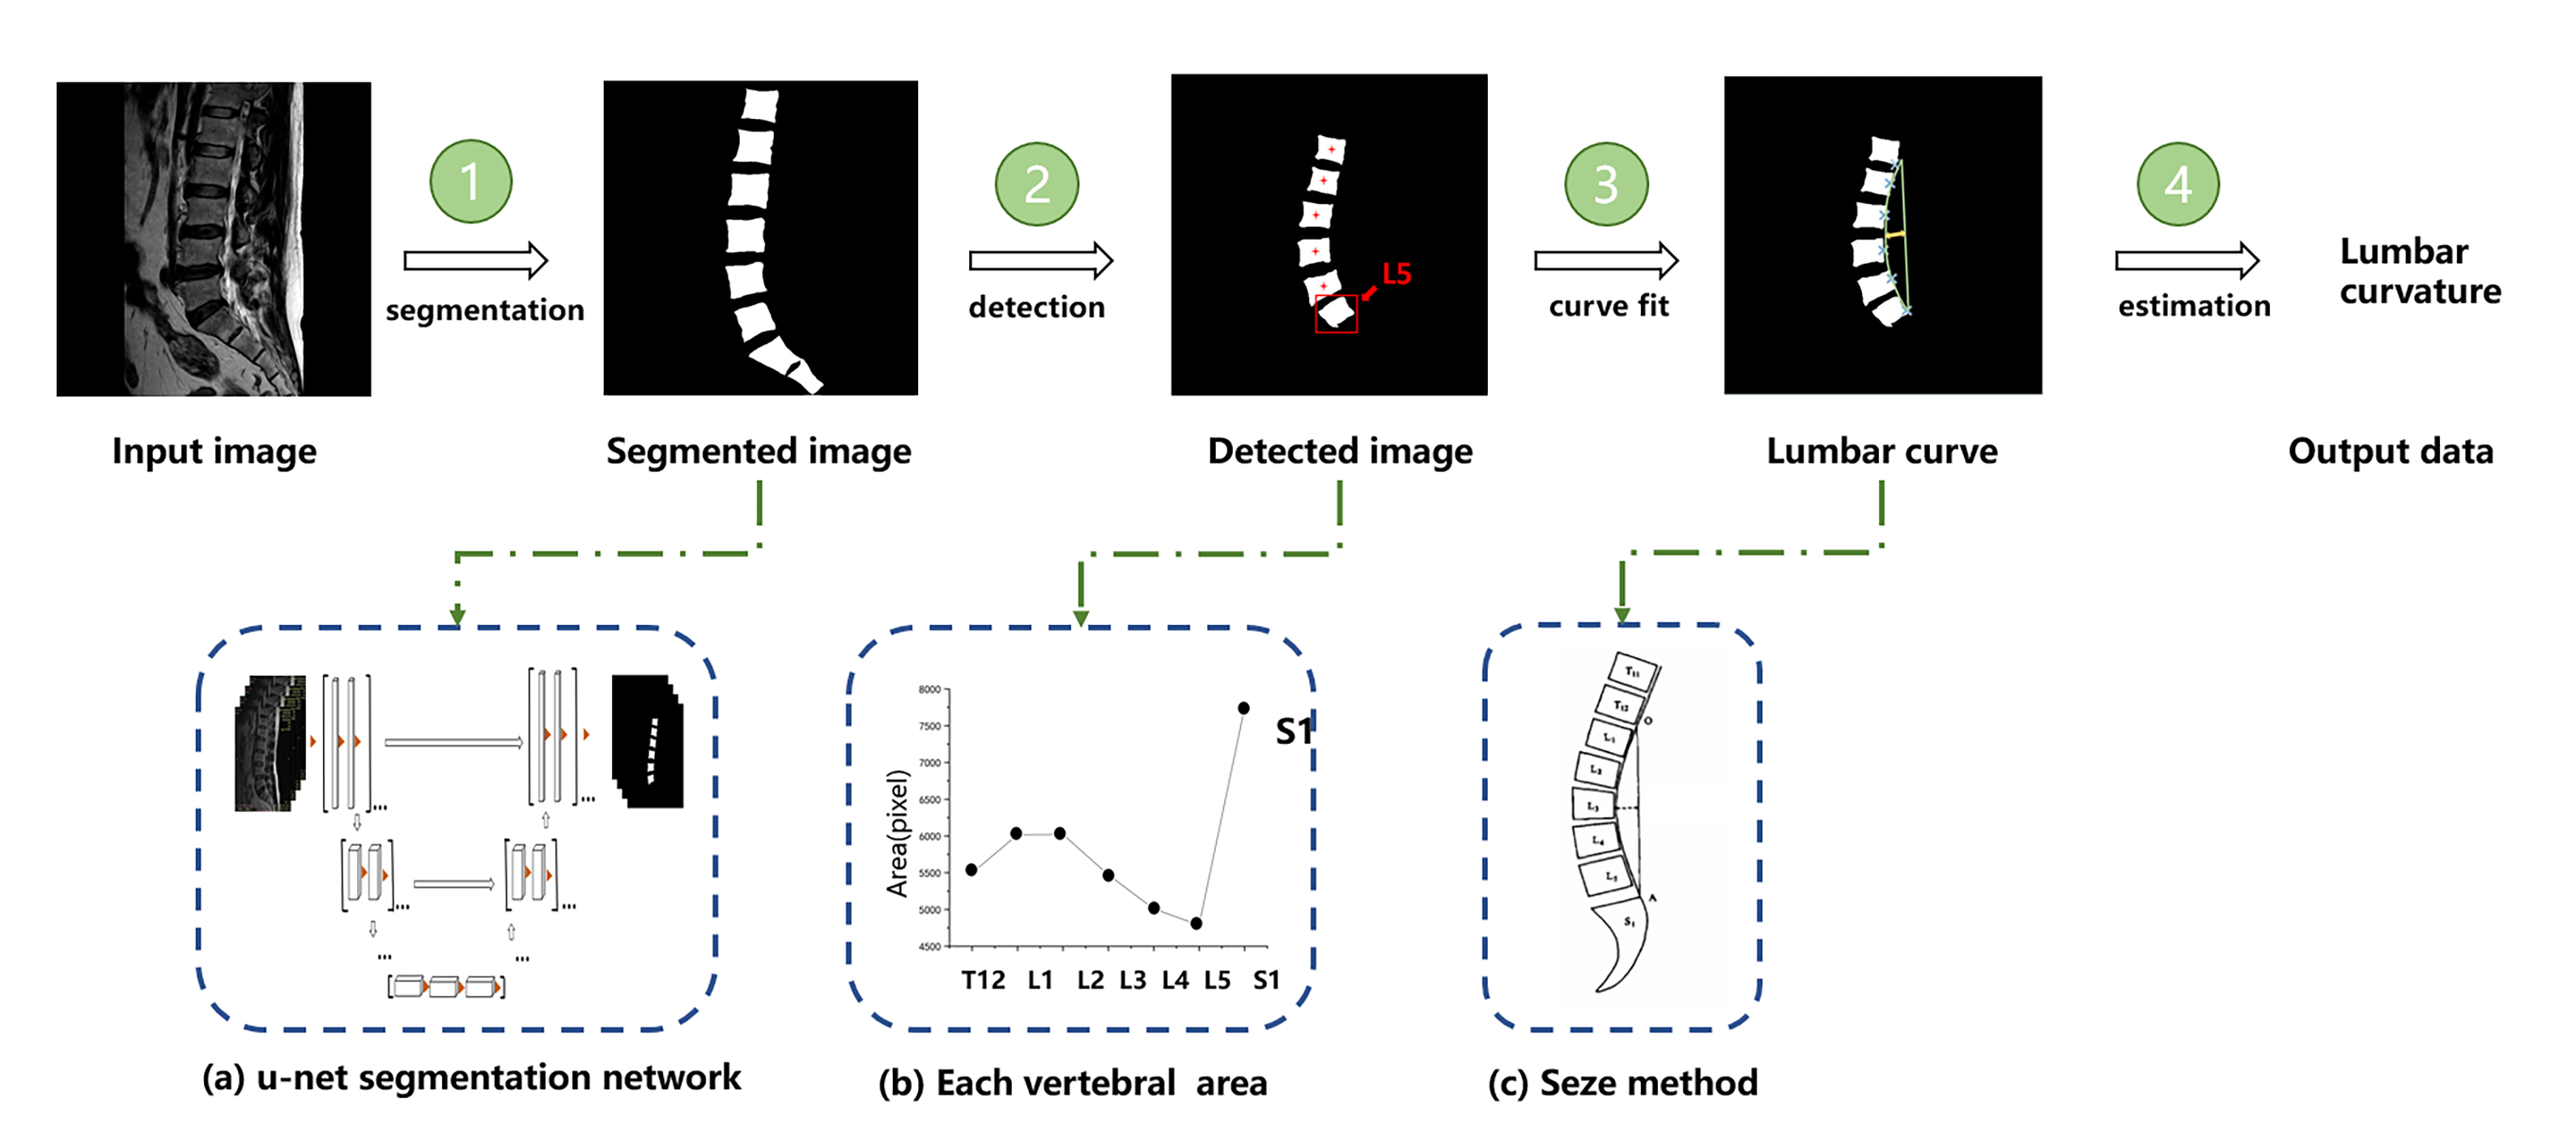
According to high-resolution MRI image, one radiologist with over 3 year’s experiences outlined contours of lumbar depending on prior knowledge. Further, the radiologist assessed the empirical curvature in lumbar vertebra as the ground truth by a conventional semi-automatic calculating method. Localization and identification of individual lumbar vertebrae require information about the spatial context. In this study, we proposed a pipeline to measure lumbar curvature as shown in Fig.1 quantitatively. Firstly, U-net network was used utilized to learn the shallow details and deep global information of the image and then separated the lumbar vertebra from the background tissue. Subsequently, as the crucial step for the whole pipeline, the connected region model was introduced to automatically locate the last lumbar vertebra L5 as the reference vertebrae, likewise, the adjacent lumbar L4-L1 could be then successively determined. Furthermore, vital geometric points of each posterior edge of the lumbar spine were automatically identified by their geometric corner feature. Finally, the lumbar curvature was assessed using the Seze method fitting quadratic curve for the critical points extracted 3, and the distance between the apex of the curve and the vertical line of the chord was considered as lumbar curvature. The lumbar curvature including 45 images was estimated according to the pipeline and experienced doctors calculated manually, respectively. All subjects were shown by a scattor Diagram and spearman correlation coefficient measured of the strength of an association between two variables.Results
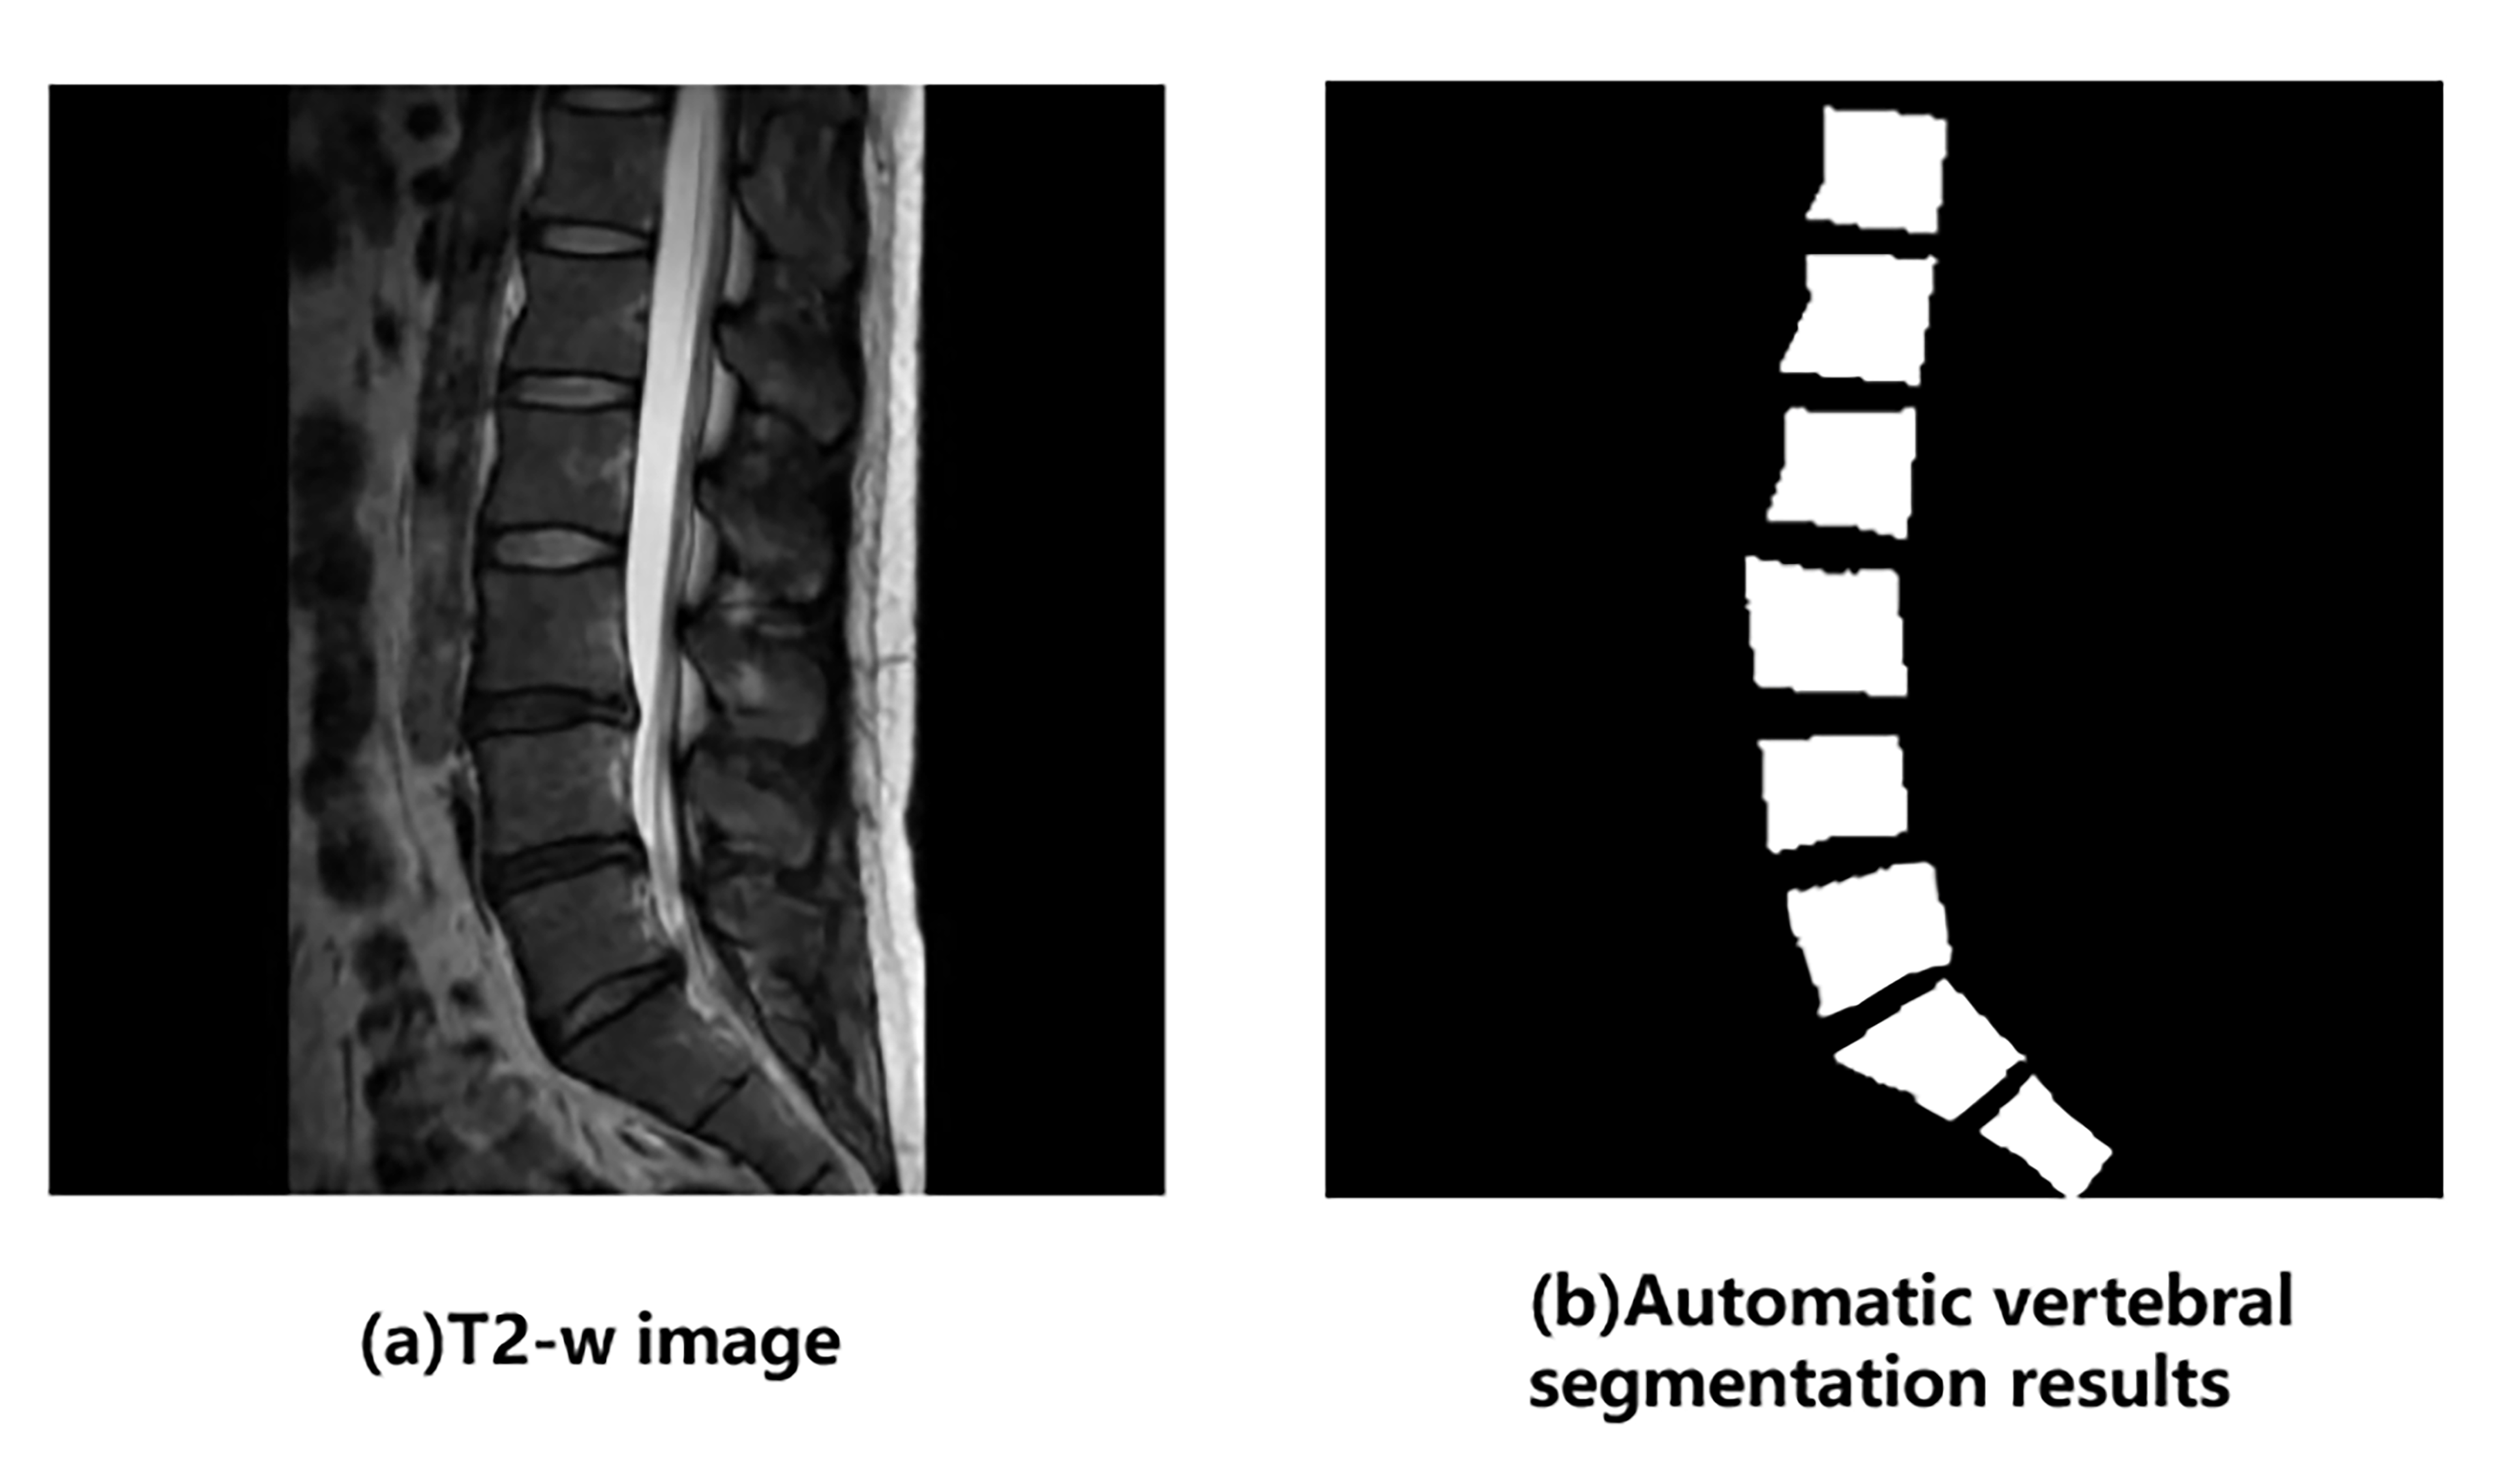
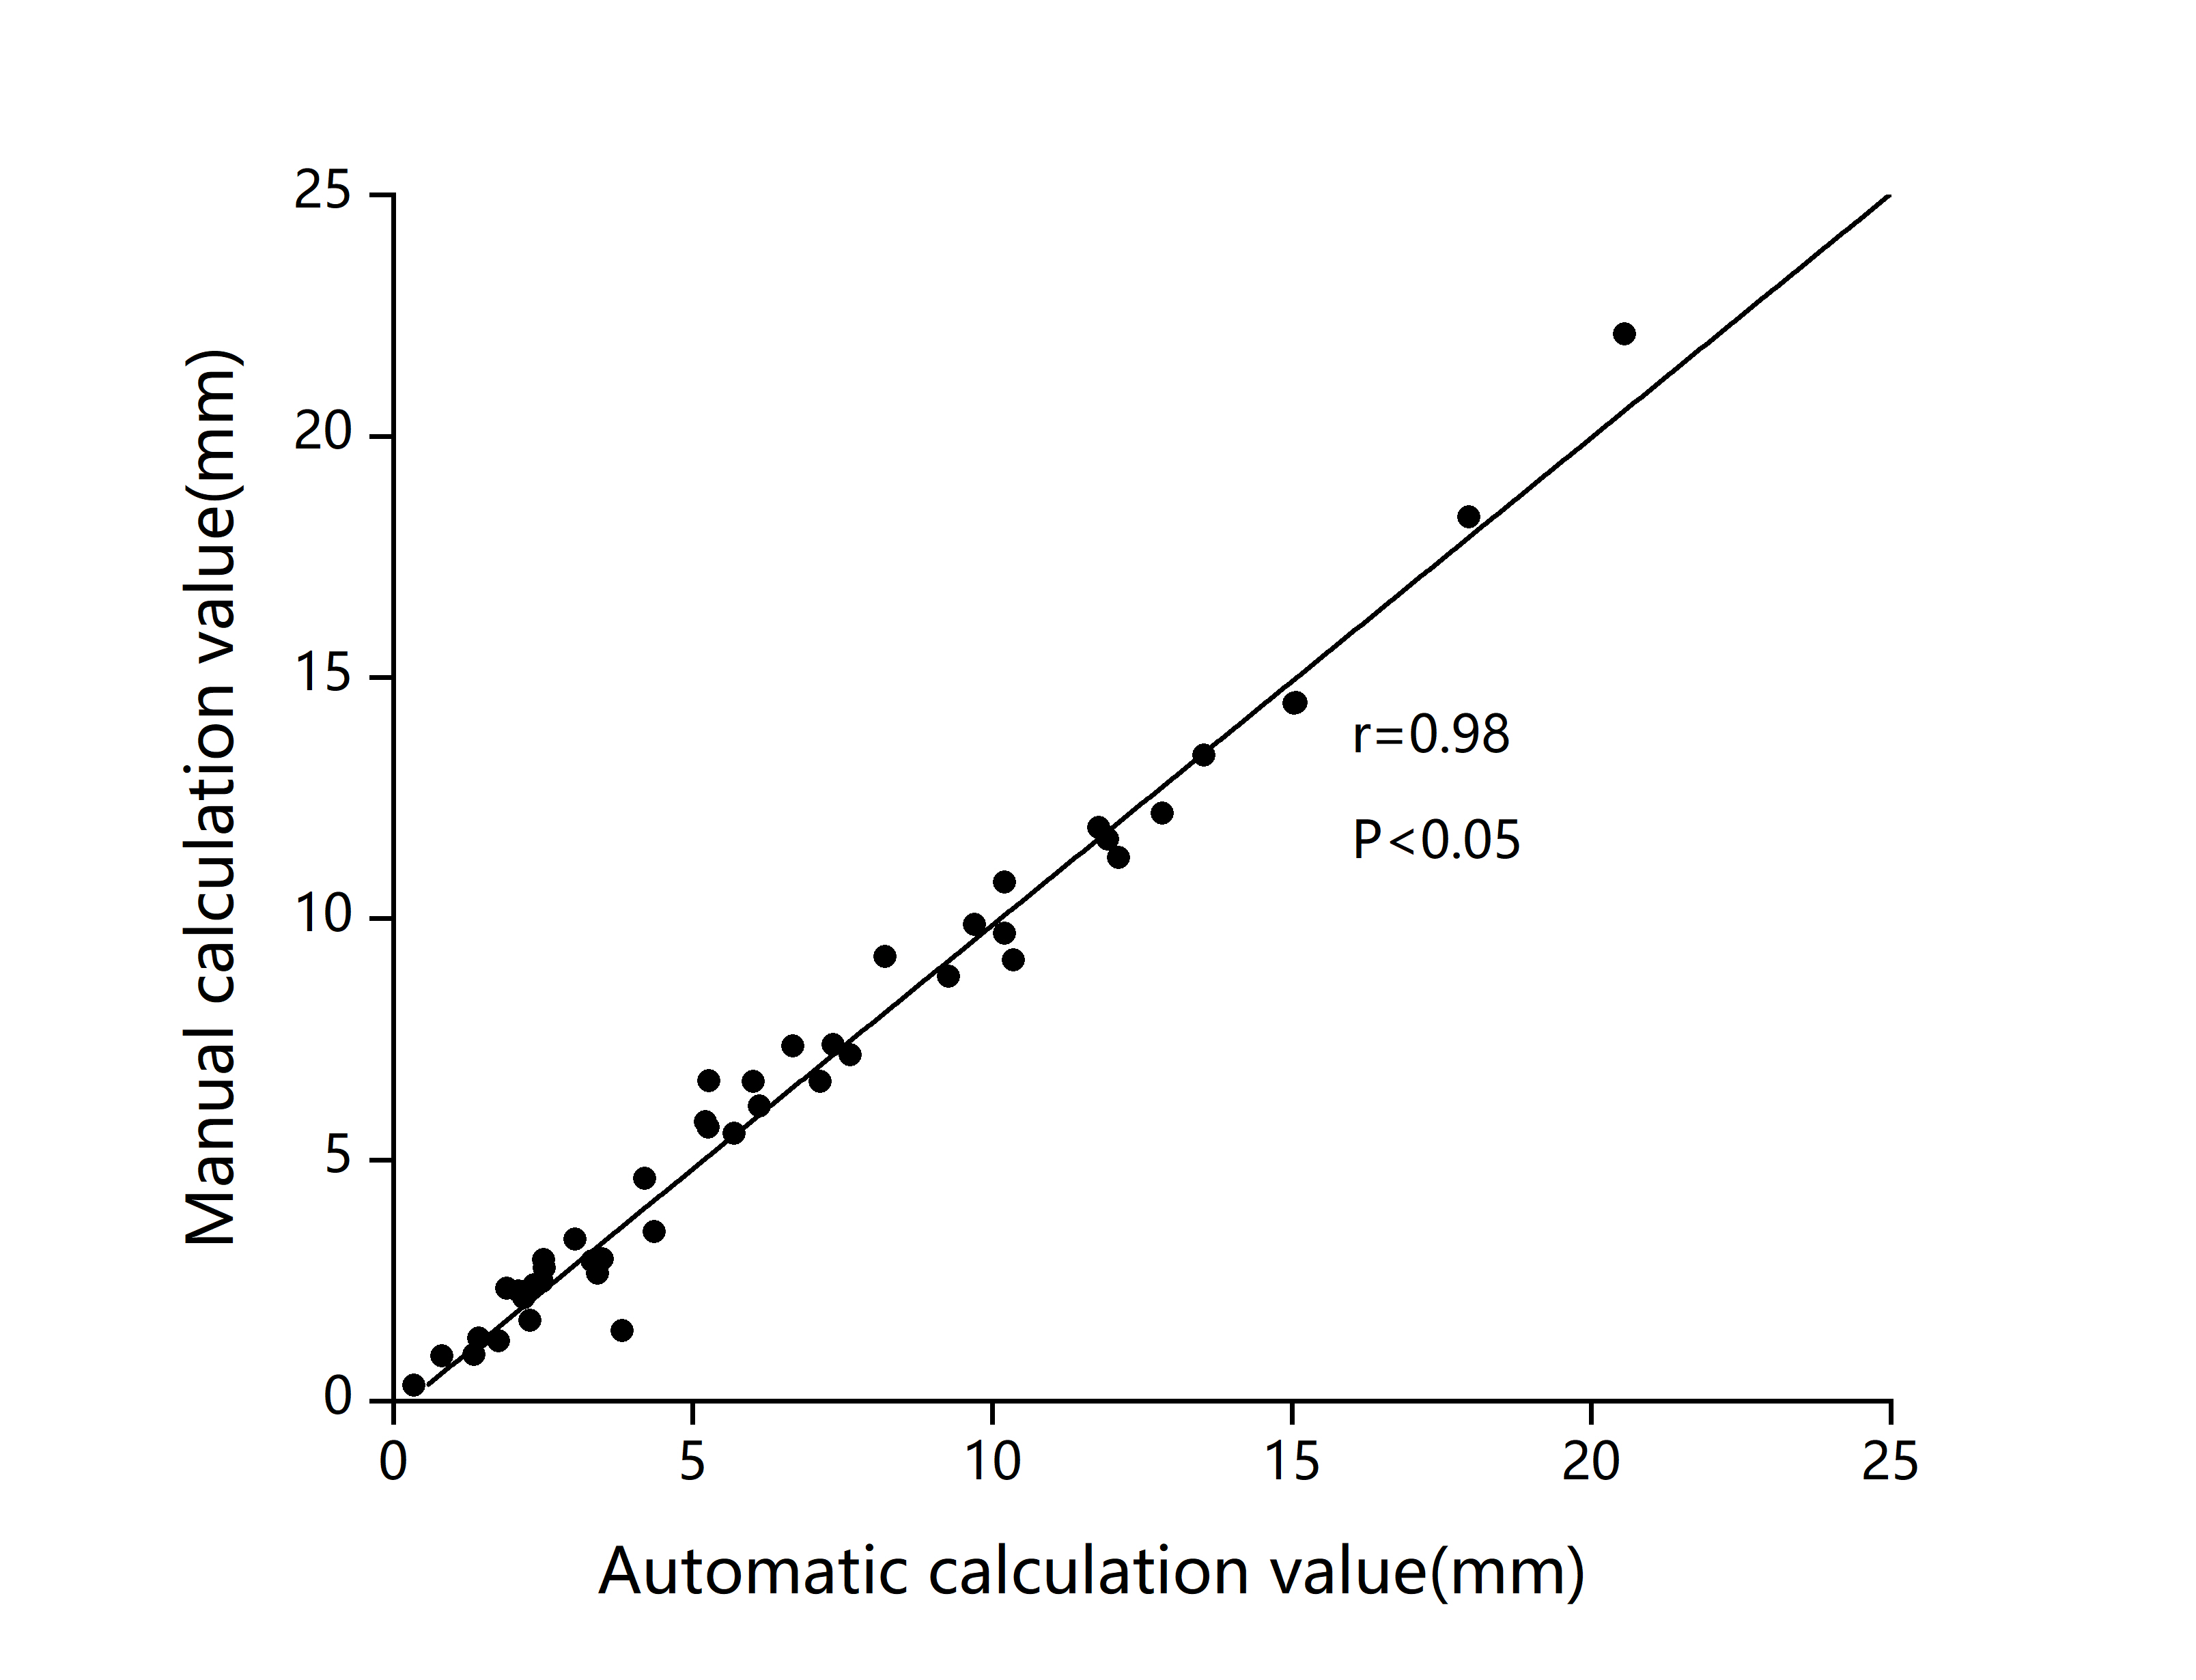
The lumbar vertebrae on the images was successfully segmented and detected using U-net and context information, as shown in Fig.2. Squared Error (MSE) of lumbar curvature between the ground truth and the estimated value is 0.74±0.33 pixel, and there exists a strong correlation between them (spearman correlation coefficient r = 0.98, p<0.01) , as illustrated in Fig.3.Discussion & conclusion
In this study, a fully automatic pipeline was proposed to estimate the lumbar curvature on T2w MR images. We conducted U-Net interfaced with a connected region model to locate the L5, and further to estimate the lumbar curvature. In fact, the location and size of MR images of the lumbar vertebra are biased due to different data sources. It is worth mentioning that the sacrum is easily identified due to its geometric feature, and L5 is therefore relatively easy to be recognized as it is over the first vertebra of the sacrum. Overall, the proposed pipeline can achieve a satisfactory accuracy for the measurement of lumbar curvature, and this strategy can provide a valuable quantitative tool for the examination in lumbar vertebrae.Acknowledgements
No acknowledgement found.References
1. Mullan CP, Kelly BE. Magnetic resonance (MR) imaging of lumbar spine: use of a shortened protocol for initial investigation of degenerative disease. Ulster Medical Journal 2005;74(1):29-32.
2. Iterative convolutional neural networks for automatic vertebra identification and segmentation in CT images. Medical Imaging 2018: Image Processing; 2018. International Society for Optics and Photonics.
3. Sheng-yun L, Letu S, Jian C, et al. Comparison of modic changes in the lumbar and cervical spine, in 3167 patients with and without spinal pain. PLoS One 2014;9(12):e114993.
Figures