1359
Quantitative comparison of conventional and synthetic MRI for cortical and trabecular bone architecture: ex vivo study of bovine coccyx1Department of Diagnostic Radiology, Hiroshima University Hospital, Hiroshima, Japan, 2Department of Radiology, Hiroshima University Hospital, Hiroshima, Japan
Synopsis
Synthetic
MRI has recently been shown to offer comparable performance to conventional
pulse sequences in the assessment of intracranial abnormalities with greater
time efficiency. We assessed the capability to predict bone architecture from
MRI by comparing T1 and T2 relaxation times calculated by conventional and synthetic
MRI and bone indices determined by micro-CT using bovine coccyx. This experimental study demonstrated that cortical
porosity was significantly correlated with the cortical bone T2 relaxation time
calculated from synthetic MRI. Synthetic MRI is feasible for assessing bone
architecture and bone quality in clinically relevant acquisition time without
radiation exposure.
INTRODUCTION
Cortical and trabecular bones contribute significantly to bone strength, and cortical porosity is known as a significant predictor of mechanical strength1. Abnormal bone architecture has also been related to increased fracture risk in patients with diabetes mellitus2. With no risk of radiation exposure, measurements of bone structural indices using MRI potentially enable assessment of cortical and trabecular bone architecture. However, this method is often limited by the relatively long acquisition time.
Synthetic MRI has recently been shown to offer comparable performance to conventional pulse sequences in the assessment of intracranial abnormalities with greater time efficiency3. The purpose of this study was to assess the capability to predict bone architecture from MRI by comparing T1 and T2 relaxation times calculated by conventional and synthetic MRI and bone indices determined by micro-CT.
METHODS
Twenty-five fresh bovine coccyges were scanned using a 3-T system (Ingenia; Philips Healthcare) equipped with a dStream Wrist 8-channel coil. T1 measurement was conducted using standard IR at 7 TIs=[100, 300, 500, 1000, 3000, 4000, 5000], TR=6 s, with in-plane resolution=1.7×1.2mm, and section thickness=5 mm. T2 measurement was conducted using standard SE at 10 TEs=[20, 40, 60, 80, 100, 140, 180, 220, 260, 300], TR=3 s, with in-plane resolution=0.8×0.8mm. For the acquisition of synthetic MRI data, we used an axially oriented multiple-dynamic multiple-echo (MDME) sequence4 with TR=6 s, two echo times of 13 and 100 ms, flip angle=90°, in-plane resolution=0.6×0.6mm, section thickness=5 mm, and acquisition time=4.5 min.
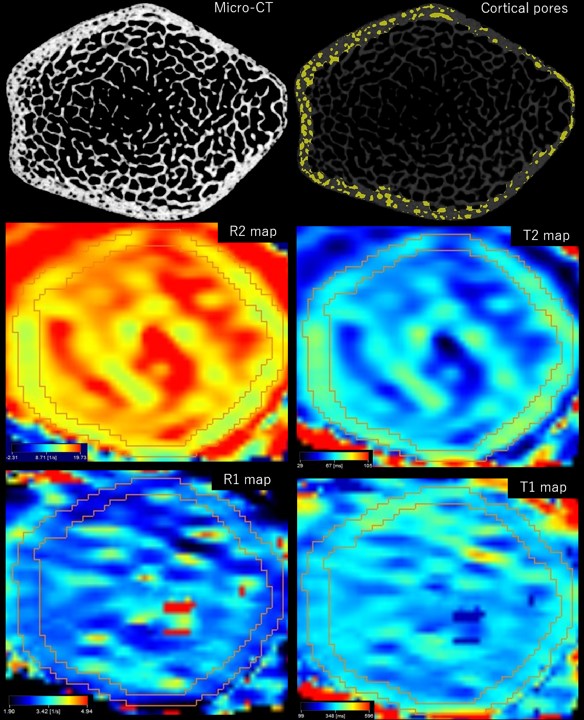
Acquired data were used to generate quantitative T1, T2, R1, and R2 maps using commercially available software (SyMRI NEURO, version 8.0.4; SyntheticMR AB). T1 and T2 relaxation times, and R1 and R2 values on synthetic MRI maps were obtained (Figure 1) using ring-shaped regions of interest (ROIs) for cortical bone (CB) and round ROIs for bone marrow (BM) space which has trabecular bone.
Bovine coccyges were also scanned by micro-CT (SkyScan1176, Toyo Corporation). Reconstructed voxel size was 17.5×17.5×17.5 µm. Indices of cortical and trabecular bone architecture including cortical porosity (Ct.Po, %), cortical volumetric bone mineral density (mg/cm3), trabecular volumetric BMD (vBMD, mg/cm3), connectivity density (Conn.D, 1/mm3) and trabecular number (Tb.N, 1/mm) for the same 5-mm-thick portion with the MRI experiment were calculated.
Differences in T1 and T2 relaxation time between conventional and synthetic MRI were tested using the Mann-Whitney U test. Relationships between MRI- and micro-CT-derived bone indices were compared using Spearman’s correlation coefficient.
RESULTS
Cortical bone T1-, T2-, and BM T2 relaxation times were significantly longer for synthetic MRI compared to conventional MRI (Table 1).
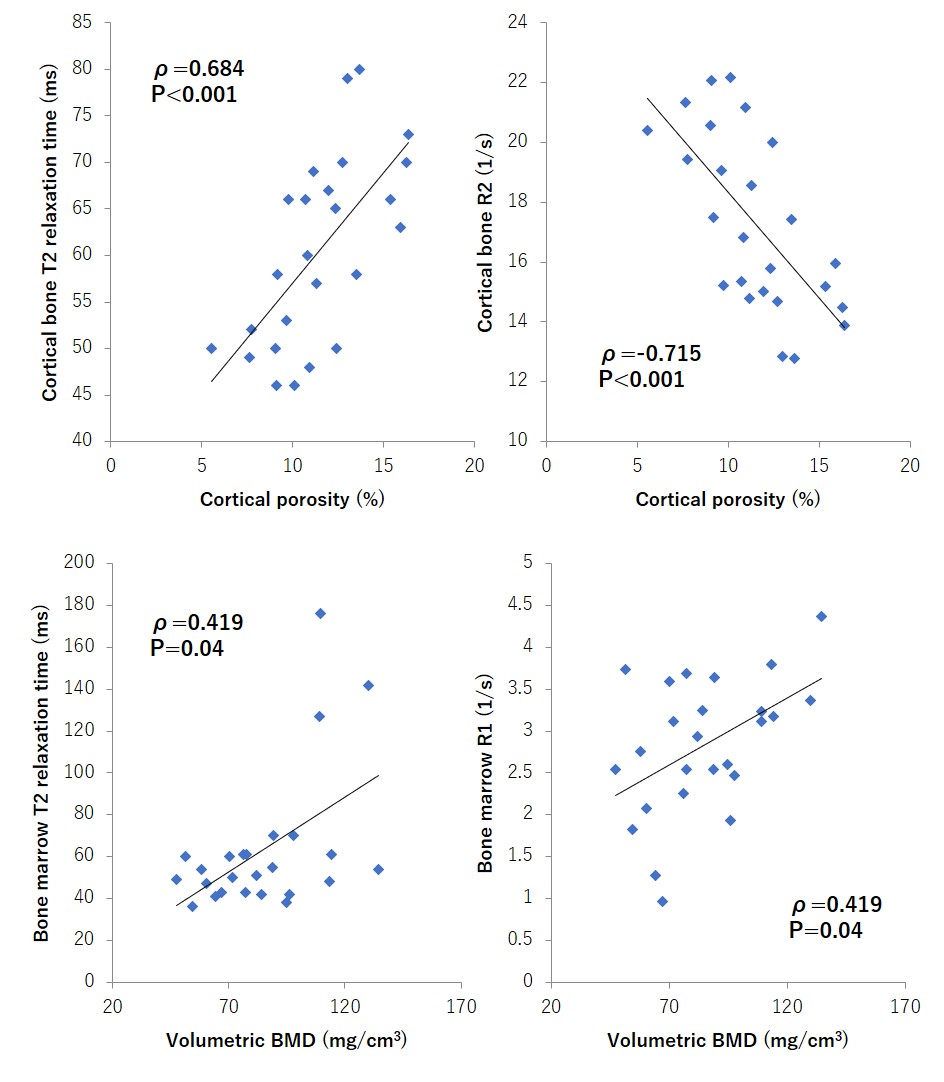
Spearman’s correlation showed significant correlations between Ct.Po and cortical bone T2 relaxation time and R2 calculated from synthetic MRI mapping (ρ=0.684, p<0.001; ρ=-0.715, p<0.001, respectively; Table 2, Figure 2). Modest correlations were found between vBMD and BM T2 relaxation time and R1 calculated from synthetic MRI (ρ=0.419, p=0.04; ρ=0.419, p=0.04, respectively). Indices for bone quality such as Tb.N and Conn.D showed weak correlations with BM T2 relaxation time and R1 calculated from synthetic MRI (p=0.04).
No significant correlations were evident between any micro-CT-derived indices or conventional MRI measurements.
DISCUSSION
In this study, cortical porosity correlated significantly with the CB T2 relaxation time calculated from synthetic MRI, but not from measurement by conventional MRI. For synthetic MRI, we used the MDME sequence with relatively short acquisition time, which uses a repeat version of the same gradient reversal process to create two consecutive gradient echoes after a single radiofrequency pulse. In contrast, T1 or T2 measurements by conventional MRI, which need a long acquisition time, may be prone to errors due to regional variations in the signal-to-noise ratio caused by B0-field inhomogeneity.
Volumetric BMD and indices of trabecular bone structure demonstrated only modest correlations with T2 relaxation time and R1 calculated from synthetic MRI. The BM, which contains trabecular bone, various kinds of cells, adipose tissue, or blood vessels, is highly heterogeneous, which may lead to greater sampling error in MR images than in CB MR images.
CONCLUSION
This experimental study demonstrated that cortical porosity was significantly correlated with the CB T2 relaxation time calculated from synthetic MRI. No significant correlations were evident between measures from conventional MRI and micro-CT-derived reference values. Synthetic MRI is feasible for assessing bone architecture and bone quality in clinically relevant acquisition time without radiation exposure.Acknowledgements
References
1. Wachter NJ, Augat P, Krischak GD, et al. Prediction of strength of cortical bone in vitro by microcomputed tomography. Clin Biomech. 2001;16(3):252–256.
2. Farr JN, Khosla S. Determinants of bone strength and quality in diabetes mellitus in humans. Bone. 2016;82:28-34.
3. Hagiwara A, Warntjes M, Hori M, et al. SyMRI of the Brain: Rapid Quantification of Relaxation Rates and Proton Density, With Synthetic MRI, Automatic Brain Segmentation, and Myelin Measurement. Invest Radiol. 2017;52(10):647-657.
4. Blystad I, Warntjes J, Smedby O, et al. Synthetic MRI of the brain in a clinical setting. Acta Radiol. 2012;53:1158–1163.
Figures
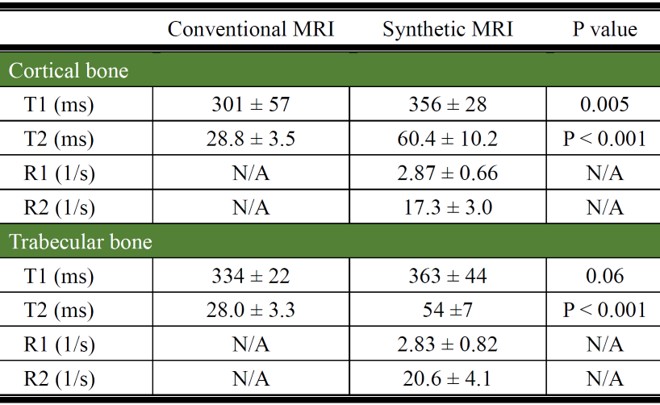
Quantitative conventional and synthetic MRI data.
Note. Values represent mean ± standard deviation or standard error; N/A, Not Applicable.
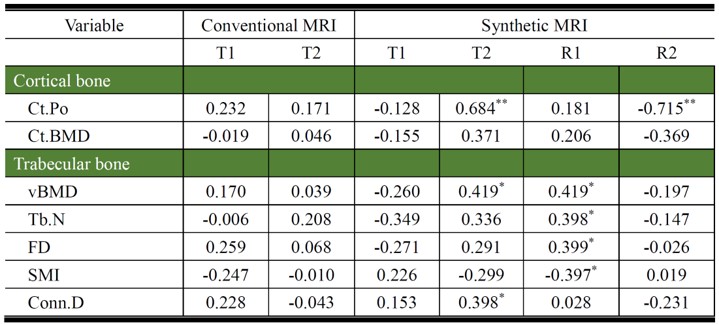
Correlation coefficients of bone indices between conventional and synthetic MRI.
Note. Ct.Po, cortical porosity; Ct.BMD, cortical BMD; vBMD, volumetric BMD; Tb.N, trabecular number; FD, fractal dimension; SMI, structure model index; Conn.D, connectivity density.
*P < 0.05. **P < 0.001.