1357
Evaluation of local changes in femoral bone marrow during a mountain ultra-marathon with quantitative MRI1Univ Lyon, UJM-Saint-Etienne, INSA-Lyon, Université Claude Bernard Lyon 1, CNRS, Inserm, CREATIS UMR 5220, U1206, F-42023, Saint-Etienne, France, 2Univ Lyon, INSA‐Lyon, Université Claude Bernard Lyon 1, UJM-Saint Etienne, CNRS, Inserm, CREATIS UMR 5220, U1206, F-69621, Villeurbanne, France, 3Department of Radiology, Centre Hospitalier Universitaire de Saint-Etienne, Université Jean-Monnet, Saint-Etienne, France
Synopsis
This study investigates the local changes in femoral bone marrow in a longitudinal MRI dataset of mountain ultra-marathon runners acquired during the Tor des Géants 2014 based on the MRI quantitative metrics with a rigorous statistical analysis procedure. The results highlight the different characteristics of different quantitative metrics that provides multiple insights into the data and open various perspectives for further analysis.
Introduction
Mountain ultra-marathon (MUM) is well known to be an outstanding model for the study of adaptive responses to extreme load and stress1. MUM is a prolonged physical activity in extreme conditions leading to a whole-body inflammation process with accumulation of fluid, leukocytes and inflammatory mediators2,3. According to Spiropoulos et al.4, this exercise-induced inflammation has also been suspected to modulate bone marrow homeostasis leading to a decrease in erythroid compartment. Our objective was to evaluate, with quantitative MR images, the local variations in the femoral bone marrow of experienced athletes during one of the world’s most challenging MUM.Methods
Our data included 3D Water images (2-points Dixon, 640 axial slices) MR images collected from 20 finishers from the Tor Des Géants MUM 2014 (D+24000, 330km), as well as derived quantitative maps5 of T2* and χ for all 3 acquisition time points (Pre - baseline before the race, Post - at the finish line and Post+3 - 48h after the race).
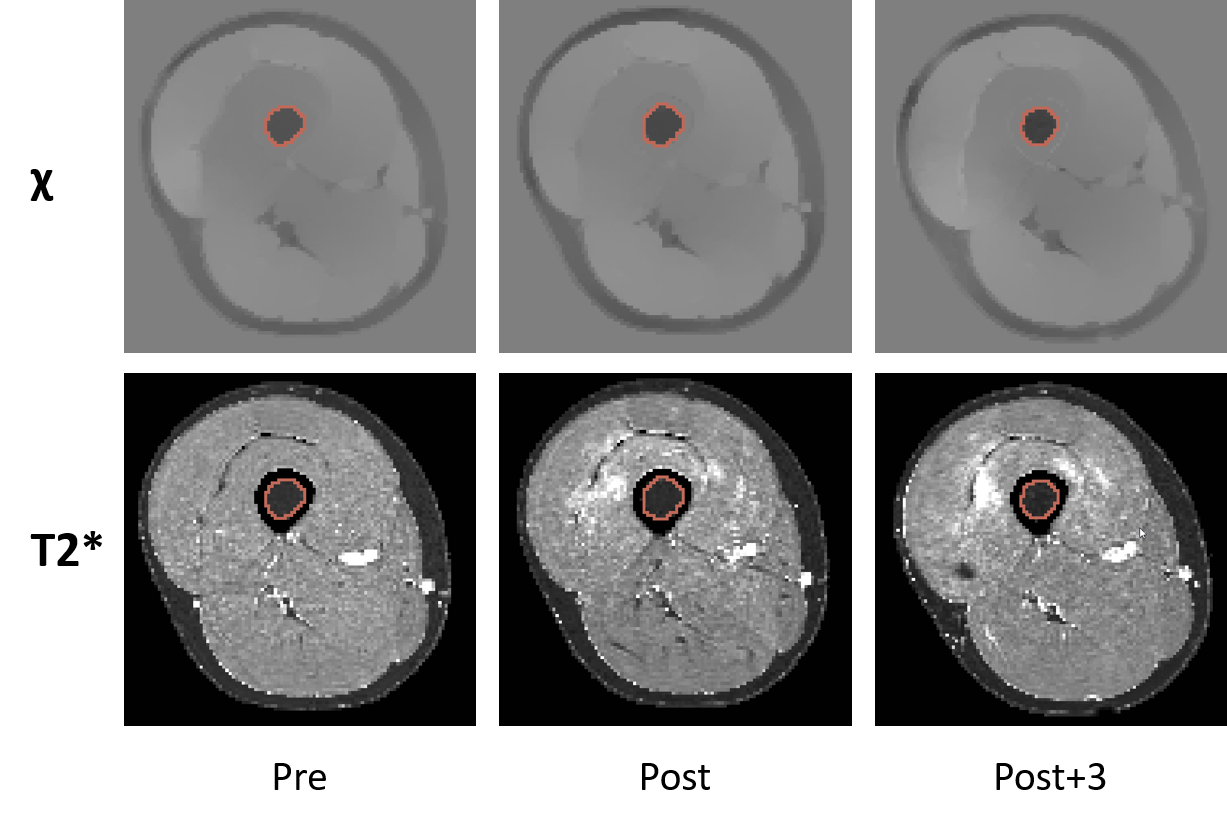
Based on the automatic segmentation of femur6, we applied an automatic segmentation refinement process to extract the exact segmentation of the bone marrow (Figure 1) on both legs of each runner. In order to monitor the longitudinal changes in the femoral bone marrow, we used our final segmentation to extract statistical data from the quantitative maps, and then we performed a rigorous statistical test procedure to identify significant difference among the three-time points. The significance level was set at P ≤ .05 for all the statistical tests with the null hypothesis is that the mean values of the observed data are the same among time points. Depend on the normality of the data, we employed either repeated measures ANOVA or Friedman test for global effect test, dependent t-test or Wilcoxon signed-rank test for pairwise tests. The P-values obtained for pairwise tests were adjusted with the Bonferroni method for multiple comparisons.
Results & Discussion
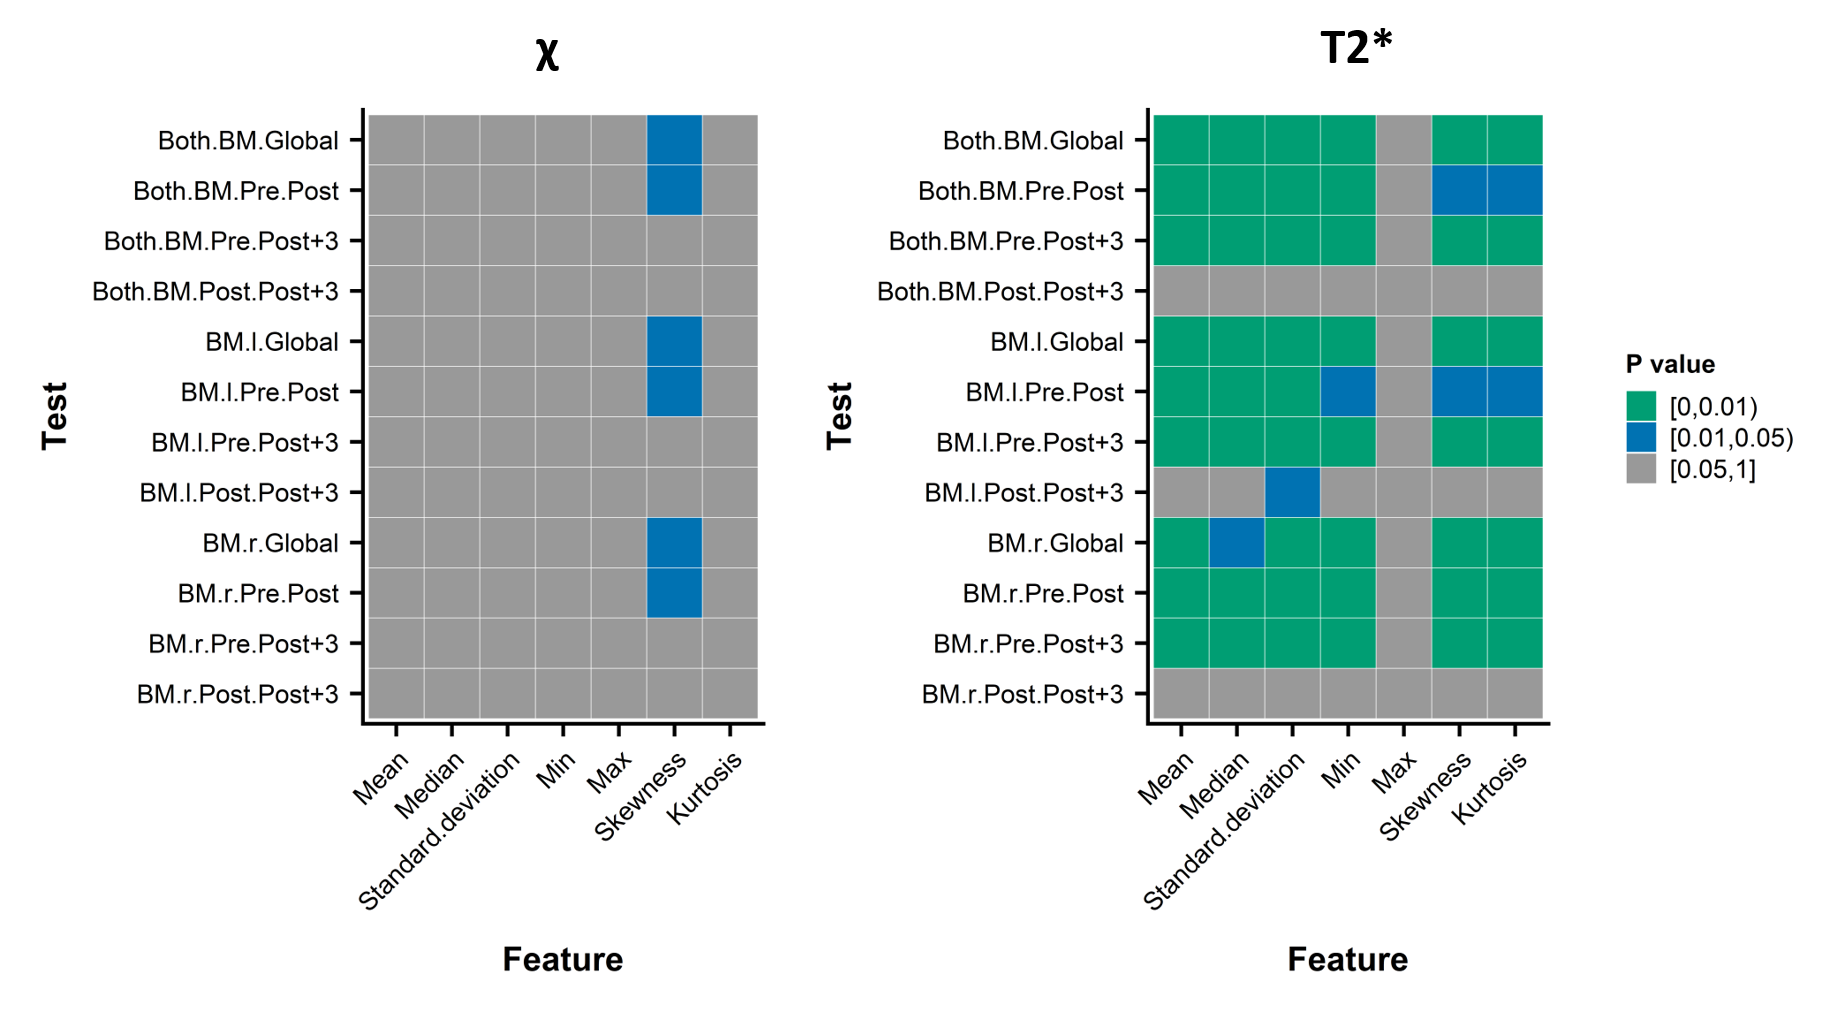
The statistical tests (Figure 2) showed a statistically significant time effect on most of the image features of T2* (6/7 features) with significant differences between Pre and Post and between Pre and Post+3, which implied that the time of 2 days was not enough for the bone marrow to return to its initial state. In the meantime, for the χ quantitative maps, only the histogram’s skewness displayed statistically significant longitudinal changes.
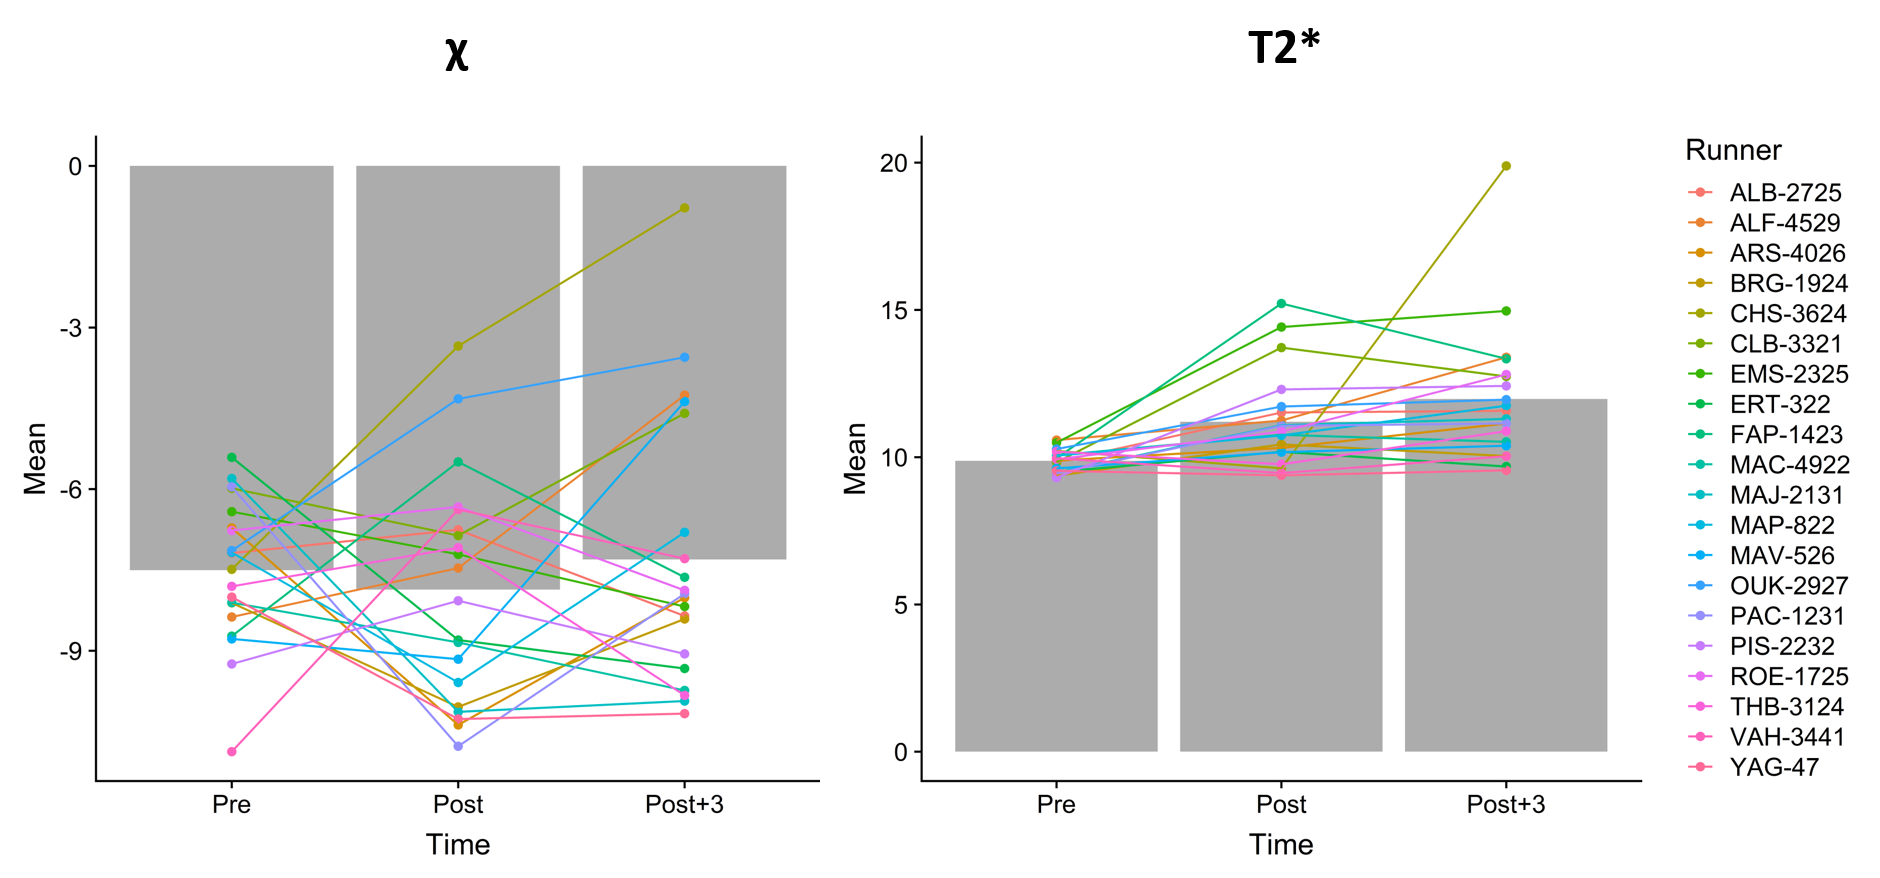
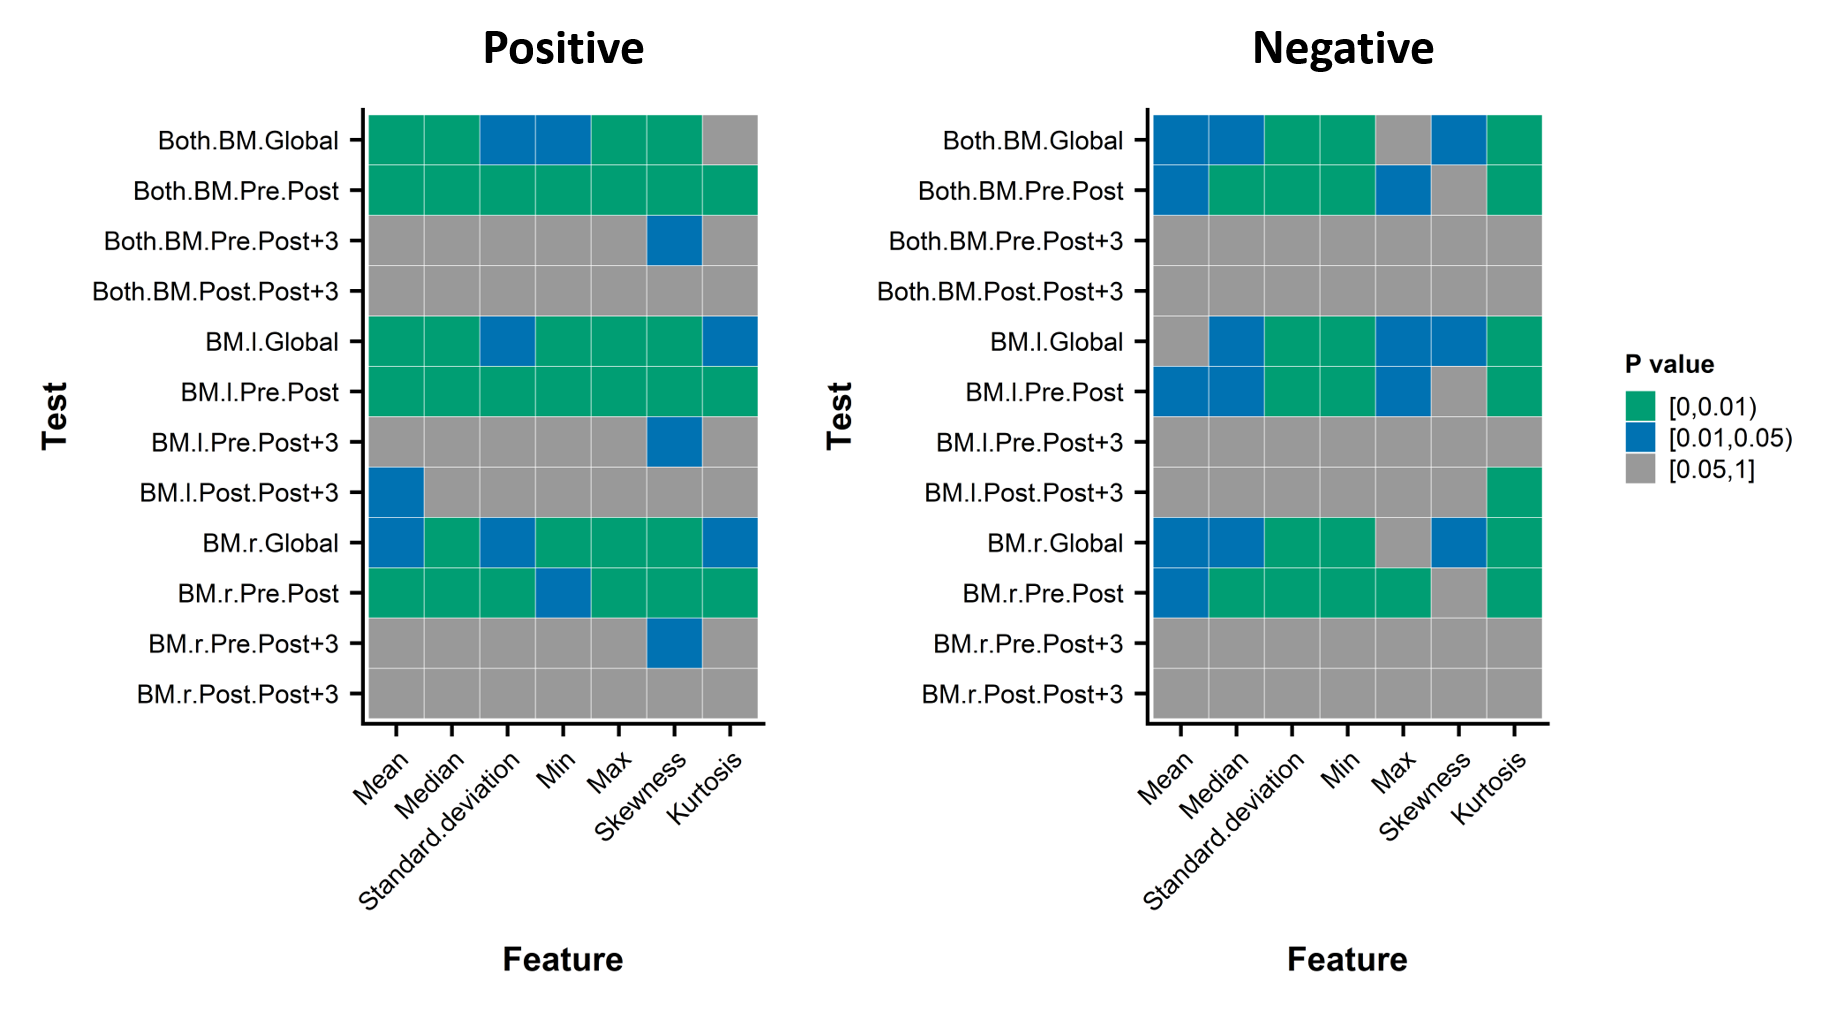
Looking closer to the data (Figure 3), we discovered that the T2* of all the runners share similar longitudinal patterns with relatively small inter-individual variation while we observed very different behaviors in the data of χ. Therefore, we split the set of runners into two categories: one with positive variation during the race (between Pre and Post) and one with negative variation. For both categories, the results displayed significant global time effect with a statistically significant difference between Pre and Post, which indicates that there were at least two different populations among our runners with different biological response to the race (Figure 4). The change in χ could be related to the changes in the concentration of red/white blood cells in the bone marrow. Spiropoulos et al.4 also stated that the different exercise conditions and lengths could lead to either the increase or the decrease of the amount of red blood cells. While our runners were all experienced, they have a wide age range and large morphological difference, which might explain the variation in behaviors of the bone marrow.
Conclusion
We studied the femoral bone marrow variation of MUM runners with the help of two types of MRI quantitative maps (T2* and χ). T2* highlighted statistically significant time effect for most of the statistical tests meaning an ineligible change in the water concentration in the bone marrow of runners. Furthermore, χ maps revealed two populations with different behaviors in the bone marrow after the race. This suggests that the T2* metric can provide a global view to the dataset while the χ metric is more sensitive to the variation among the subjects.
Further analysis is in process while taking in to account biological makers, more advanced feature extracted from MR images and intra-individual variations among runners.
Acknowledgements
No acknowledgement found.References
1. Millet GP, Millet GY. Ultramarathon is an outstanding model for the study of adaptive responses to extreme load and stress. BMC Med. 2012;10(1):1-3. doi:10.1186/1741-7015-10-77.
2. Gabay C, Kushner I. Acute-Phase Proteins and Other Systemic Responses to Inflammation. N Engl J Med. 1999. doi:10.1056/NEJM199902113400607.
3. Wright TM. Cytokines in acute and chronic inflammation. Front Biosci. 1997. doi:10.2741/A171.
4. Spiropoulos A, Goussetis E, Margeli A, et al. Effect of inflammation induced by prolonged exercise on circulating erythroid progenitors and markers of erythropoiesis. Clin Chem Lab Med. 2010. doi:10.1515/CCLM.2010.034.
5. Leporq B, Le Troter A, Le Fur Y, et al. Combined quantification of fatty infiltration, T 1-relaxation times and T 2*-relaxation times in normal-appearing skeletal muscle of controls and dystrophic patients. Magn Reson Mater Physics, Biol Med. 2017;30(4):407-415. doi:10.1007/s10334-017-0616-1.
6. Gilles B, De Bourguignon C, Croisille P, et al. Automatic segmentation for volume quantification of quadriceps muscle head: a longitudinal study in athletes enrolled in extreme mountain ultra-marathon. In: ISMRM: International Society for Magnetic Resonance in Medicine. ; 2016.
Figures