1353
High resolution assessment of intramuscular fat content in the calf using T2-weighted MRI1Department of Radiology and Imaging Sciences, University of Utah School of Medicine, Salt Lake City, UT, United States, 2Verily Life Sciences, Cambridge, MA, United States
Synopsis
Intramuscular fat is an important indicator of the health of the lower extremities. It can be difficult with conventional Dixon techniques to acquire high resolution fat-fraction maps, which may be helpful for detailed analysis of the muscle tissue. We propose to use a linear model to generate a high resolution fat-fraction map from high resolution T2-weighted images. The results show that the proposed method and the conventional Dixon method have good agreement. The high resolution fat fraction maps generated with the proposed method reveal anatomic details of intramuscular fat not visible with the conventional method.
Introduction
Fat infiltration in the calf reflects the overall health and performance of the lower extremities in patients with muscular dystrophy1. With magnetic resonance imaging (MRI), intramuscular fat has been traditionally assessed using Dixon methods, which enable voxel-wise mapping of fat fraction2. However, spatial resolution of Dixon images is often limited due to the echo spacing required to obtain both in-phase and out-of-phase signals2, which poses a challenge for studies monitoring long-term changes in voxel-wise fat fraction, e.g., before and after exercise therapy. High-resolution T2-weighted imaging is routinely performed in most clinical MRI exams3. In this study, we aim to explore the relationship between intramuscular fat fraction and T2, and propose a regression method for estimating intramuscular fat fraction from T2-weighted images.Methods
MRI data acquisition
In this IRB-approved study, 10 datasets from different axial calf slices were acquired from an obese volunteer (female, age: 54 years, BMI: 36) with significant fat infiltration of the calf muscles. Each dataset consisted of a two-point Dixon acquisition and a multi-echo T2-weighted acquisition centered on the same slice. Imaging was performed using a 3T clinical scanner (Prismafit; Siemens) with an 8-channel receiver coil. Conventional two-point Dixon MRI was performed using a gradient echo sequence: TR 4.12ms, TE 1.23, 2.46ms, flip angle 9°, FOV 140×346mm, resolution 1.35×1.35mm, slice thickness 3mm. From each Dixon acquisition, a fat-fraction map ($$$FF_{Dix}$$$) was calculated using the fat-only and water-only images. High-resolution two-dimensional T2-weighted images were acquired using a turbo spin-echo sequence: TR 1000ms, TE 12, 81, 151ms, flip angle 180°, FOV 140×346mm, resolution 0.34x0.34mm, slice thickness 3mm. Each series of T2-weighted images was fit voxel-wise to an exponential-decay function to generate a T2 map. This imaging procedure was repeated on 5 different axial slices of the left and right calf.
Linear regression between intramuscular fat fraction and T2
For each dataset, the voxel-wise T2 map was first normalized using the T2 of subcutaneous fat. A linear relationship was proposed to characterize the normalized T2 and its corresponding fat fraction:
$$FF_{T2} = a*T_2+b$$
where a and b are the slope and intercept of the regression line. We chose a linear model based on a previously-reported linear correlation between T2 and fat fraction4. Optimal values for a and b were determined using one acquired dataset, by minimizing the mean difference between $$$FF_{Dix}$$$ and $$$FF_{T2}$$$. The optimized regression equation was then used to derive $$$FF_{T2}$$$ maps from the T2 map of the other 9 datasets, which were compared to the corresponding $$$FF_{Dix}$$$ for assessment.
Results
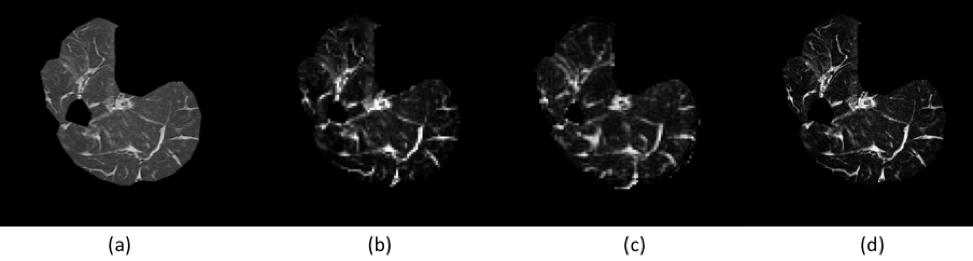
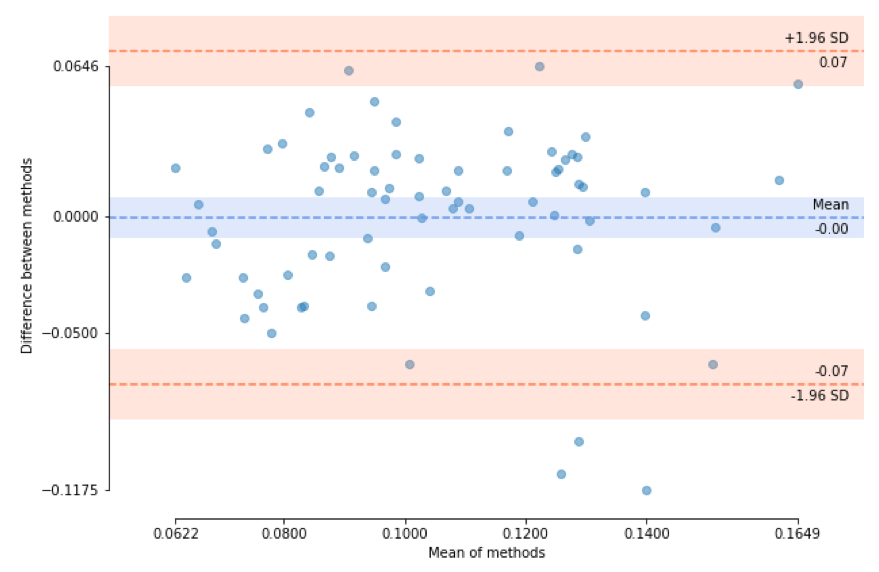
We obtained the optimal regression equation $$$FF_{T2} = 1.626*T_2-0.407$$$ based on one acquired dataset. Figure 1 shows representative $$$FF_{T2}$$$ and $$$FF_{Dix}$$$ maps. Across the 9 testing datasets, the mean difference between $$$FF_{T2}$$$ and $$$FF_{Dix}$$$ was -3.2%±8.5%. The Pearson’s correlation between $$$FF_{T2}$$$ and $$$FF_{Dix}$$$ was 0.80 (P<0.01). Figure 2 shows the agreement between the two fat-fraction estimates for 7 calf-muscle groups (medial and lateral gastrocnemius, soleus, posterior and anterior tibialis, peroneus, and extensor digitalis) of the 9 testing datasets.Discussion
The proposed T2-regression method produced comparable estimates of intramuscular fat fraction as the two-point Dixon method. One advantage of the proposed T2-regression method is its high resolution and artifact-free map, which reveals fine structures and enables precise monitoring of intramuscular fat (Figure 1). In future work, we will improve the regression relationship by identifying and incorporating other biomarkers, explore advanced software packages for visualizing three-dimensional fat-fraction maps, and apply our method to study musculoskeletal disease.Acknowledgements
This work was supported by the grant of National Institutes of Health.References
1. Lovitt S, Moore SL, Marden FA. The use of MRI in the evaluation of myopathy. Clin Neurophysiol. 2006;117(3):486-495.
2. Grimm A, Meyer H, Nickel MD, et al. Evaluation of 2-point, 3-point, and 6-point Dixon magnetic resonance imaging with flexible echo timing for muscle fat quantification. Eur J Radiol. 2018;103:57-64.
3. Diaz-Manera J, Llauger J, Gallardo E, Illa I. Muscle MRI in muscular dystrophies. Acta myologica : myopathies and cardiomyopathies : official journal of the Mediterranean Society of Myology. 2015;34(2-3):95-108.
4. Gloor M, Fasler S, Fischmann A, et al. Quantification of fat infiltration in oculopharyngeal muscular dystrophy: comparison of three MR imaging methods. Journal of magnetic resonance imaging. 2011;33(1):203-210.
Figures