1350
Longitudinal evaluation of myofiber microstructural changes in an ALS model using MR Cytography1Barrow Neurological Institute, Phoenix, AZ, United States
Synopsis
Amyotrophic lateral sclerosis (ALS) is a fatal upper and lower motor neuron degradation disease that leads to progressive myofiber abnormalities (e.g. decreased size and distribution). With recently FDA-cleared treatments, it is critical to identify non-invasive biomarkers of early disease onset, progression and therapy response. In this study, we validate the potential of a recently developed MR Cytography approach to detect myofiber microstructural changes in an ALS mouse model over three time points by comparison to relevant histologic markers.
Introduction:
Previously published simulations and in vivo validation in brain tumors1 demonstrated the potential of interrogating cellular features using a susceptibility contrast agent-based imaging approach termed Magnetic Resonance Cytography (MRC). In particular, the MRC-derived biomarker, “tissue transverse relaxivity at tracer equilibrium” (TRATE) was found to be highly sensitive to cellular size, density, geometry, and heterogeneity. Our goal was to demonstrate the feasibility of TRATE to detect myofiber degeneration during early disease onset and longitudinal progression in a mouse model of amyotrophic lateral sclerosis (ALS).Methods:
This study was approved by our institutional animal use and care committee. Eight SODG93A ALS mice and eight wild-type control mice were each imaged at three time points: 9 weeks (TP1), 12 weeks (TP2), and 15 weeks (TP3). The mice were anesthetized during imaging. At 23 weeks (TP4), histology was collected. Histology analysis included immunofluorescence and H&E staining for cell area calculations and morphologic assessments. Specifically, individual myofiber area and minimum feret diameter were measured in the gastrocnemius muscle.
Imaging Protocol: MR imaging was performed on a preclinical 7T system (Bruker, Massachusetts, USA) using a Tx/Rx volume coil. Pre-contrast T1 measurements were acquired using a variable TR sequence. Relevant scan parameters: TR= 350/500/1000/1500/3000/5000 ms, TE=11 ms, flip=90°, and 2x2x1.5 mm3 spatial resolution. Dynamic contrast-enhanced MR imaging was performed using a gradient-echo sampling of free induction decay and echo (GESFIDE) sequence with an injection of 0.2 mM/kg gadobutrol (diluted to 0.1mM) at 1 mL/min roughly 8-9 min after the start of the scan via a tail-vein catheterization. The multi-echo GESFIDE sequence consisted of 4 gradient echoes, 3 asymmetric echoes, and 1 spin echo. Relevant scan parameters: TE1/TEΔ/TE8=2.4/1.96/23.7 ms, TR=350 ms, flip=90°, 3.1x3.1x1.5 mm3 spatial resolution, and 33 sec time frames (40 dynamics) over a total scan length of 22 minutes.
Analysis: Pre-contrast T1 measurements were fit voxel-wise with a least-squares-curve algorithm to the equation: S = M0 x [1 - exp(-TR/T1)]. From the GESFIDE data, ΔR1(t) and ΔR2*(t) curves were computed and averaged over a manually segmented region-of-interest in the lateral gastrocnemius. Signal time curves from TE1 were used for computation of ΔR1(t) and converted to concentration time curves, C(t), based on the steps outlined by QIBA DCE profile2. Signal time curves from TE1 and TE4 were used to compute ΔR2* time curves using the dual-echo equation: ΔR2*(t) = [1/(TE4-TE1)] x ln [(STE1(t)/ STE4(t)) x (STE4(t=0)/ STE1(t=0))]. Finally, TRATE was computed by averaging the last 5 dynamics of the ΔR2*(t)/C(t). One-way analysis of variance (ANOVA) statistical tests were done to assess TRATE measurements over time. Student’s t-tests were done to assess histology results between the two mice populations.
Results and Discussion:
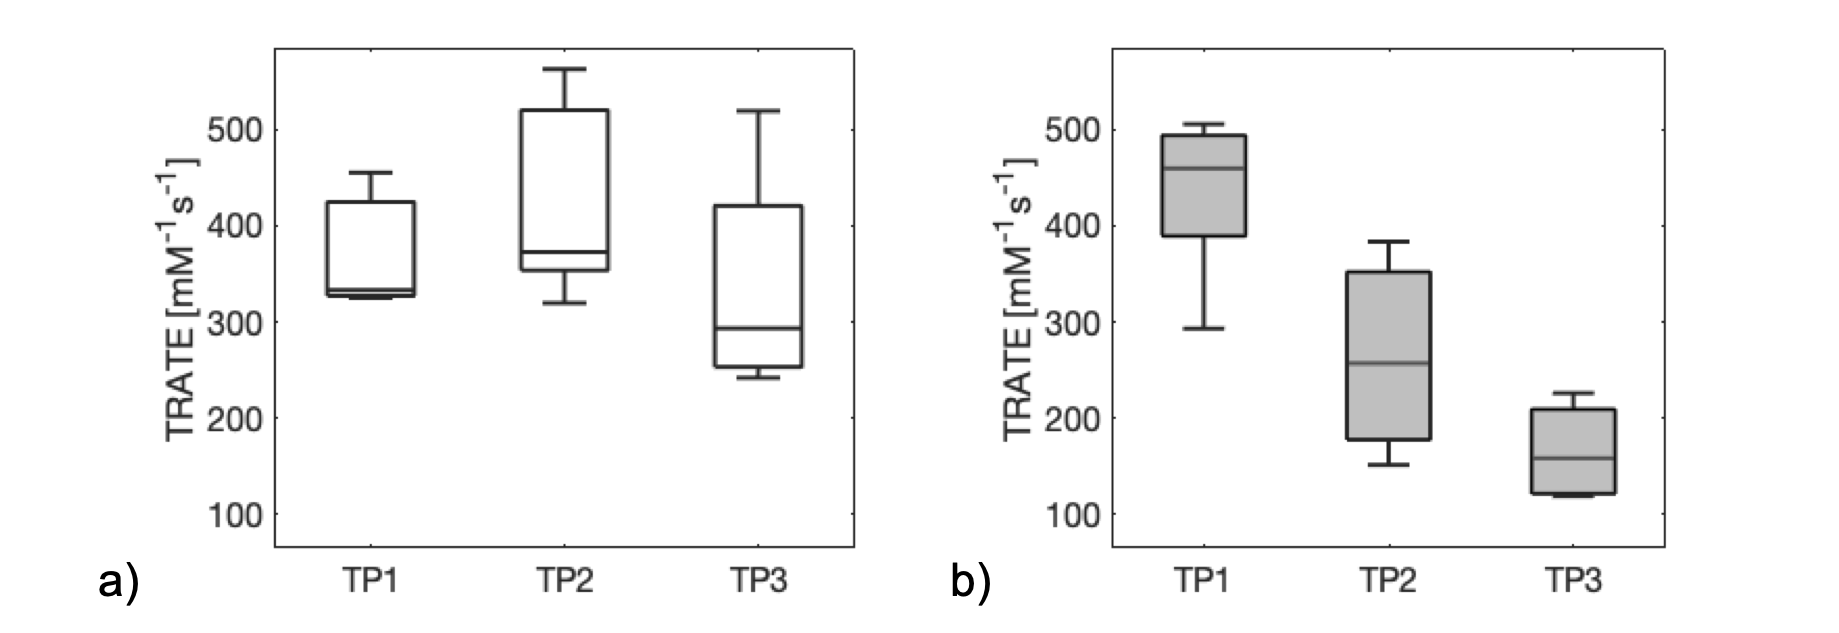
Unfortunately, due to both technical failure and premature death, we were not able to compute TRATE for all mice at all timepoints. In the end, we computed TRATE for ncontrol = 3, 5, and 4 control mice, and nALS = 5, 3, and 4 ALS mice, respectively over the three time points.
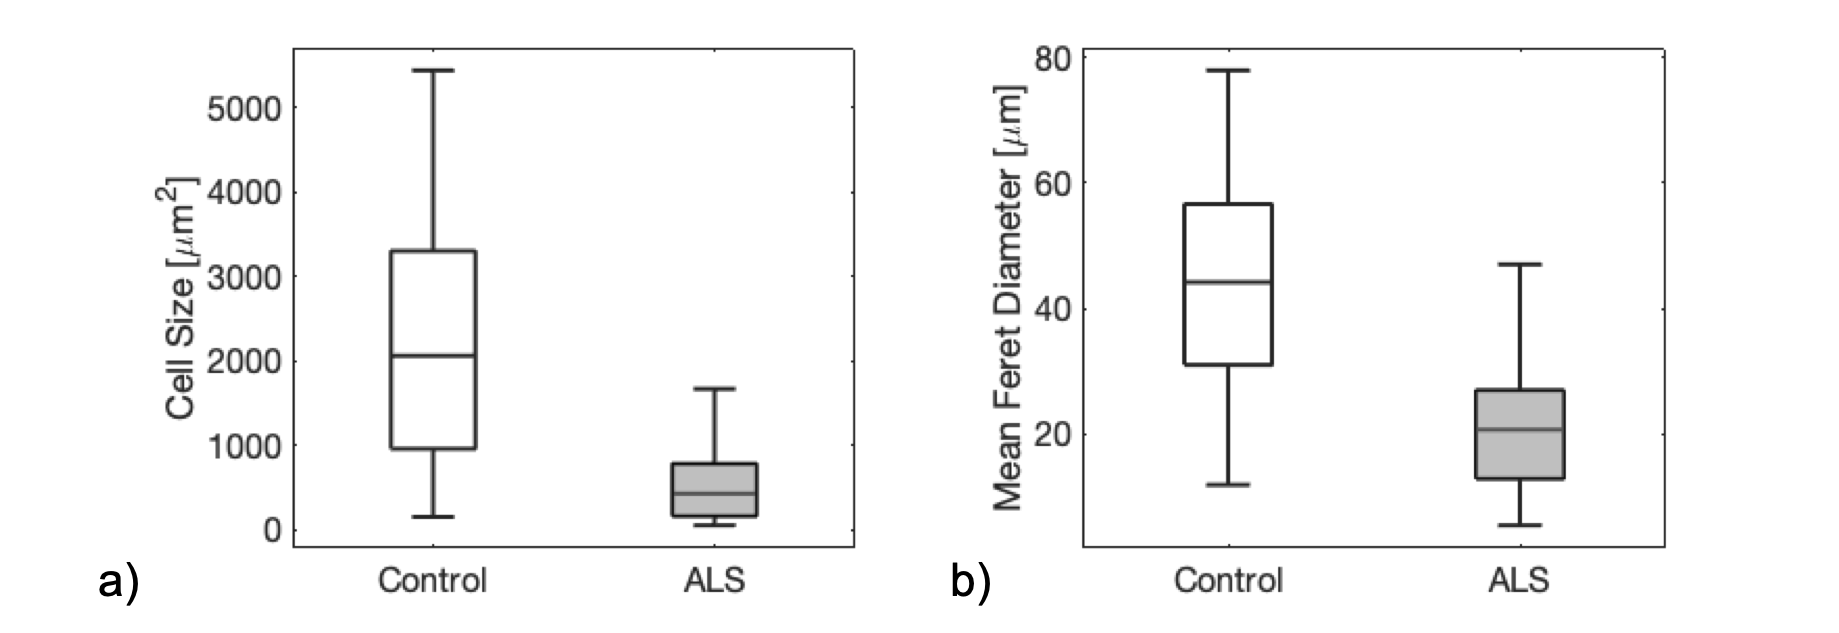
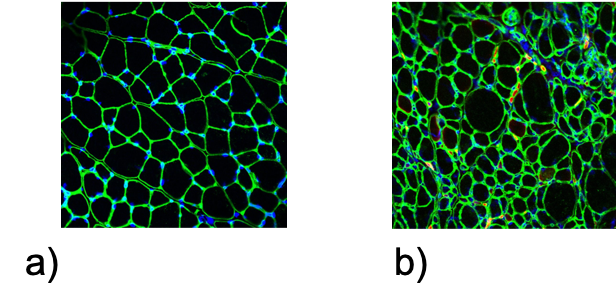
Figure 1 is a boxplot of the mean TRATE values for each dataset at each time point for the control (Fig 1a) and ALS (Fig 1b) population. As expected, TRATE values did not change over time for the control population (p-value = 0.483). In the ALS mice, the TRATE values decreased (p-value = 0.003) with disease onset and progression. These MRC results closely matched the corresponding histology. Consistent with previous simulations1, Figure 2 shows the decrease in TRATE most likely originates from the decrease in cell area (p-value = 1.34E-16) and minimum feret diameter (p-value = 3.38E-21) as determined from quantitative immunohistochemistry. Figure 3 highlights a representative example of the immunofluorescence of the gastrocnemius samples in a control and ALS mouse at TP4.
Conclusion:
Results of this study confirm that TRATE can longitudinally differentiate atrophy afflicted from healthy muscle in an ALS mouse model. Given the relative ease of acquiring multi-gradient echo data before and after a contrast injection, this study justifies the evaluation of TRATE as a potential biomarker of disease progression and therapy response in patients with ALS.Acknowledgements
Research supported by the Flinn Foundation.References
[1] Semmineh, N.B., Xu, J., Skinner, J.T., Xie, J. , Li, H. , Ayers, G. and Quarles, C.C. (2015), Assessing tumor cytoarchitecture using multiecho DSC‐MRI derived measures of the transverse relaxivity at tracer equilibrium (TRATE). Magn. Reson. Med., 74: 772-784.
[2] DCE MRI Technical Committee. DCE MRI Quantification Profile, Quantitative Imaging Biomarkers Alliance. Version 1.0. Reviewed Draft. QIBA, July 1, 2012. Available from: http://rsna.org/QIBA_.aspx
Figures