1349
T2, MTR, and diffusion tensor quantitative MRI methods reliably monitor AAV-mediated gene therapy treatment in a murine muscular dystrophy model1Department of Radiology, University of Washington, Seattle, WA, United States, 2Department of Neurology, University of Washington, Seattle, WA, United States
Synopsis
Herein we investigate the capability of multi-parametric MRI to reliably and decisively monitor both minute qualitative and quantitative changes in the skeletal muscle microenvironment in a Duchenne muscular dystrophy mouse model, namely mdx4Cv. Through the use of an assortment of pulse sequences, including T2, magnetization transfer ratio, and diffusion tensor imaging, the progression of a recombinant adeno-associated viral vector treatment, by the delivery of a truncated micro-dystrophin gene, is monitored in these mice and better understood. This study fundamentally seeks to understand and confirm the practicality of MRI as a diagnostic and prognostic measure in muscular dystrophy models.
Introduction
Muscular dystrophies comprise a number of genetic disorders that cause skeletal muscles to lapse into progressive states of weakness, severe modes of which ultimately result in death. Gene therapy utilizing recombinant adeno-associated viral (rAAV) vectors remains a promising approach for long term correction.1 Yet prognostics for muscular disorders depend largely on invasive biopsies that can consequently introduce error as a result of damage incurred by the procedure.2-4 Magnetic resonance imaging (MRI) has proven useful as a non-invasive quantitative imaging method. The standardization of MR protocols to reliably acquire quantitative data in muscular dystrophy models is a need that is largely unmet. In the present study, we conducted multi-parametric MRI (mpMRI) to assess the efficacy and progress of an rAAV vector treatment, delivering a micro-dystrophin gene, in an mdx4Cv (mdx) Duchenne muscular dystrophy (DMD) mouse model, via a versatile set of quantitative MR acquisition protocols.Methods
Multi-parametric 1H MRI was conducted on twenty-five B6Ros.Cg-Dmdmdx-4Cv mice via a 14-tesla (T) Bruker Avance MR spectrometer (Bruker Corp., Billerica, MA). All 25 mice were imaged at 11 weeks of age for an initial pre-treatment (Pre-Rx) time point and thereafter imaged without, and post, treatment (post-Rx) up to 12 weeks post-treatment. Three leg muscles were investigated in particular: the tibialis anterior (TA) , gastrocnemius (GA), and soleus (SOL) muscles.
MRI protocols and their parameters are listed as follows:
- Multi-slice multi-echo imaging (TR/TE = 4000/(6.3-75.4) ms, 12 echoes with 6.3-ms spacing); yields T2 transverse relaxation times
- RARE imaging (TR/TE = 5500-580/9.7 ms); yields T1 relaxation time times
- Magnetization transfer (MT) imaging (gradient echo; TR/TE = 938.9/2.3 ms, flip angle = 30°); yields MT ratios.
- First (DTI1) and second (DTI2) diffusion tensor imaging protocols with 7 diffusion directions (b-value = ~1000 mm2/s) and diffusion times 10.41 ms and 20 ms, respectively (TR/TE = 500/21 ms, flip angle = 90°); yields fractional anisotropy (FA), trace (mean diffusivity x 3), and three diffusion eigenvalues.
Statistical analysis was conducted using PRISM Version 7 software (GraphPad Software, USA).
Results
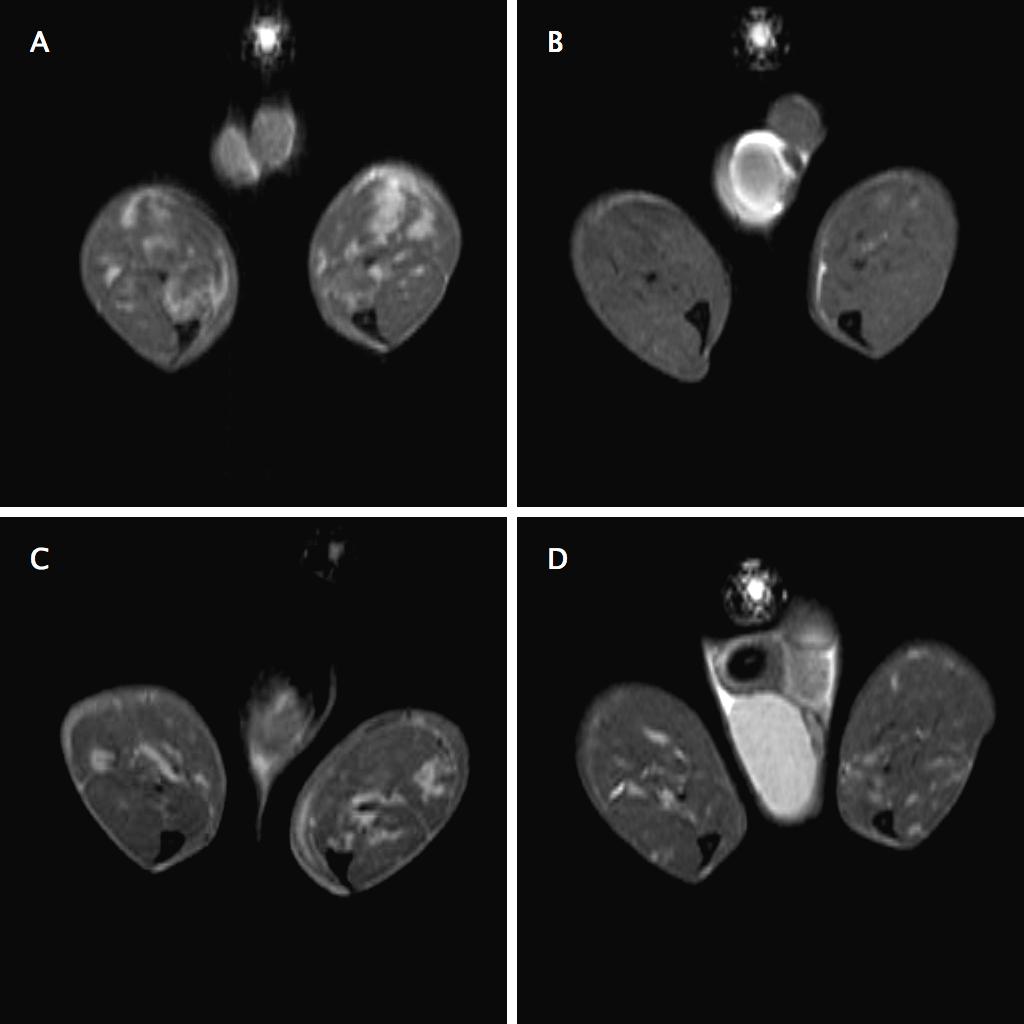
Qualitatively, signs of atrophy by T2-weighted imaging waned in the treatment cohort across time but not in the control (Figure 1).
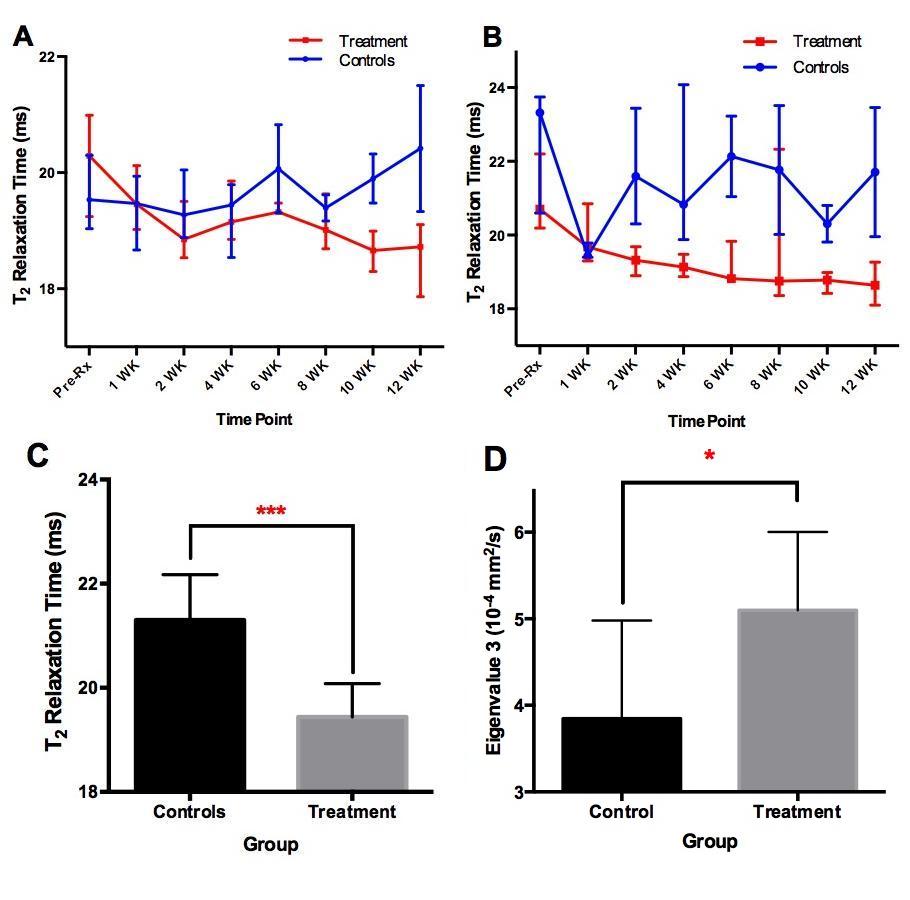
Nearly all parametric methods differed across time between the two cohorts, however many differed to a degree of statistical significance. By the Kruskal-Wallis test, T2 relaxation median values decreased in the treatment group, relative to the control group, significantly in all three muscle groups (p = 0.0262, p = 0.0005, and p < 0.0001, respectively; Figure 2). MT ratios varied significantly in the TA muscle, with P = 0.0171. Regarding DTI1, FA differences were observed in the TA muscle (P = 0.0297). Trace values differed between the two groups at P = 0.0309, and also in TA eigenvalue 2 (P = 0.0397). In DTI2, statistical significance included two additional trace muscle groups (GA and SOL at P = 0.0053 and P = 0.0226, respectively), as well as in two new eigenvalues, not shown to be significant in DTI1, namely GA eigenvalue 2 (P = 0.0036) and SOL eigenvalue 3 (P = 0.0281).
Atemporal analysis via unpaired t-tests, i.e. irrespective of time points, from 1 week post-treatment onward, demonstrated disparities between the two cohorts in T2 TA, T2 SOL, and DTI2 TA eigenvalue 3, at p = 0.0466, 0.0007 (Figure 2), and 0.0415, respectively.
Discussion
Quantitative MRI values can be sensitive to a large number of small but confounding factors. We overcame many said factors by increasing our sample size, keeping time points tighter to demarcate more minute differences, and by replacing diffusion-weighted imaging with the more robust diffusion tensor imaging protocol.
T2 relaxation values are typically high in tissues that have undergone edema or inflammation, coinciding with some manifestations of DMD. We've observed substantial, statistical decline in T2 relaxation medians in mdx mice subjected to rAAV-mediated treatment, suggesting advanced recovery of normal dystrophin function and muscle regeneration. Such a disparity was observed in all three muscle groups. Atemporal analysis further affirmed by comparison of the means that relevant reductions in T2 are indeed observed.
MT ratio and DTI measurements exemplified the powerful resolution with which mpMRI resolves differences in fine quantitative values.
Conclusion
We demonstrate that T2 relaxation, MTR, and diffusion tensor values significantly differed between mice treated with rAAV-mediated micro-dystrophin and untreated mdx mice, for at least one muscle group in each case, suggesting the efficacy of the proposed treatment outcome, and the reliability of our multi-parametric methods in resolving these differences. Such a development is a proof of concept that quantitative MR methods can non-invasively, and successfully, distinguish between normal and dystrophic muscle tissue.Acknowledgements
This study was supported by MDA 312455, NIH R01 CA188654 and NIH R01 AR40864.References
1. Duan D. Systemic AAV Micro-dystrophin Gene Therapy for Duchenne Muscular Dystrophy. Molecular Therapy. 2018;26(10):2337-2356. doi:10.1089/hum.2018.012
2. Manilal S, Sewry C, Man NT, Muntoni F, Morris G. Diagnosis of X-linked Emery-Dreifuss muscular dystrophy by protein analysis of leucocytes and skin with monoclonal antibodies. Neuromuscular Disorders. 1997;7(1):63-66. doi:10.1016/s0960-8966(96)00405-1.
3. Sabatelli P, Squarzoni S, Petrini S, et al. Oral exfoliative cytology for the non-invasive diagnosis in X-linked Emery–Dreifuss muscular dystrophy patients and carriers. Neuromuscular Disorders. 1998;8(2):67-71. doi:10.1016/s0960-8966(97)00147-8.
4. Roth SM, Martel GF, Rogers MA. Muscle biopsy and muscle fiber hypercontraction: a brief review. European Journal of Applied Physiology. 2000;83(4-5):239-245. doi:10.1007/s004210000287.
5. Salinero-Paniagua E, Esteban-Garcia A, Traba A, Palencia-Herrejon E, Garzo-Fernandez C, Prieto-Montalvo J. [Modified aspiration needle muscular biopsy in neuromuscular diseases. Use and advantages over open surgical biopsy]. Revista de Neurología. 2004;39(9):821–5. Epub 2004/11/16. doi: rn2003521 [pii]. pmid:15543496.
Figures