1347
Spatial heterogeneities of calf muscle perfusion and its implications1Internal Medicine, University of Utah Huntsman Cancer Institute, Salt Lake City, UT, United States, 2Population Health Sciences, University of Utah, Salt Lake City, UT, United States, 3University of Utah, Salt Lake City, UT, United States, 4University of Massachusetts at Amherst, Amherst, MA, United States, 5Radiology, University of Utah, Salt Lake CIty, UT, United States, 6Health Platform, Verily, Cambridge, MA, United States
Synopsis
For the study groups of young healthy subjects, aged healthy subjects and peripheral artery disease patients, we measured exercise-stimulated perfusion in calf muscles using both T1-weighted DCE MRI. We found that the heterogeneity and texture complexity of calf muscle (specifically, the medial gastrocnemius and soleus muscle groups) perfusion decreased with exercise load among the young healthy subjects, and decreased with age among all healthy subjects. In addition, the heterogeneity of the calf muscle perfusion is greater among young healthy subjects when compared with peripheral artery disease patients.
Introduction
Muscle heterogeneity has been reported by multiple studies regarding PET imaging animal studies. Previous studies found that heterogeneity decreases with exercise load and age. In this work, we investigated the heterogeneity of the muscle perfusion based on T1 weighted DCE MRI from patients with peripheral disease (PAD), young healthy subjects (YHSs), and aged healthy subjects (AHSs). We also performed a texture analysis to compare between PAD patients and healthy subjects, as well as between the different exercise loads among YHSs. We choose two calf muscle groups: the medial gastrocnemius (MG) and soleus (SL).Methods
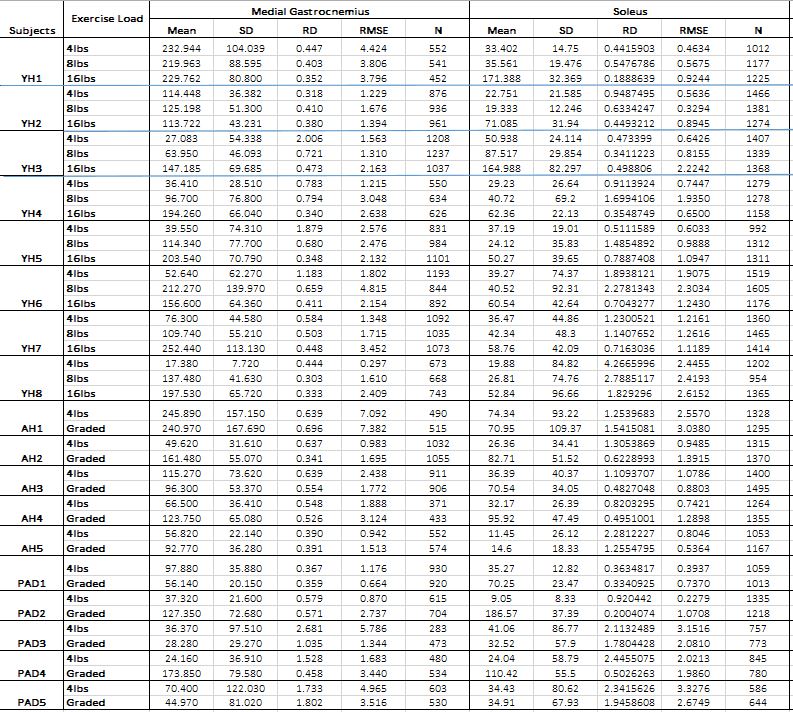
A total of 18 subjects participated in this study, including 5 YHSs (27.8%), 5 AHSs (27.8%), and 8 PAD patients (44.4%). All experiments were performed in a thermoneutral environment with participants in an overnight fasted state and have refrained from any intensive physical activity for 24 hours prior to the experimental protocol. Single-leg dynamic plantar flexion was performed with an MRI-compatible apparatus that allowed for placement of an adjustable load. Each subject underwent three MRI perfusion measurements for plantar flexion of different absolute workloads; each exercise lasted for 3 minutes at a flexion frequency of 1 Hz and was loaded with the constant weight of 4, 8 and 16 lbs, respectively. All acquired images were transferred to a personal computer for post-processing using Matlab-based programs. We first converted each dynamic image (S) to a map of T1 based on the saturation-recovery formula: S = PD·[1-exp(-TD/T1)]. The obtained T1 maps can be further converted to maps of contrast concentration (M) based on the T1-shortening formula. For each voxel of calf muscle in the field of view, the temporal course of contrast concentration was analyzed using an established tracer kinetic model to estimate the perfusion. The perfusion heterogeneity was estimated using the relative dispersion (RD) = standard deviation (SD)/ Mean and root mean square error (RMSE) across voxels within a given muscle group for each subject. The group level RD is calculated as the average of individual RD across all subjects within each of the three groups (YHSs, AHSs, and PAD patients). The parameters that we used for texture analysis include Shannon’s entropy and fractal dimension (D). The value of entropy reflects the complexity (or the degree of “disordering”) of the perfusion map. The D value obtained by the fractal analysis describes the relationship between the relative dispersion and the size of the region being studied and has been used for the assessment of perfusion heterogeneity in the previous literature.Results
The perfusion maps of the T1-weighted DCE MRI at 4 and 16 lbs exercise load for the muscle groups MG and SL, respectively, were presented in Figure 1 and 2 for YHSs. Figure 3 and 4 visually displayed the perfusion maps of the T1-weighted DCE MRI for AHSs and PAD patients for the muscle groups MG and SL, respectively. Among the YHSs, there is an obvious decreasing trend in RD with the increase in exercise loads (Table 1). However, there is no obvious pattern of the individual level MSEs with the increase of exercise loads among the YHSs. There is also an obvious decreasing trend for the group level RD with the increment of exercise load for both muscle groups among the YHSs, indicating that the heterogeneity of the muscle perfusion reduces with higher exercise loads (Table 2). On the other hand, the group level entropy increases with the exercise load, jumping from 1.94 at the 4 lbs to 2.15 at the 16 lbs for the MG muscle group, and from 1.81 to 2.10 for the SL muscle group. This implies that the texture complexity of muscle perfusion increases with the exercise loads (Table 2). When comparing between YHSs and PAD patients at 4 lbs exercise load, both group level RD and entropy for the MG muscle perfusion map of PAD patients are greater than those for YHSs (Table 2). When comparing between YHSs and AHSs at the 4 lbs exercise load, the group level RD for the MG muscle perfusion is greater among the YHSs while the entropy is greater among the AHSs. No pattern of the group level fractal dimension was found in the study for both MG and SL muscle groups.Conclusions
By comparing the DCE perfusion map for calf muscle among YHSs, we found that spatial heterogeneity reduced with the increase of exercise load. However, the complexity of the perfusion map increases with the exercise load. The heterogeneity and complexity of the muscle perfusion among PAD patients are all greater than those for YHSs. In addition, both complexity and heterogeneity of the muscle perfusion decrease with age among the healthy subjects.Acknowledgements
No acknowledgement found.References
Brunner, G., Bismuth, J., Nambi, V., Ballantyne, C. M., Taylor, A. A., Lumsden, A. B., ... & Shah, D. J. (2016). Calf muscle perfusion as measured with magnetic resonance imaging to assess peripheral arterial disease. Medical & biological engineering & computing, 54(11), 1667-1681.
Collewet, G., Strzelecki, M., & Mariette, F. (2004). Influence of MRI acquisition protocols and image intensity normalization methods on texture classification. Magnetic resonance imaging, 22(1), 81-91.
Hall, E. T., Sá, R. C., Holverda, S., Arai, T. J., Dubowitz, D. J., Theilmann, R. J., ... & Hopkins, S. R. (2013). The effect of supine exercise on the distribution of regional pulmonary blood flow measured using proton MRI. Journal of Applied Physiology, 116(4), 451-461.
Hindel, S., Sauerbrey, A., Maaß, M., Maderwald, S., Schlamann, M., & Lüdemann, L. (2015). Validation of perfusion quantification with 3D gradient echo dynamic contrast-enhanced magnetic resonance imaging using a blood pool contrast agent in skeletal swine muscle. PloS one, 10(6), e0128060.
Kalliokoski, K. K., Kuusela, T. A., Nuutila, P., Tolvanen, T., Oikonen, V., Teräs, M., ... & Knuuti, J. (2001). Perfusion heterogeneity in human skeletal muscle: fractal analysis of PET data. European journal of nuclear medicine, 28(4), 450-456.
Nketiah, G., Savio, S., Dastidar, P., Nikander, R., Eskola, H., & Sievänen, H. (2015). Detection of exercise load‐associated differences in hip muscles by texture analysis. Scandinavian journal of medicine & science in sports, 25(3), 428-434.
Sartini, L., Simeone, F., Pani, P., Lo Bue, N., Marinaro, G., Grubich, A., ... & Gasparoni, F. (2010). Nuclear instruments and methods in physics research section a: Accelerators, spectrometers, detectors and associated equipment. Nuclear Instruments and Methods in Physics Research A.
Sikiö, M., Harrison, L. C., Nikander, R., Ryymin, P., Dastidar, P., Eskola, H. J., & Sievänen, H. (2014). Influence of exercise loading on magnetic resonance image texture of thigh soft tissues. Clinical physiology and functional imaging, 34(5), 370-376.
Szczypiński, P. M., Strzelecki, M., Materka, A., & Klepaczko, A. (2009). MaZda—a software package for image texture analysis. Computer methods and programs in biomedicine, 94(1), 66-76.
Tedjasaputra, V., Sá, R. C., Arai, T. J., Holverda, S., Theilmann, R. J., Chen, W. T., ... & Hopkins, S. R. (2013). The heterogeneity of regional specific ventilation is unchanged following heavy exercise in athletes. Journal of applied physiology, 115(1), 126-135.
Wright, K. L., Seiberlich, N., Jesberger, J. A., Nakamoto, D. A., Muzic Jr, R. F., Griswold, M. A., & Gulani, V. (2013). Simultaneous magnetic resonance angiography and perfusion (MRAP) measurement: initial application in lower extremity skeletal muscle. Journal of Magnetic Resonance Imaging, 38(5), 1237-1244.
Figures