1345
Creatine and phosphocreatine mapping of mouse skeletal muscle by a polynomial and Lorentzian line-shape fitting CEST method1F.M. Kirby Research Center for Functional Brain Imaging, Kennedy Kriger Institute, Baltimore, MD, United States, 2Russell H. Morgan Department of Radiology and Radiological Science, Johns Hopkins University, Baltimore, MD, United States, 3Division of Cardiology, Department of Medicine, Johns Hopkins University, Baltimore, MD, United States
Synopsis
Wild type (WT) mice and Guanidinoacetate N-Methyltransferase deficiency (GAMT-/-) mice that have low Cr and PCr concentrations in muscle were used to assign the Cr and PCr peaks in the skeletal muscle Z-spectrum. A PLOF method was proposed to simultaneously extract and quantify the Cr and PCr CEST signal by assuming two Lorentzian functions for the Cr and PCr peaks and a polynomial function for the background signal. High-resolution PCr and Cr maps of mouse skeletal muscle were obtained by the PLOF CEST method after calibration with in vivo MRS.
Introduction
Creatine (Cr) and phosphocreatine (PCr) are the two primary components of the creatine kinase reaction, arguably the primary energy reserve reaction in muscle[1,2]. Previously, Haris et al. developed a CEST detection method to detect low concentrations of Cr in tissues [3,4]. Although, the contributions of PCr and Cr to the brain CEST Z-spectrum had been investigated [5], their contributions and line-shapes in muscle Z-spectrum have not been confirmed. Here, a creatine-deficient mouse model together with one polynomial and Lorentzian line-shape fitting (PLOF) method[5] was used to examine and quantify the PCr and Cr simultaneously in mouse skeletal muscle.Methods
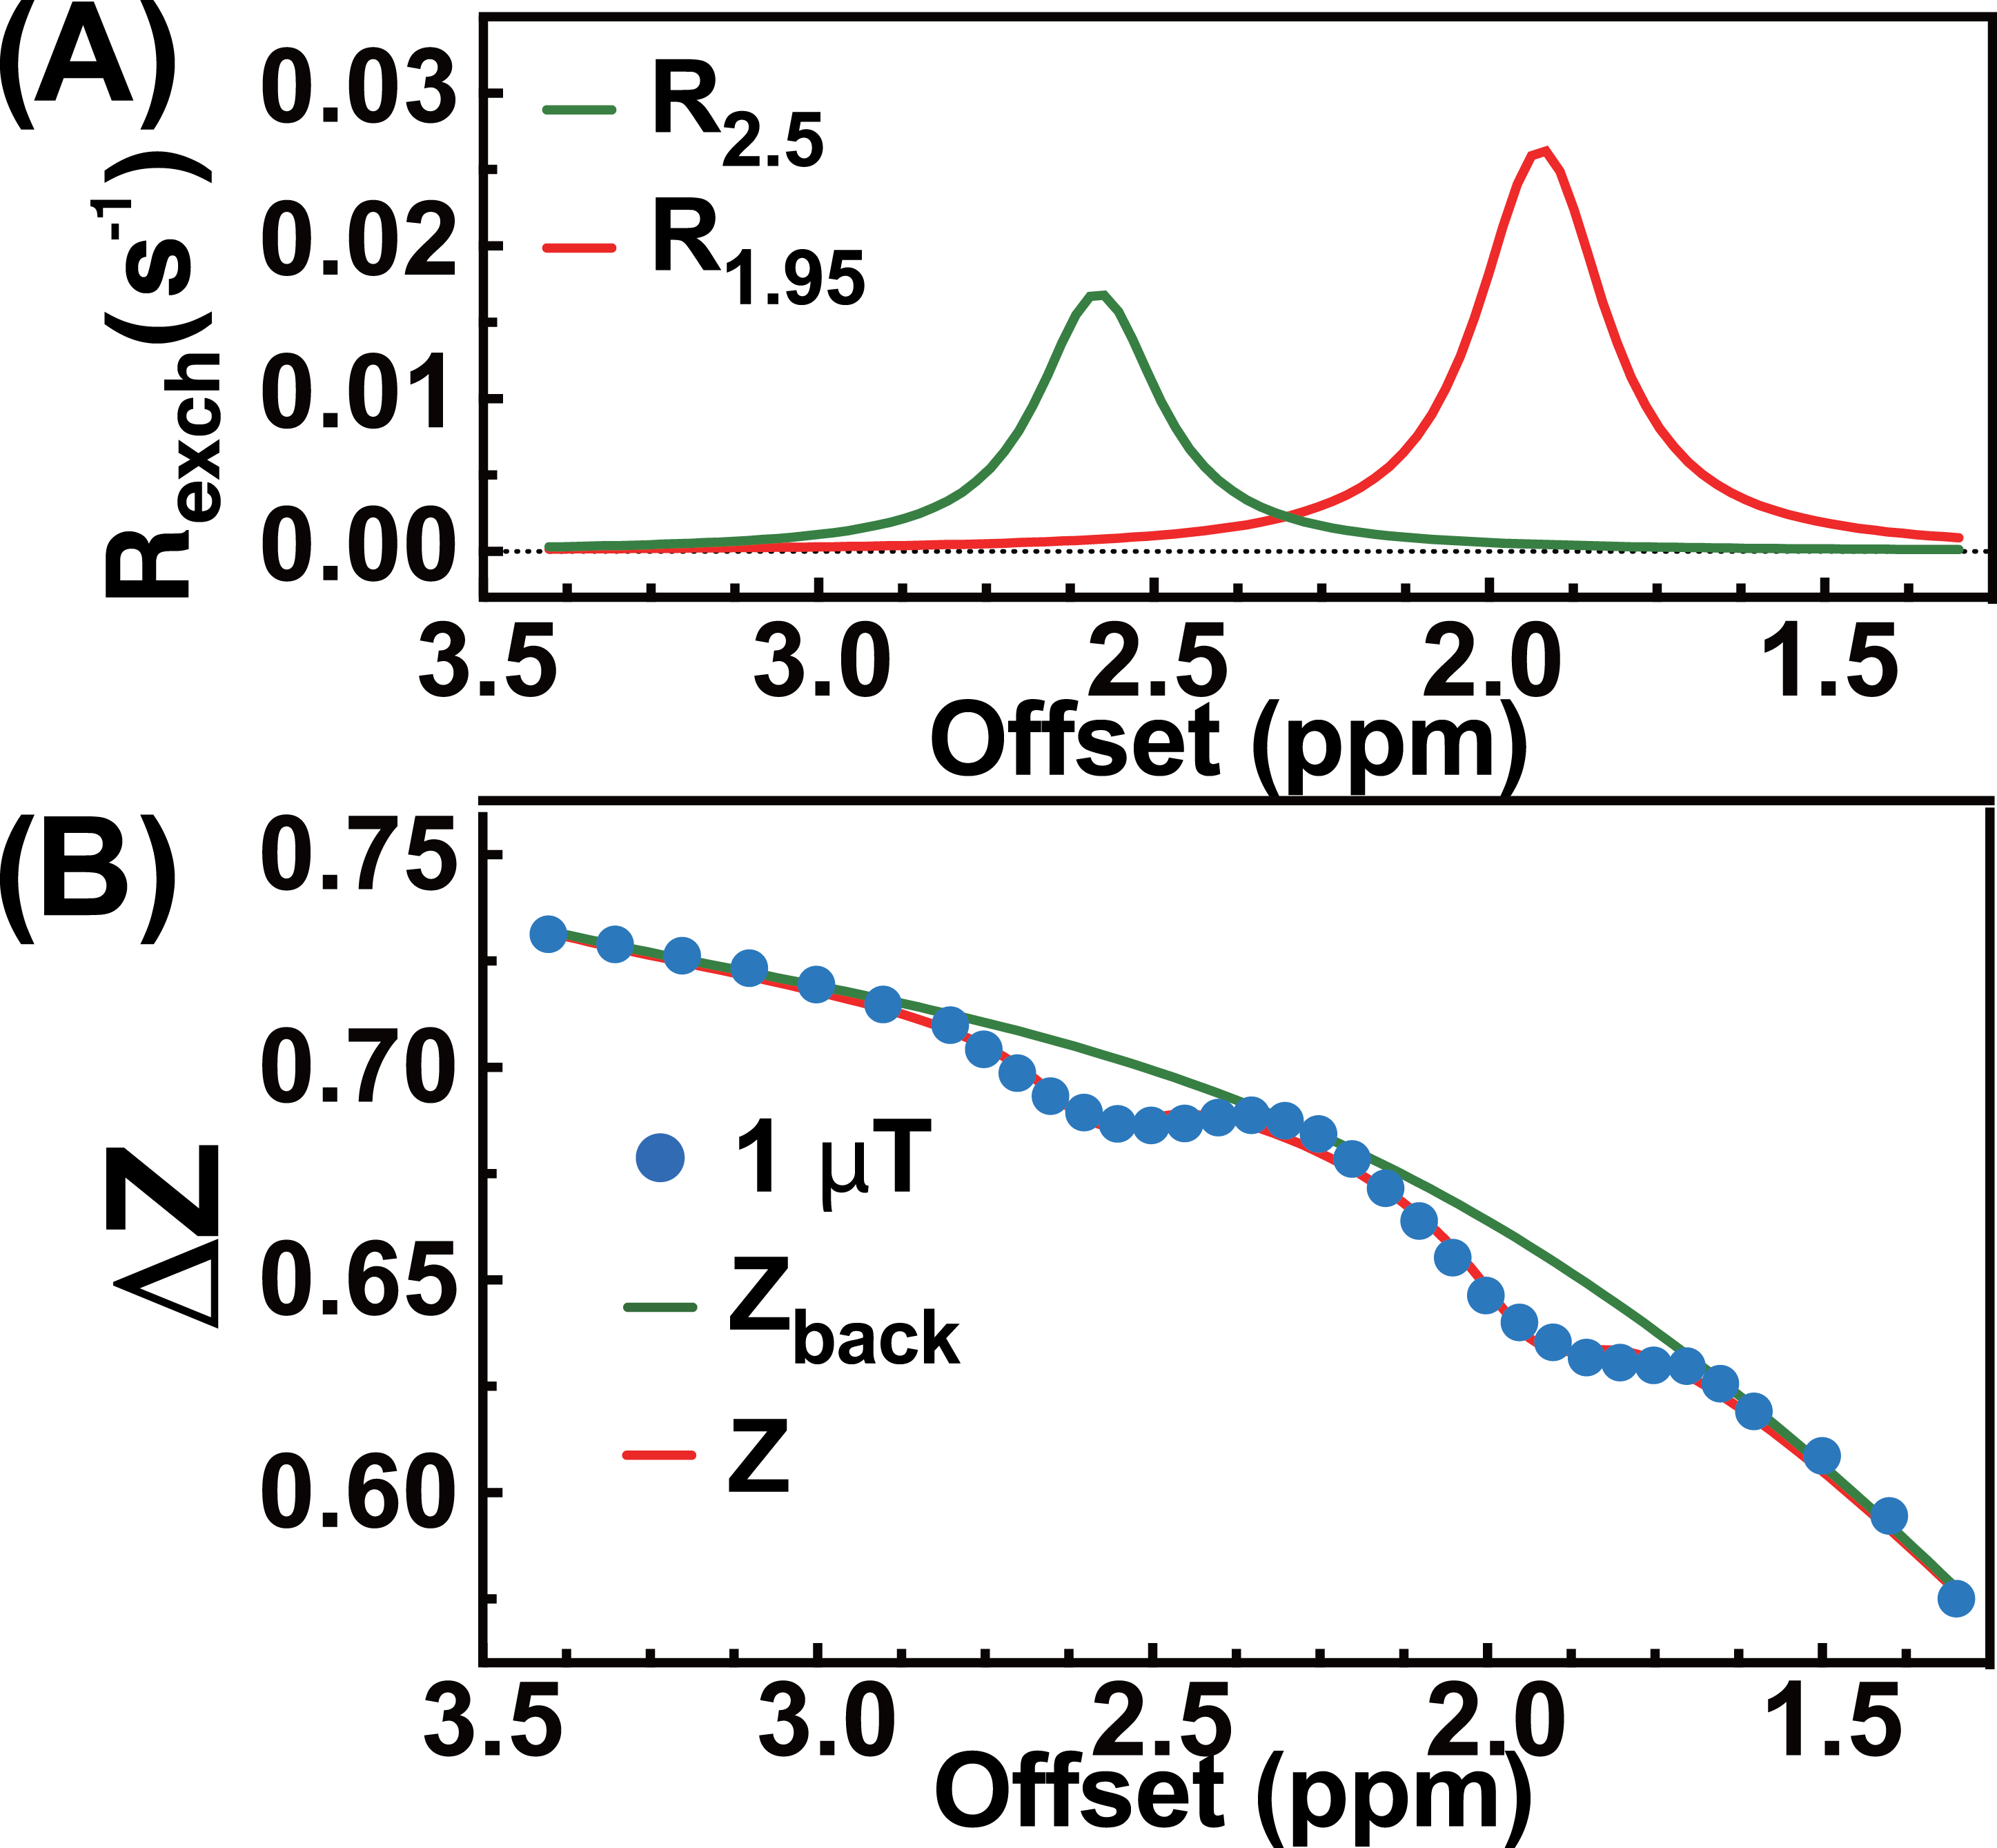
Wild type(WT) mice and Guanidinoacetate N-Methyltransferase deficient(GAMT-/-) mice that have low Cr and PCr concentrations in muscle were used to assign the Cr and PCr peaks in the Z-spectrum at 11.7 T. A two-peak PLOF method was used to simultaneously extract and quantify the Cr and PCr by assuming a polynomial function for the background and two Lorentzian functions for the CEST peaks at 1.95 ppm and 2.5 ppm, respectively (see the illustration in Fig. 1). All MR experiments were performed using a 11.7T Bruker Biospec system. A CW-CEST sequence with RARE readout was used for the CEST MRI. In vivo MRS experiments were acquired using STEAM sequence (TE= 3 ms, TM=10 ms, TR=2.5 sec). Total image time was 8 mins.Results and Discussion
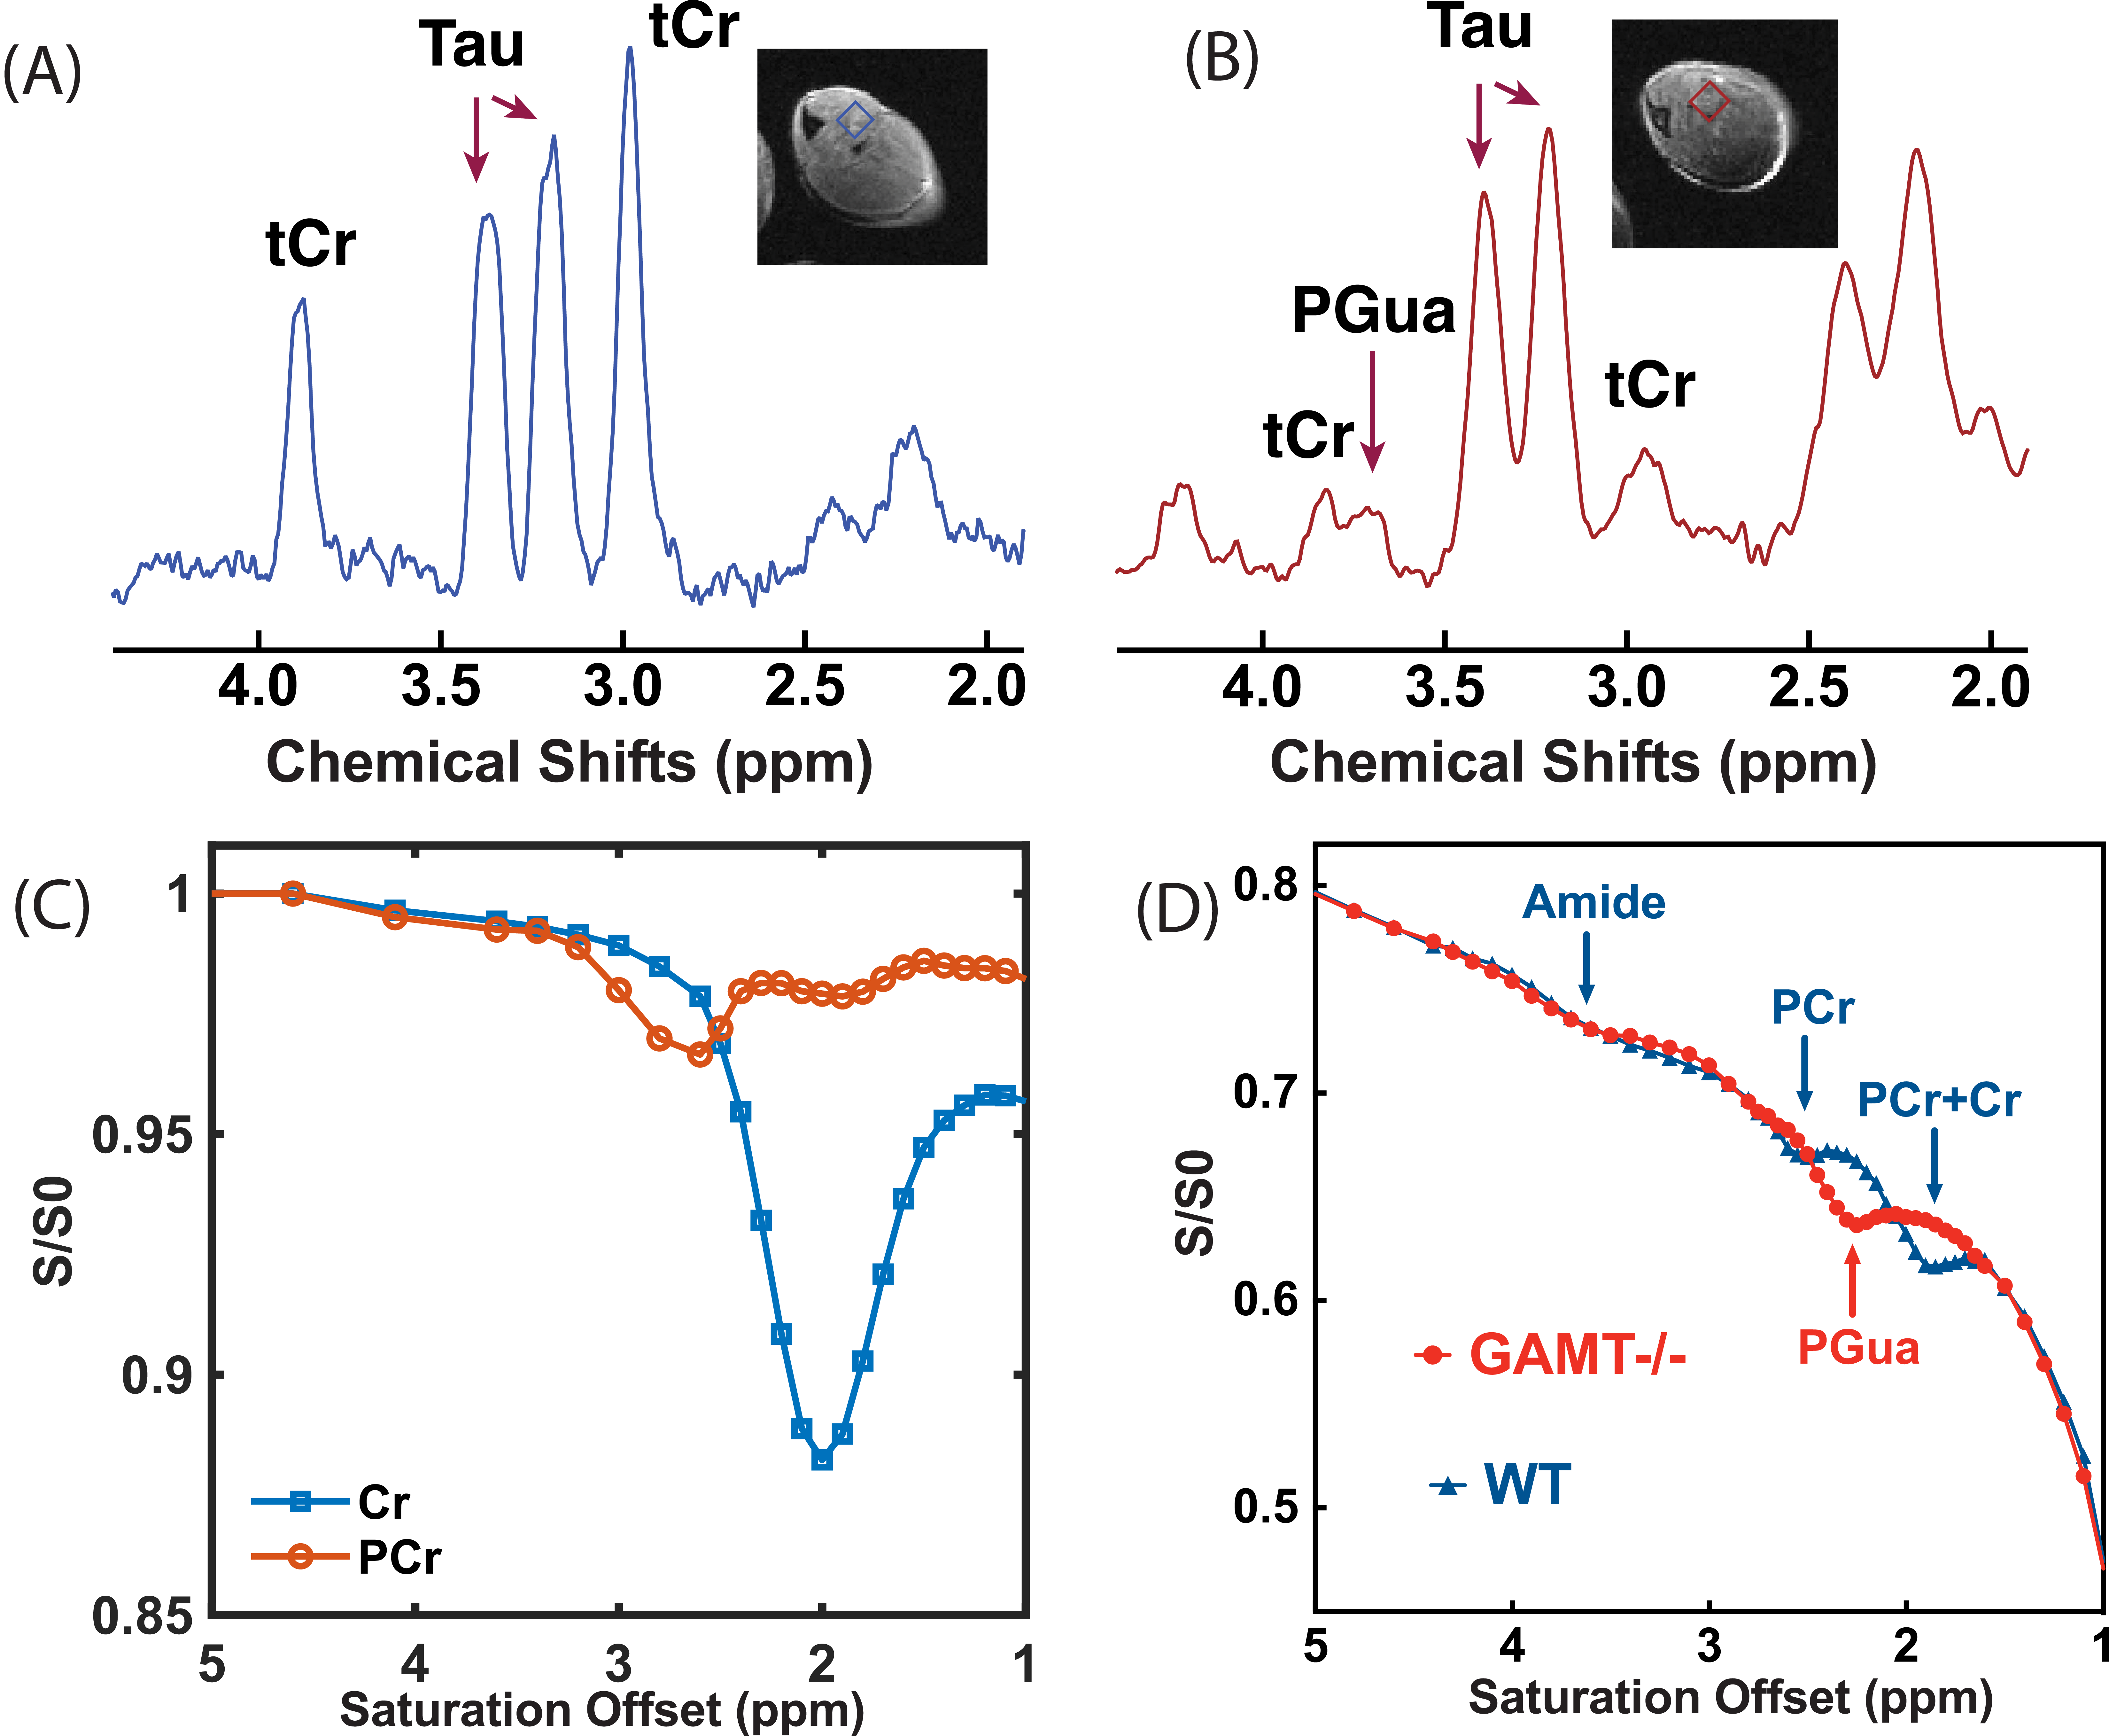
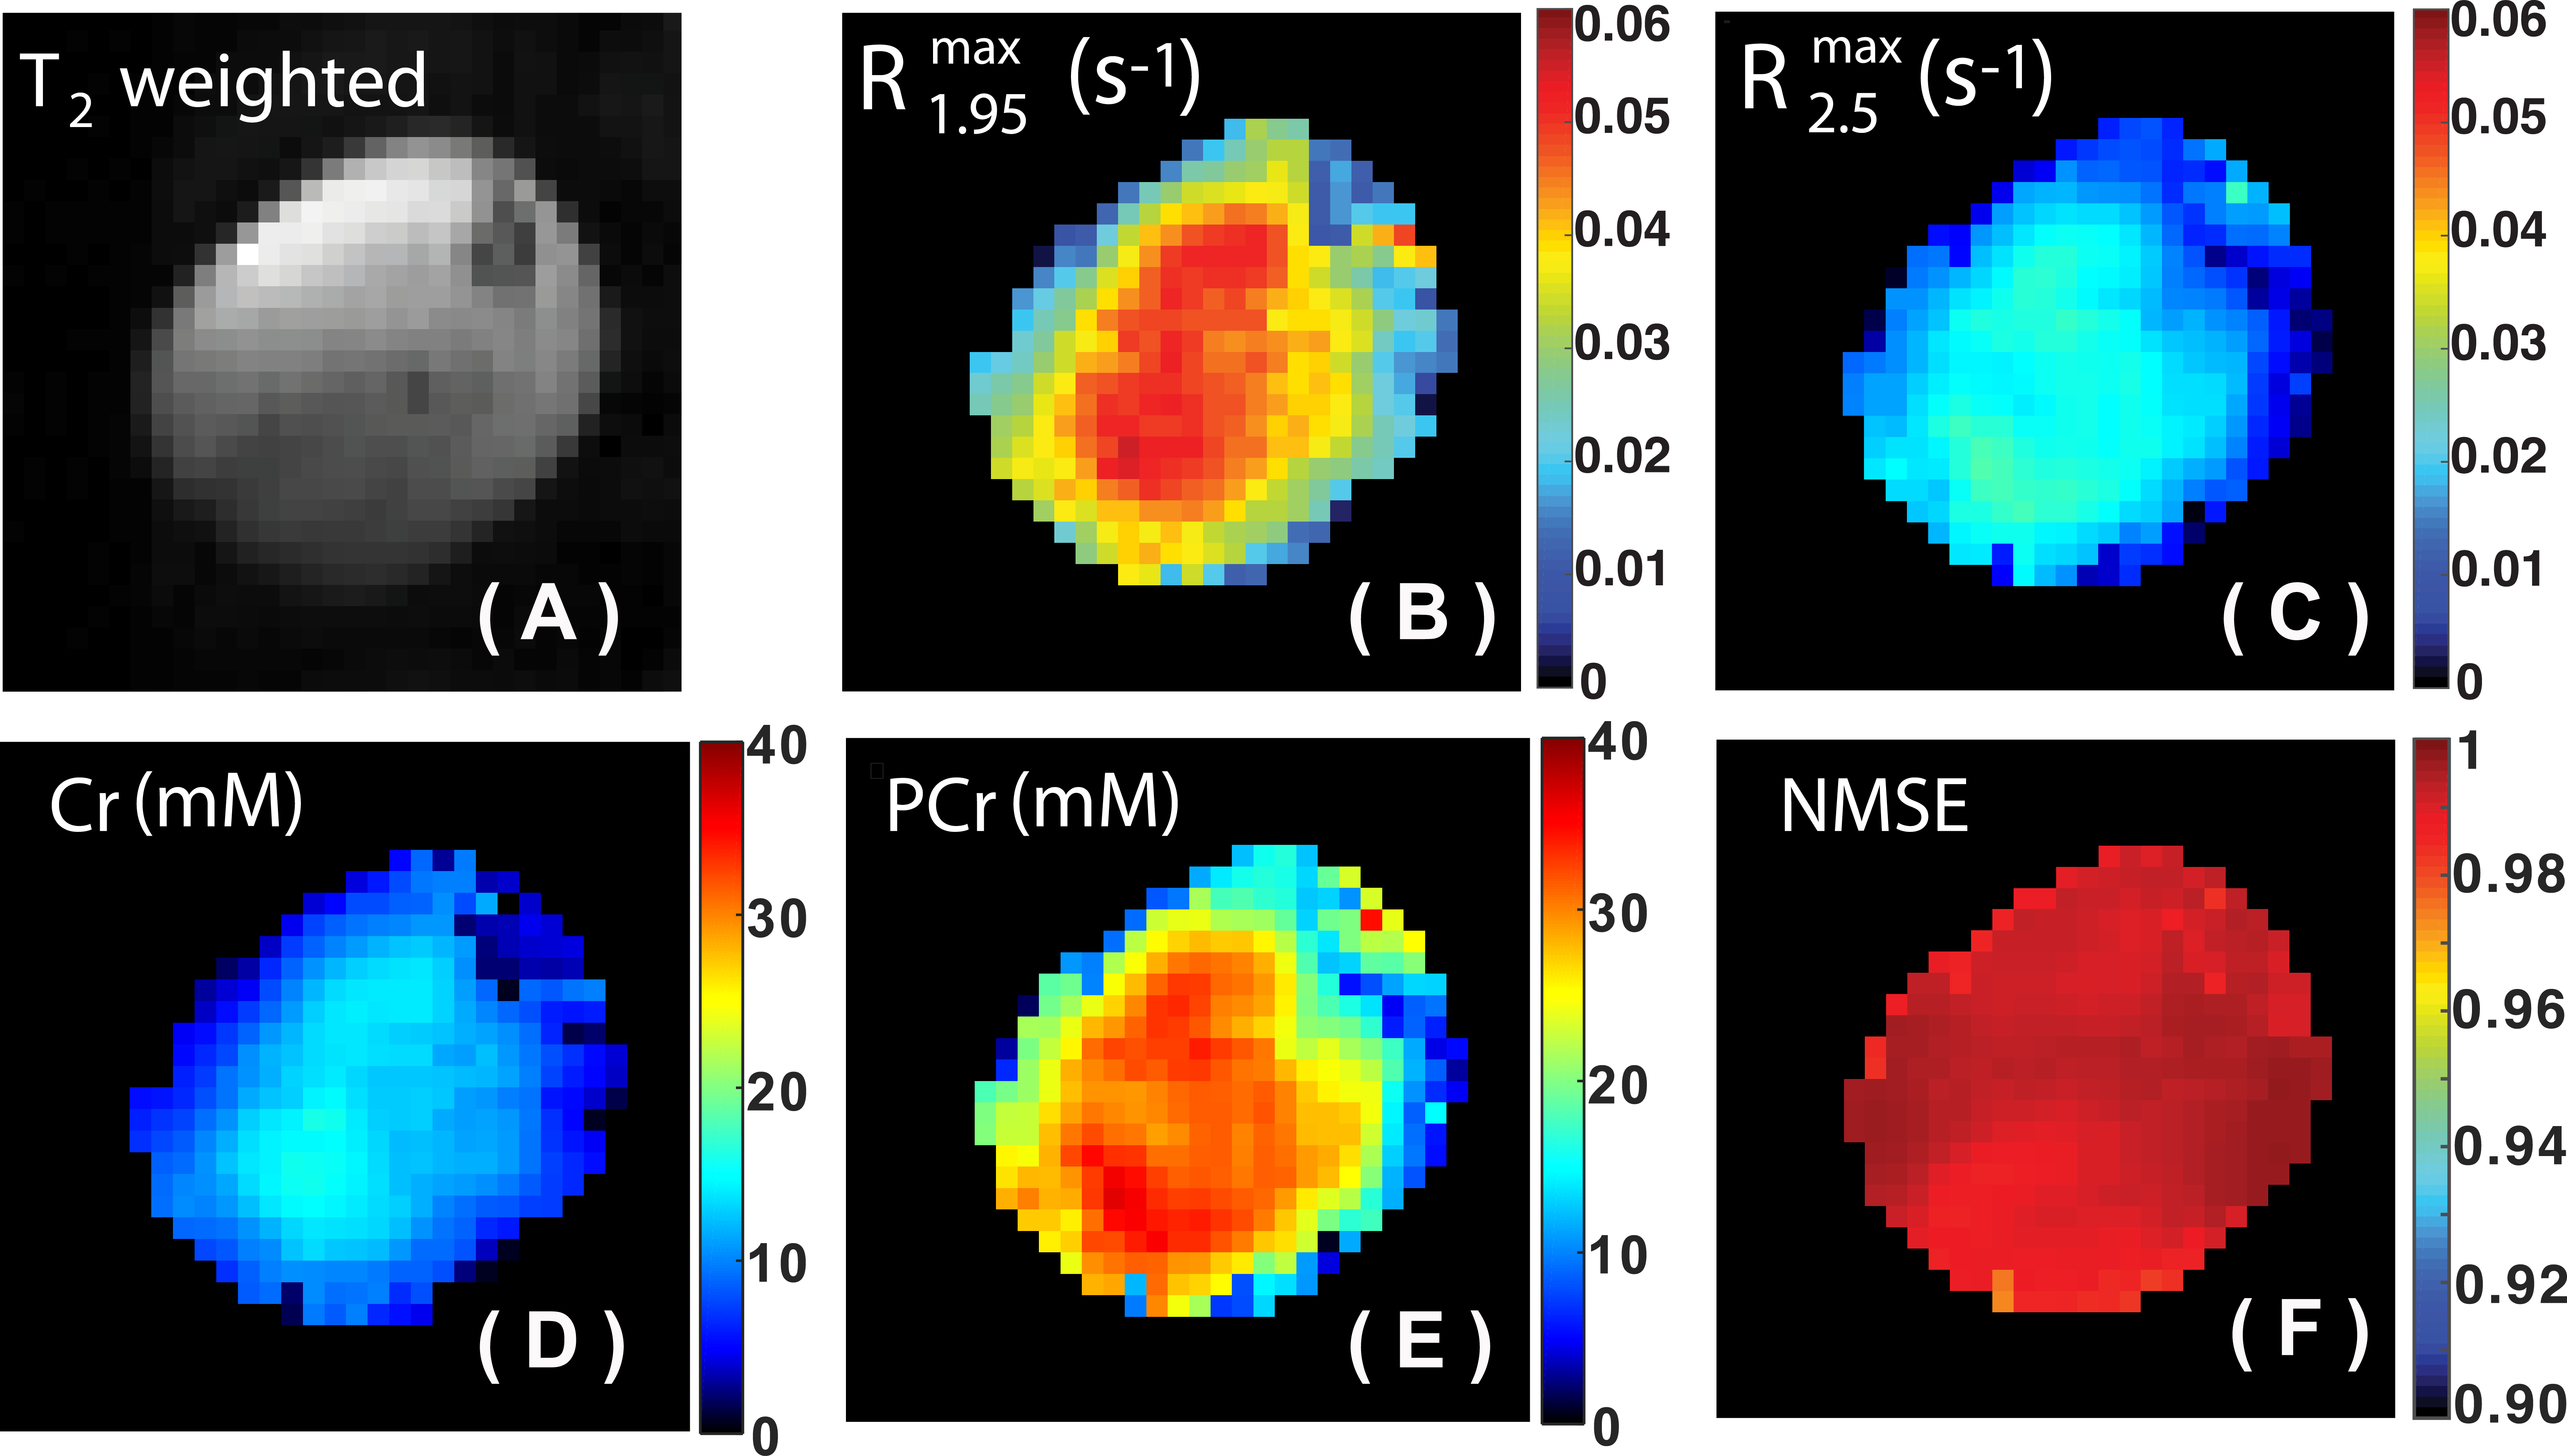
The in vivo 1H MRS spectra in Fig 2A&B show that the tCr concentration of the GAMT-/- skeletal muscle (1.2 ± 0.8 mM, n=3) is significantly reduced compared to that of the WT mouse (38.8 ± 2.8 mM, n=3). Notably, the spectrum of GAMT -/- mice exhibits appreciable PGua signal at 3.78 ppm [6]. The Z-spectra of the 30 mM Cr and PCr phantoms at pH = 7.0 recorded with 1 µT saturation power are shown in Fig. 1C. There is one strong peak around 2.0 ppm present in the Cr CEST Z-spectrum, while two peaks around 2.0 ppm and 2.5 ppm are observed in the PCr CEST Z-spectrum. A comparison between the Z-spectra of GAMT -/- and WT mice with a saturation power of 1 µT are shown in Fig. 2D. The Z-spectrum of the WT mouse showed two clear peaks around 1.95 ppm and 2.5 ppm, while there was only one sharp peak around 2.2 ppm in the Z-spectrum of the GAMT-/- mice. Different from a previous brain study[5], mobile protein guanidium protons are not detected in skeletal muscle and the amide peak is small with a maximum amplitude of around 1.2% of water magnetization. The disappearance of the protein guanidinium peak and the reduction of the amide peaks from the proteinsarefavorable to the extraction of clean Cr and PCr CEST signal. The extracted true apparent relaxation rates R1.95 and R2.5 of skeletal muscle at a saturation power of 1 µT are shown in Figs. 3B&C, respectively. The calibrated concentration maps of Cr and PCr are shown in Figs. 3D&E, respectively. The goodness of the PLOF fitting for each pixel is illustrated by the normalized mean square error (NMSE) map shown in Fig. 2F. The mean value and standard deviation of the NMSE map are 0.9922 and 0.0034, respectively. The averaged Cr and PCr concentrations of WT mouse calf muscle were determined to be 11.3 ±1.4 mM and 30.8 ±2.8 mM, respectively, which are slightly higher than previously reported values (Cr 7.5 mM : PCr 22.5 mM) from spectroscopy[6,7]. The PCr and Cr maps do not following clear pattern of muscle anatomy, perhaps due to their relatively low resolution, and also only small differences in concentrations between the different muscle types. Also, the edges of the PCr and Cr maps (transition from muscle to air) show strong concentration gradients due to the partial volume effects.Conclusion
The significantly reduced protein CEST peaks in muscle Z-spectrum allow us extracting clean PCr and Cr CEST signals. The PLOF method provides an efficient way to map Cr and PCr concentrations simultaneously from the muscle Z-spectra at high MRI field and can be also applied for the qualification of other CEST contrasts that show one or multiple distinguishable peaks in CEST Z-spectrum.Acknowledgements
This work was supported by NIH R01EB015032, P41EB015909, andR01HL63030References
[1] Wyss M, et al. Physiol Rev 2000;80:1107.
[2] Andres RH, et al. Brain Res Bull 2008;76(4):329-343.
[3] Haris M, et al. NMR Biomed 2012;25(11):1305-1309.
[4] Haris M, et al. Nat Med 2014;20(2):209-214.
[5] Chen L, et al. NMR Biomed 2017;30: e3834.
[6]Renema WK, et al. Magn Reson Med 2003;50(5):936-943.
[7] Renema WKJ, et al. Magn Reson Med 2003;50(5):936-943.
[8] t Zandt Hi, et al. J Physiol 2003;548(3):847-858.
Figures