1341
Permanent and non-permanent changes of skeletal muscle diffusion properties in triathletes and non-athletes detected by diffusion tensor imaging and T2 mapping1Radiology, Charité University Medicine, Berlin, Germany, 2Diagnostic and Interventional Radiology and Nuclear Medicine, University Medical Center Hamburg-Eppendorf (UKE), Hamburg, Germany, 3Radiology, UT Southwestern Medical Center, Dallas, TX, United States, 4Radiology, Children's Medical Center, Dallas, TX, United States
Synopsis
The combined application of MRI Diffusion tensor imaging (DTI) and T2 mapping in professional triathletes and healthy controls at rest and hours after triathlon enables the detection of changes induced in skeletal muscle diffusion properties, and thus microstructure, caused by daily professional training and intensive exercise.
Introduction
Diffusion tensor imaging of the skeletal muscle has been made significant progress in recent years and has been applied in various states such as aging1, exercise injury2, and training3. The DTI metrics (fractional anisotropy (FA), mean diffusivity (MD) and its eigenvalues of diffusion tensor) are sensitive to changes in the tissue microstructure caused by various alterations. The aim of this study was to detect changes in the skeletal muscle properties caused by
i) Professional daily training in comparison to gender-matched controls
ii) Performance of extreme exercise due to participation at a triathlon in comparison to baseline quantitates of i).
Methods
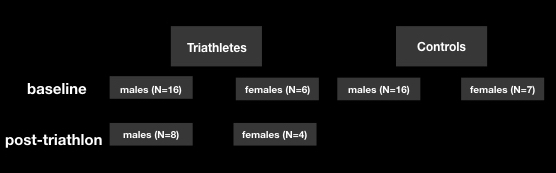
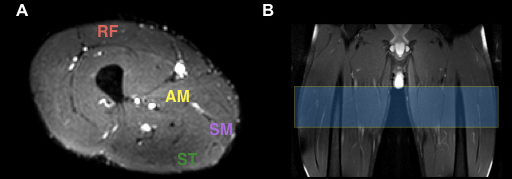
In total N=22 triathletes (male:female 16:6; age (SD) 43.2 (11.5) years) and N=23 controls (male:female 16:7; age (SD) 38.2 (14.4) years) were included. Out of these 22 triathletes, N=12 (m:f 8:4) participated in a post-triathlon MRI examination, which was performed within three hours after the race (see flowchart Fig.1). MRI was performed at 3 Tesla using a fat-suppressed single-shot SE-EPI sequence (FoV 220x220x240, Voxel size 1.5x1.5x3.0mm3, Flip angle 90°, TR/TE 2479/43ms, b-value 500 s/mm2, NGD 15, NSA 8). The DTI-parameters MD, FA, and eigenvalues, as well as T2 times, were calculated using Osirix (v9.5 DTImap plugin; v1.6 and T2 fit map). The muscle fat fraction (MFF) was calculated using axial 3D GRE modified two-point Dixon-based MRI (2pt-MRIDIXON) with a chemical-shift-encoded reconstruction of the fat and water signal4. Quantitative MFF (%) were calculated as SIFAT/(SIFAT+SIWATER )× 100 and reported as mean value of all pixels within an ROI. Regions-of-interests (ROIs) were chosen at mid-thigh level (Fig. 2) for rectus femoris (RF), biceps femoris (BF), adductor magnus (AM), semitendinosus (ST), and semimembranosus muscle (SM) avoiding areas of a suspected muscle strain on T2 images.
Results
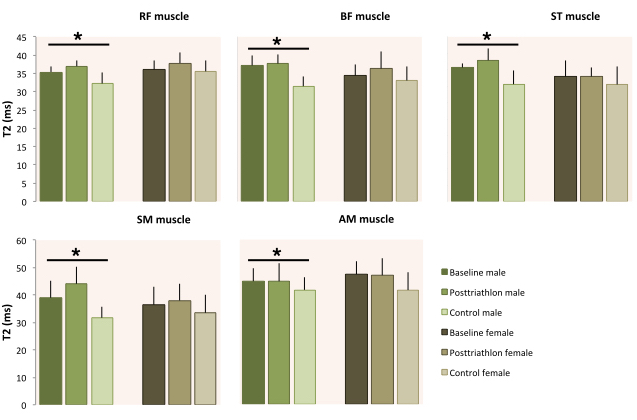
A significant prolongation of T2 relaxation times was found in nearly all analyzed muscles compared between male triathletes and male controls (Fig. 3). There was a tendency of higher T2 times in female athletes compared to controls, however without being significant. Upon DTI calculation we detected a significant increase of MD and corresponding λ2 and λ3 in the RF muscle of male triathletes at baseline measurement compared to controls. No changes of DTI metrics were observed for the other thigh muscles analyzed. In females, the same tendency was observed, however, not significant. The finding of increased MD and eigenvalues in RF muscle was consistent for the whole group analysis including males and females, indicating that significant differences in T2 times and RF DTI metrics were driven by the male cohort, although a similar trend was observed for females.
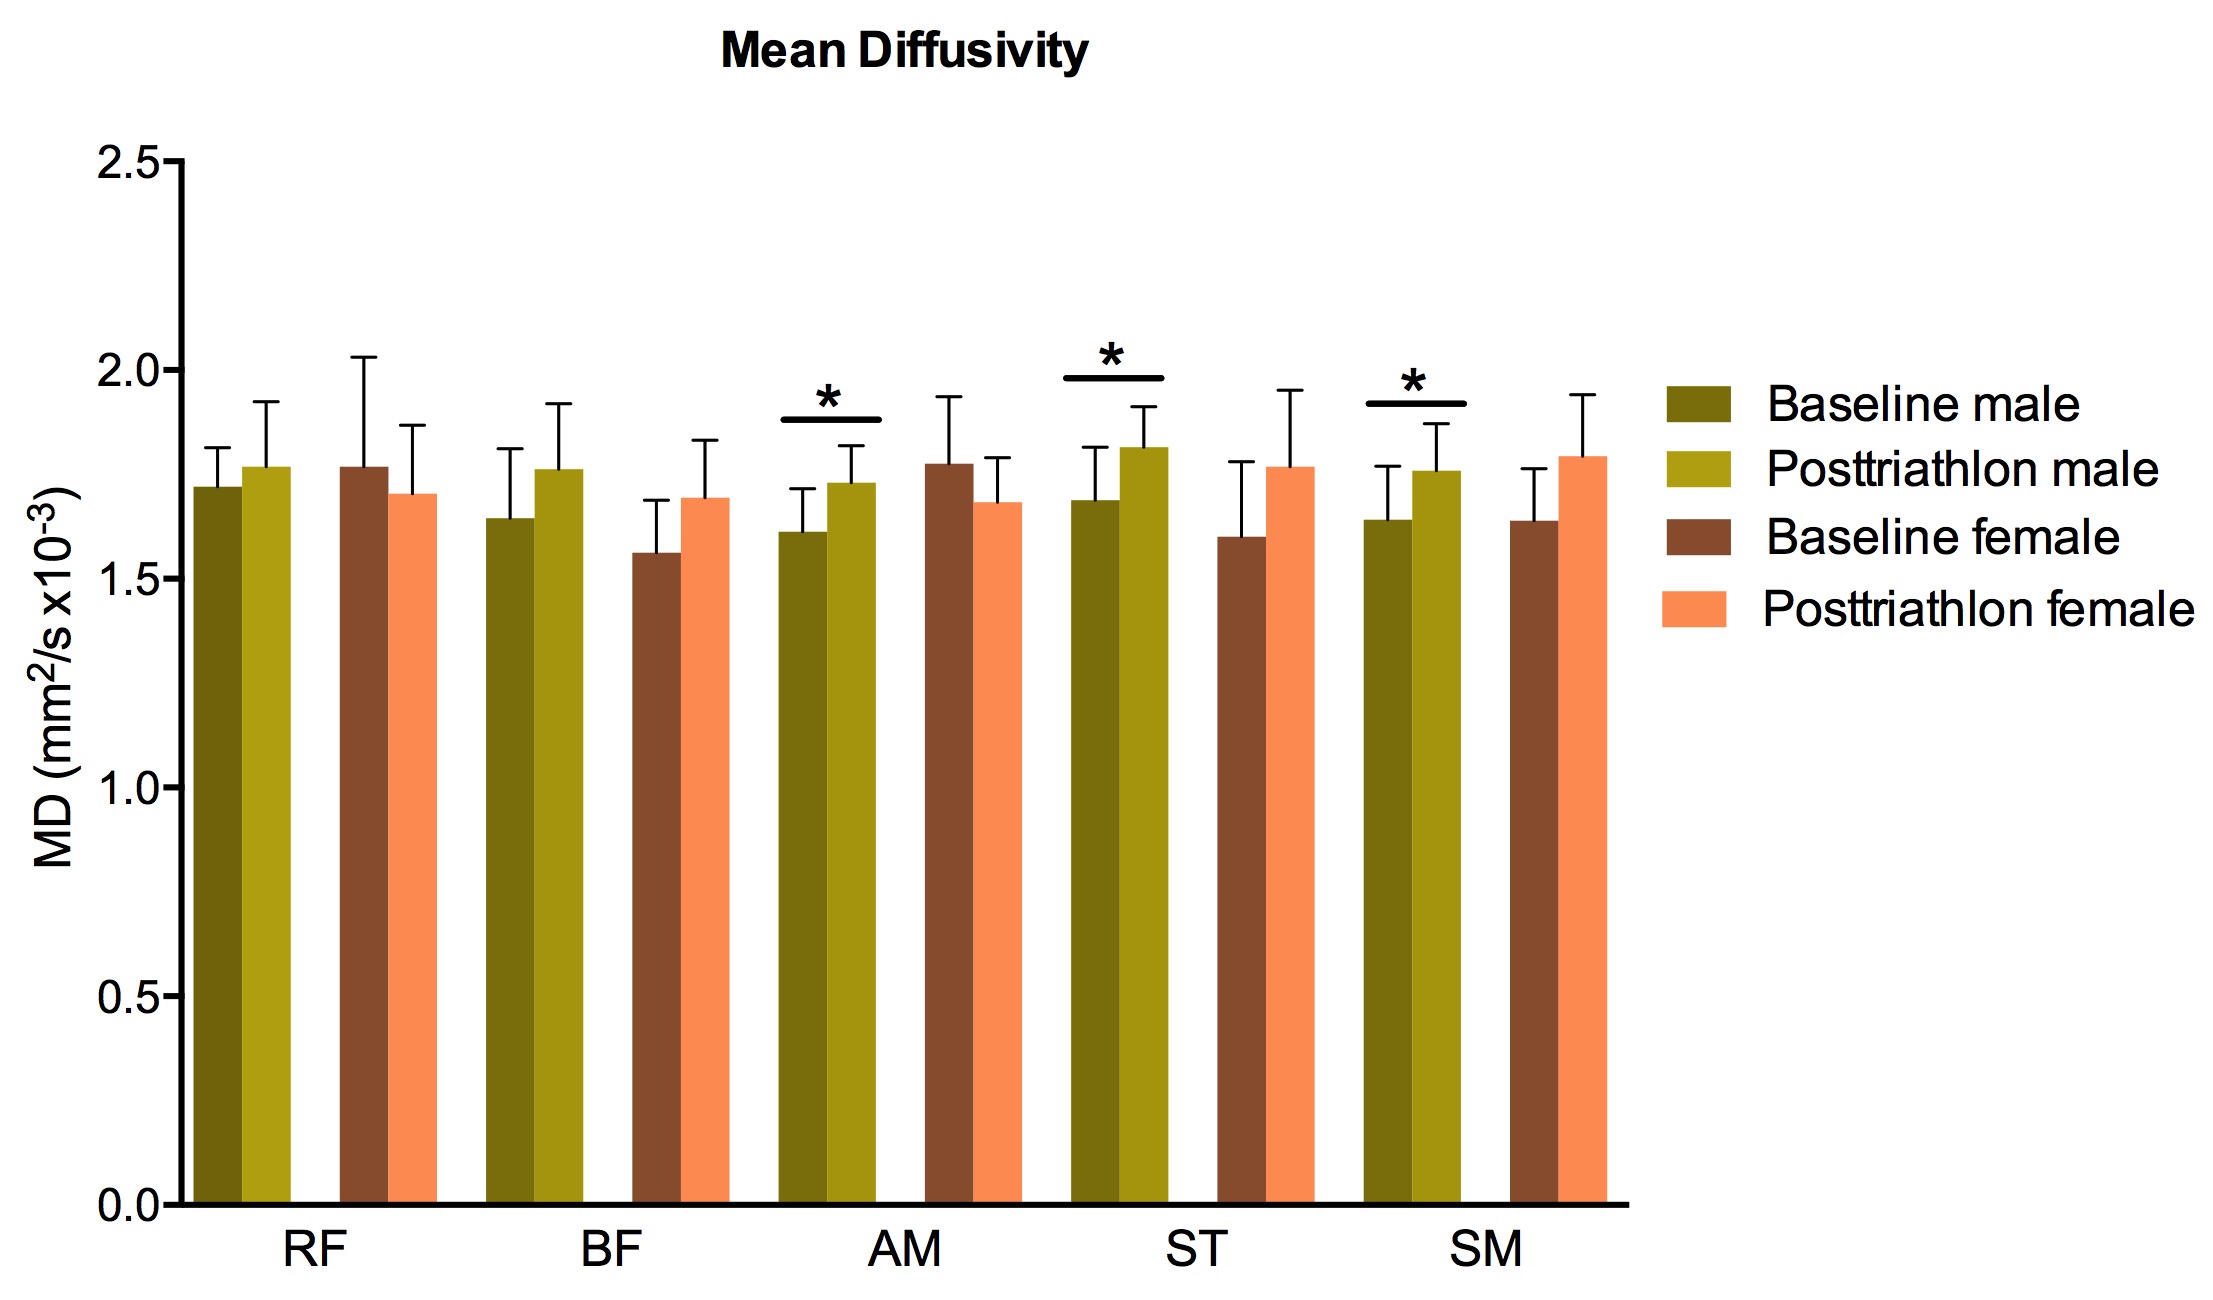
In the ii) crossover approach we found a significant increase of MD and eigenvectors in the post-triathlon measurement compared to baseline in AL, ST and SM muscle in the male cohort (Fig. 4). In ST and SM muscle, there was a tendency towards FA reduction, which was significant in SM muscle. In general, there was a tendency towards an increase in MD and a decrease in FA observed. However, no significant changes in T2 values, except for RF muscle in males. In females, DTI metrics showed similar tendencies with an increase in MD and a decrease in FA but without reaching significant difference. Although MFF was higher in all controls, there was no significant difference observed in the case-control and crossover study.
Discussion
This prospective case-control and crossover study analyses changes in muscle properties caused by professional training and excessive exercise. Our results indicate that high daily training levels introduce an increase of T2 in male triathletes but do not cause significant shifting in DTI metrics. Previous studies suggested that exercise-dependent changes in protein concentration and pH increase the volume of intracellular space, which is reflected on T2. On the contrary excessive exercise performed during triathlon causes an acute decrease in FA and increase in MD and eigenvalues, indicating water diffusion is less restricted, which may be related to interstitial edema, cell swelling, or disruption of diffusivity barriers from a subtle muscle injury2. A trend towards shifting of T2 and DTI metrics similar to that in the male cohort was also observed in female athletes but without significant, which is likely caused by less statistical power due to the small female study cohort.Conclusion
The combined assessment of quantitative T2 and DTI parameters is a feasible tool to evaluate steady and acute changes in muscle properties caused by professional training and excessive exercise.Acknowledgements
No acknowledgement found.References
1. Galban CJ, Maderwald S, Stock F, Ladd ME. Age-related changes in skeletal muscle as detected by diffusion tensor magnetic resonance imaging. J Gerontol A Biol Sci Med Sci 2007; 62:453-8.2.
2. Froeling M, Oudeman J, Strijkers GJ, Maas M, Drost MR, Nicolay K et al. Muscle changes detected with diffusion-tensor imaging after long-distance running. Radiology 2015; 274:548-62.3.
3. Okamoto Y, Mori S, Kujiraoka Y, Nasu K, Hirano Y, Minami M. Diffusion property differences of the lower leg musculature between athletes and non-athletes using 1.5T MRI. MAGMA 2012; 25:277-84.4.
4. Ma J. Dixon techniques for water and fat imaging. J Magn Reson Imaging 2008; 28:543-58.
Figures