1340
Quantitative evaluation and correlation analysis withperiacetabular muscle MRI in children with Slipped Capital Femoral Epiphysis (SCFE)1Department of Radiology, Shengjing Hospital of China Medical University, Shenyang, China, 2Department of Radiology, The First Affiliated Hospital of Jinzhou Medical University, Jinzhou, China, 3Department of Radiology, Liaoning Electric Power Center Hospital, Shenyang, China, 4Philips Healthcare, Beijing, China, 5Cancer Research UK Cambridge Institute, University of Cambridge, Cambridge, United Kingdom
Synopsis
This work compared theperiacetabular skeletal muscle between the healthy and the affected sides for the slipped capital femoral epiphysis (SCFE) patients using MRI. The correlation was studied between the disease progression and the muscle atrophy or fat infiltration to provide a potential criteria in MR images for the
Introduction
As a non-invasive diagnose method, MRI can reflect the cross-sectional area of the skeletal muscle and the fat infiltration, which are closely related to the muscle strength. The pathogenesis of SCFE is found related to many factors such as biomechanics, endocrine, and radiotherapy, among which skeletal muscle strength is an important biomechanical factor [1-3] and has been increasingly studied for its role in periacetabular diseases[4].The purpose of this study was to evaluate the periacetabular muscle cross-sectional area (M-CSA) and fat infiltration (FI) of SCFE patients and their roles in SCFE pathogenesis, and to provide new imaging biomarkers for SCFE diagnosis.Methods
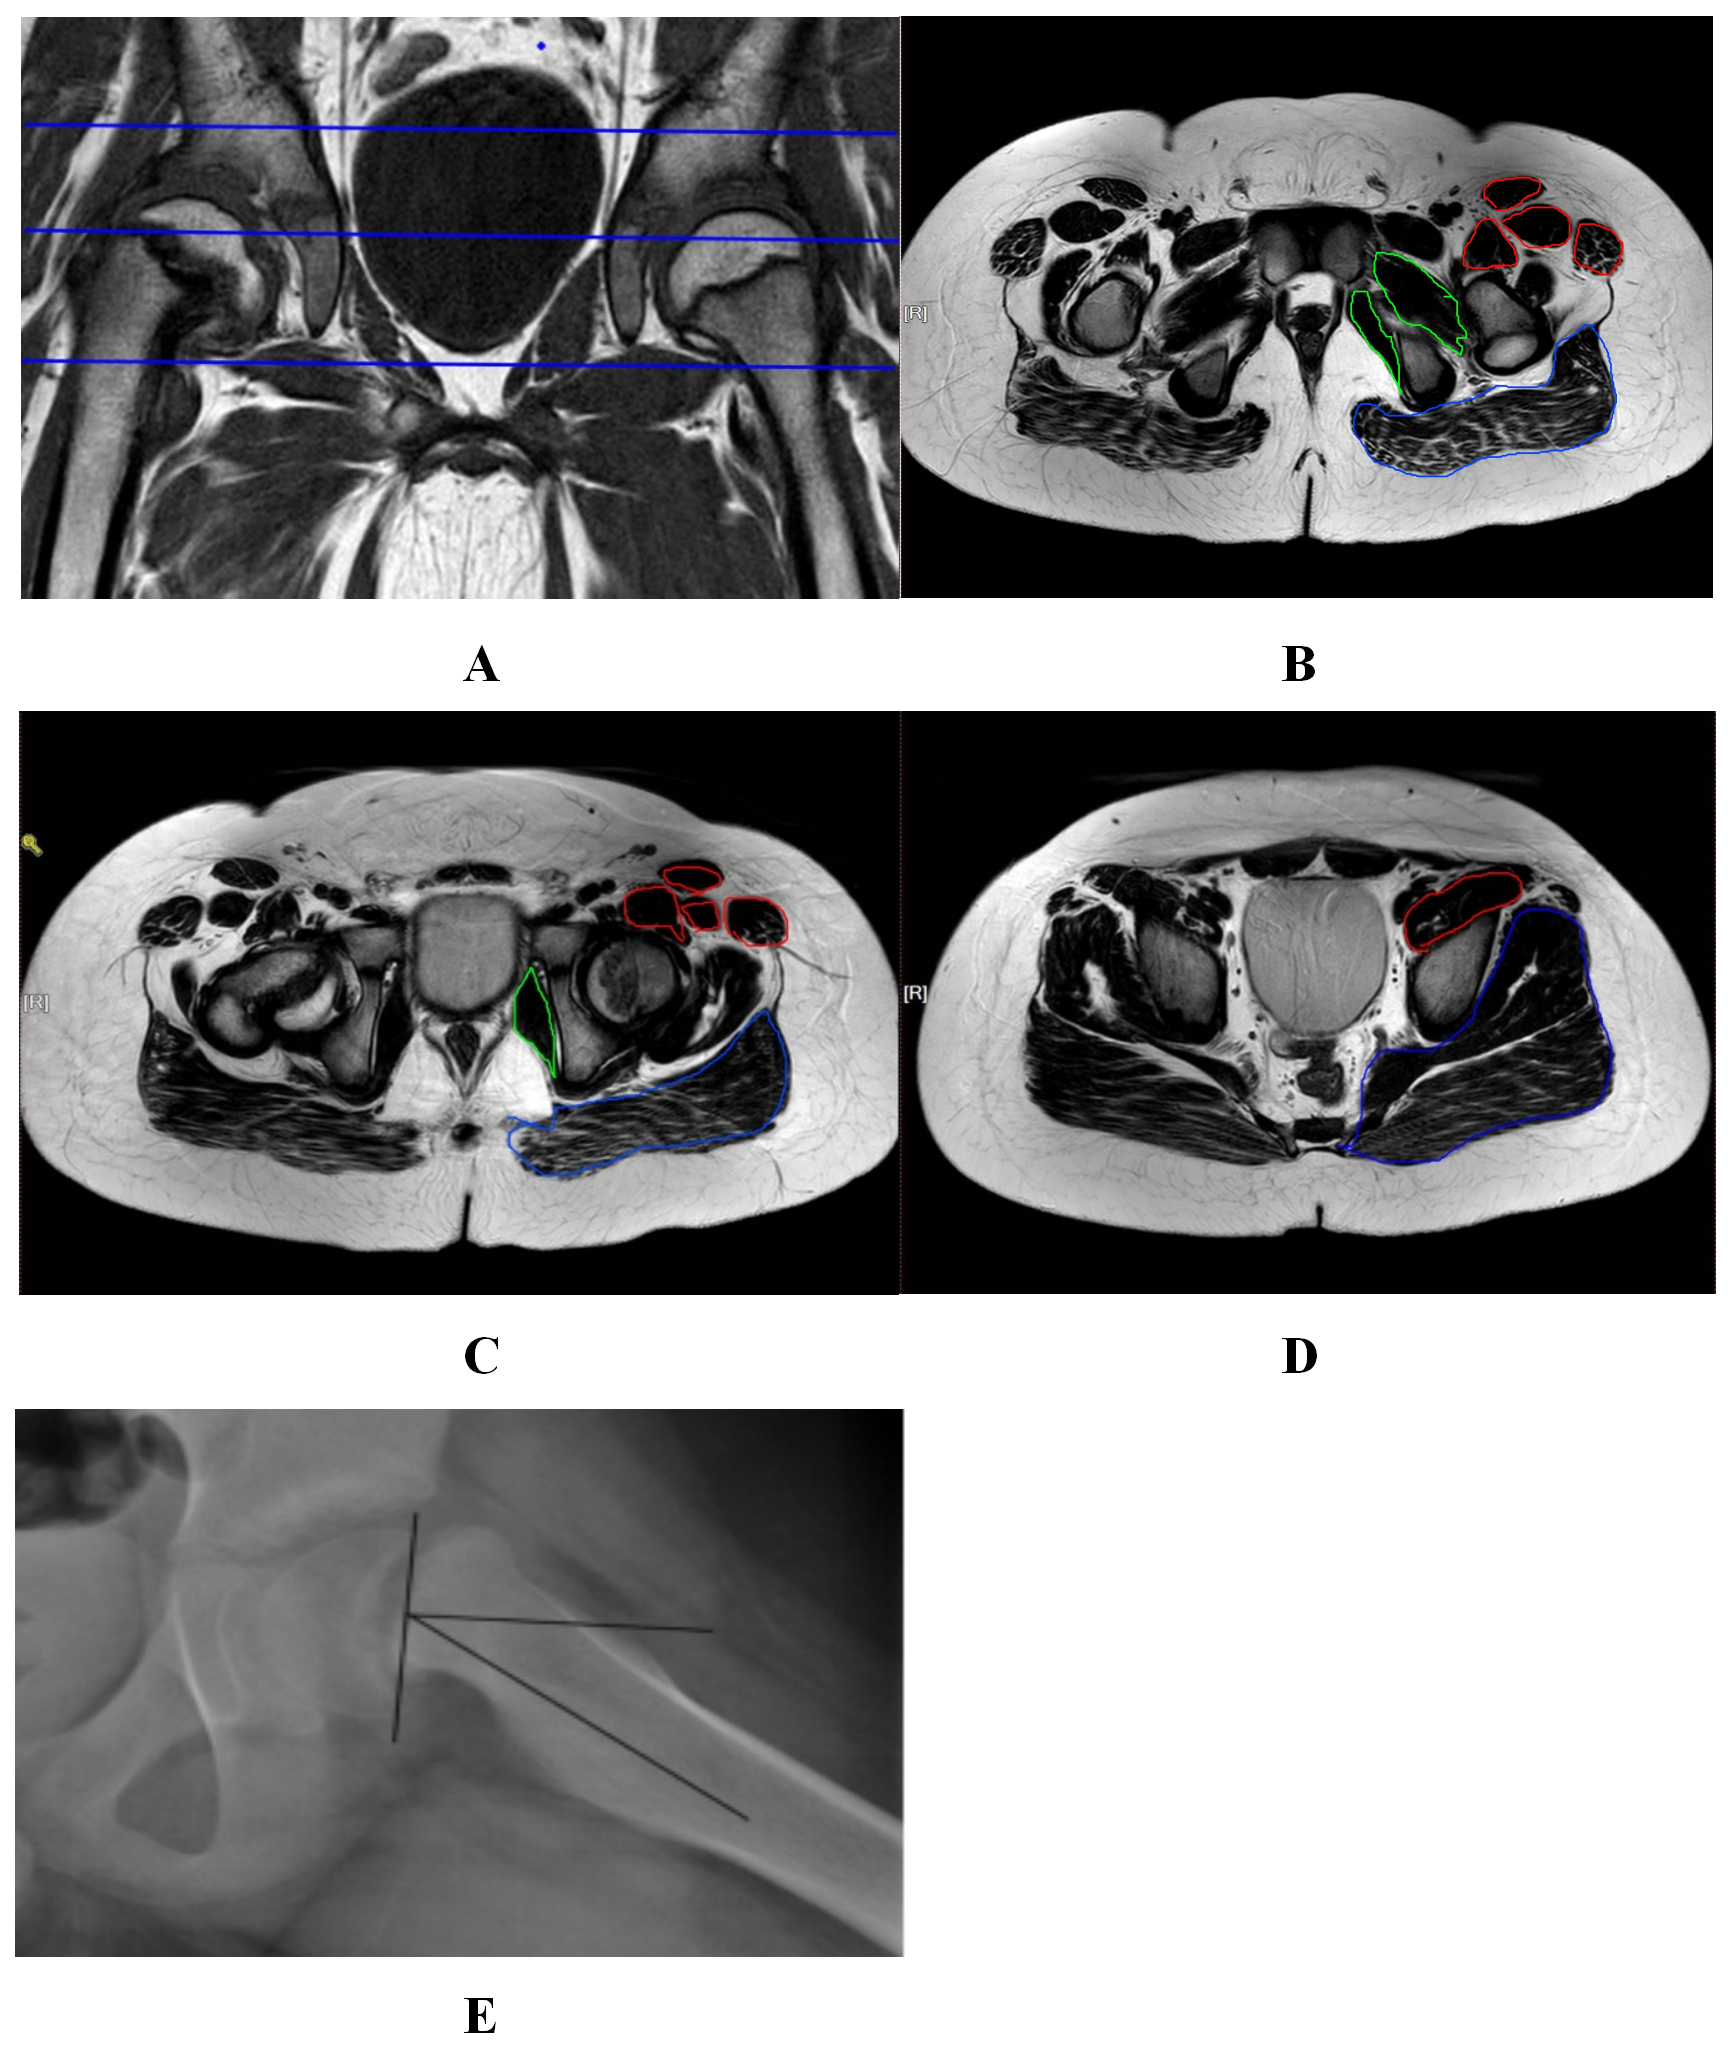
In total 35 subjects, 25 patients diagnosed with SCFE and 10 healthy volunteers, were scanned with MRI at 3.0 T (Philips, Best, Netherlands) with 8 channel phase-arrayed coil and supine position. Images were collected using the following protocols: routine coronal T1W and T2W, axial T1W and T2W, and coronal and sagittal T2W with fat suppression. Two trained radiologists evaluated the M-SCA and FI [5] based on the axial T1W and T2W images at 3 different slices (Figure 1): 2cm above the femoral head, femoral head - greater trochanter, and pubic symphysis. The evaluation was performed separately for 3 different muscle groups: the anterior or flexor group, the medial or the external rotator group, and the posterior or the extensor group.The lateral slip angle (LESA) was also measured to assess the severity of femoral head slip. Independent t-test was used to compare the healthy volunteers and the patients for the muscle atrophy and fat infiltration, and the Pearson correlation test was performed to analyze the correlation between the LESA and muscle atrophy / fat infiltration. P < 0.05 indicates the statistical significance.Results
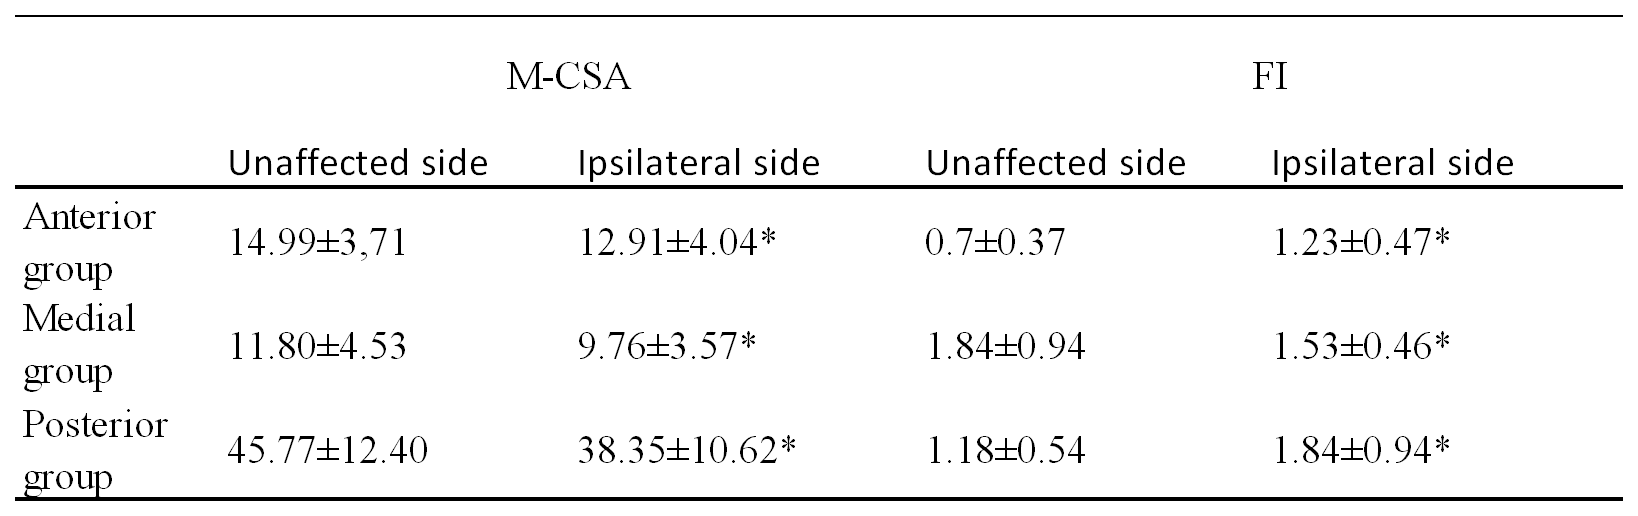
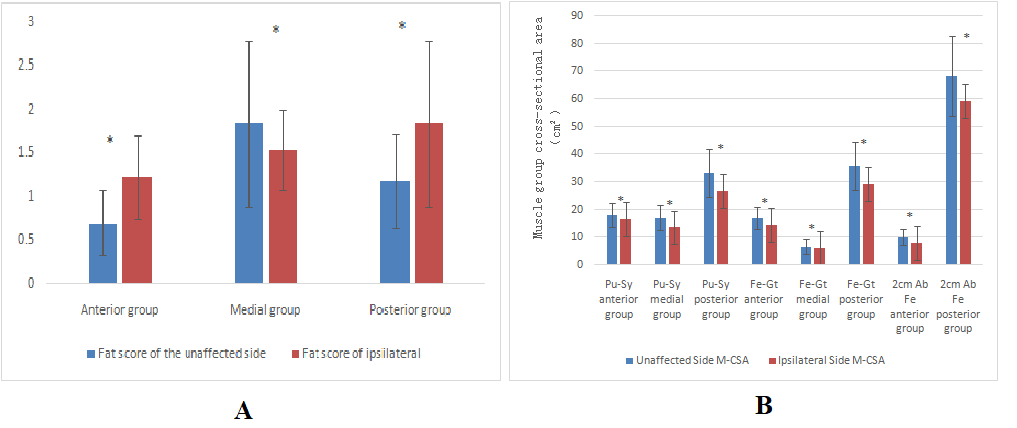
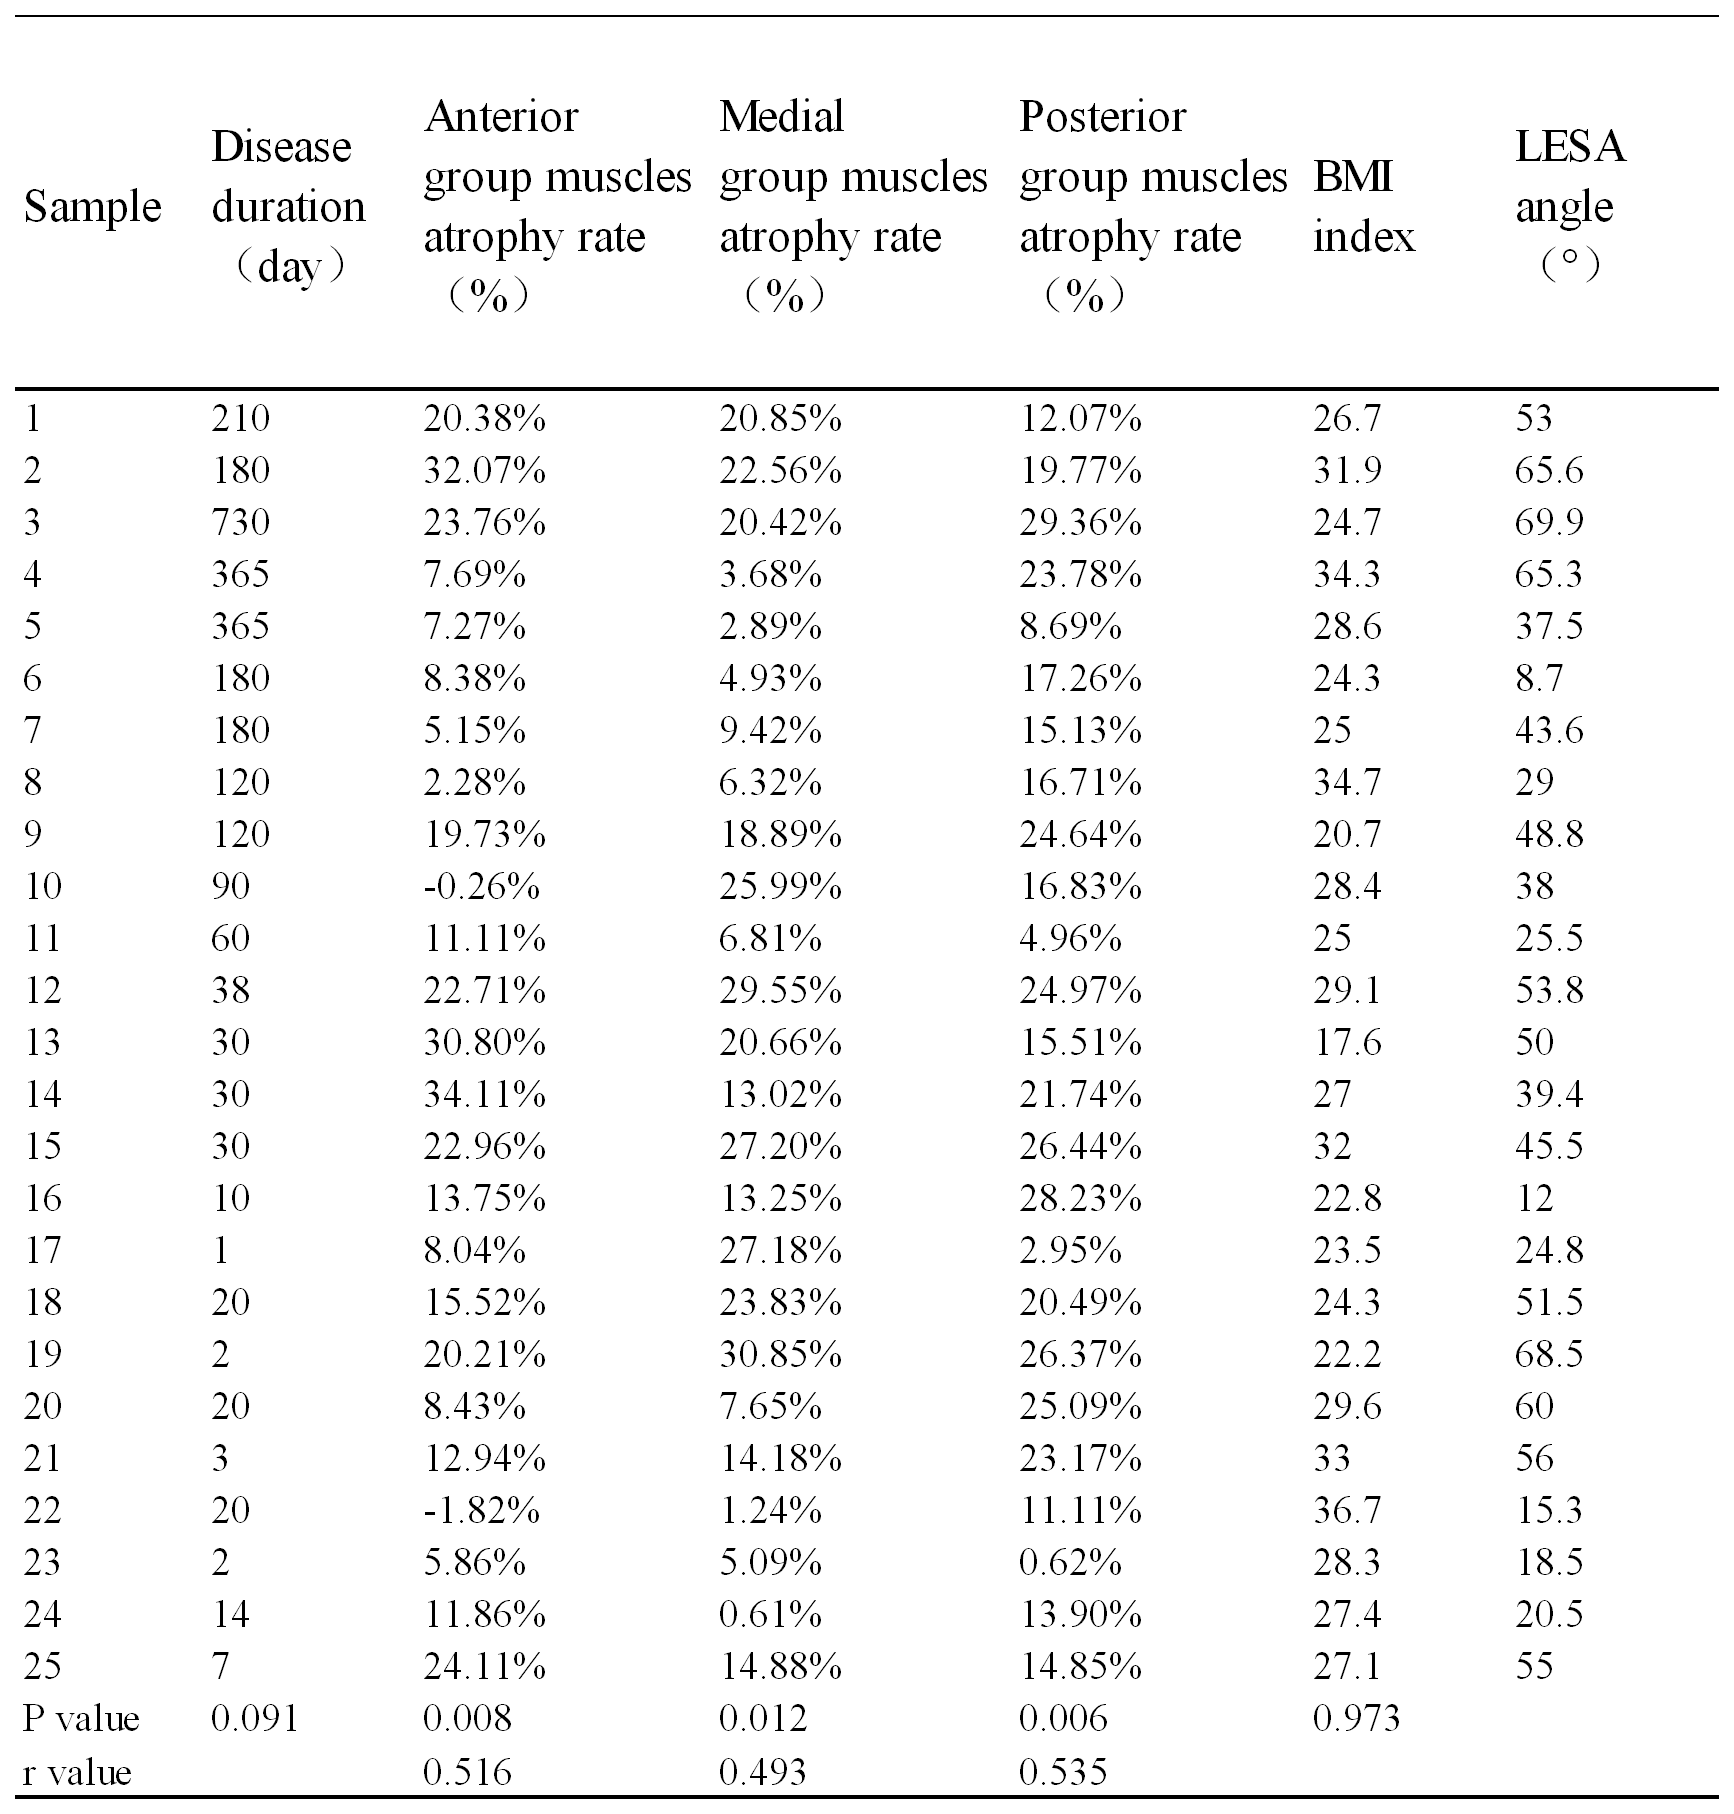
There was a significant difference (Figure 2) in the M-CSA and FI scores between the sick side and the healthy side (Figure 3, P < 0.05), where FI value followed: posterior >medial> anterior group. With the Pearson test, the muscle atrophy of all three groups was significantly correlated with LESA Angle (Figure 4), with P < 0.05 and r = 0.516, 0.493, and 0.535, respectively.The greater the degree of hip muscle atrophy in SCFE patients, the more serious the SCFE slippage .Discussion
Watelain E et al.reported that hip muscles play an important role in flexion and internal and external rotations of lower limbs while standing and walking [6].Asymmetrical fat infiltration in bilateral hip muscles can affect the gait quality and limb coordination, which is related to the claudication of SCFE children [7].In this work, muscular atrophy and fat infiltration were both significantly higher in the affected side of SCFE than that in the healthy side. In addition, the mean atrophy-extent of M-CSA was positively correlated with LESA, which meant that the epiphysis slip was more pronounced in SCFE patients with a higher muscle atrophy.This is likely because the support to the hip was reduced as the progression of the disease, and, in the meanwhile, the child became obese with a heavy burden on the lower limb, leading to more severe SCFE at the age of rapid bone growth. Muscular atrophy and fat infiltration measured with MRIcan potentially become the screening criteria for early SCFE detection at the pre-slip stage. SCFE should be considered when the adolescent patients were treated for violent injuries to the hip, especially if MR imaging presented bilateral muscle group size asymmetry and fat infiltration on one side.Conclusion
The fat infiltration and atrophy of periacetabular skeletal muscle in SCFE patients leads to the weakness of muscle strength,therefore reduces the protective effect for hip, which is a favorable factor for the pathogenesis of SCFE. Periacetabular muscle atrophy and fat infiltration measured with MRI are possible early indicators for SCFE diseases to avoid delay in diagnosis and treatment.Acknowledgements
We thank Philips Healthcare for the support to this study.References
1. Galbraith RT, Gelberman RH, Hajek PC, Baker LA, Sartoris DJ, Rab GT, Cohen MS, Griffin PP. Obesity and decreased femoral anteversion in adolescence. J Orthop Res. 1987;5(4):523-528.
2. Gelberman RH, Cohen MS, Shaw BA, Kasser JR, Griffin PP, Wilkinson RH. The association of femoral retroversion with slipped capital femoral epiphysis. J Bone Joint Surg Am. 1986;68(7):1000-1007.
3. Pritchett JW, Perdue KD. Mechanical factors in slipped capital femoral epiphysis. J Pediatr Orthop. 1988;8(4):385-388.
4. Boutin Robert D,Bamrungchart Sara,Bateni Cyrus P et al. CT of Patients With Hip Fracture: Muscle Size and Attenuation Help Predict Mortality.Am J Roentgenol, 2017;208(6): W208-W215.
5. Fischer D, Kley RA, Strach K, et al. Distinct muscle imaging patterns in myofibrillar myopathies. Neurology.2008;71 (10): 758-765.
6. Watelain E, Dujardin F, Babier F, Dubois D, Allard P. Pelvic and lower limb compensatory actions of subjects in an early stage of hip osteoarthritis. Archives of Physical Medicine and Rehabilitation 2001;82:1705-1711.
7. Rosenlund S, Holsgaard-Larsen A, Overgaard S, Jensen C. The Gait Deviation Index Is Associated with Hip Muscle Strength and Patient-Reported Outcome in Patients with Severe Hip Osteoarthritis—A Cross-Sectional Study. PLoS ONE. 2016;11(4):e0153177.
Figures