1338
Pulse sequence and reconstruction methods for extraction of spatial variation in multicomponent T2 relaxation for diagnosis of fluid and muscle disorders1Electrical Engineering & Computer Science, Massachusetts Institute of Technology, Cambridge, MA, United States, 2David H. Koch Institute For Integrative Cancer Research, Massachusetts Institute of Technology, Cambridge, MA, United States, 3Department of Materials Science and Engineering, Massachusetts Institute of Technology, Cambridge, MA, United States
Synopsis
Significant unmet diagnostic need exists for diseases characterized by changes in T2 relaxation properties of tissue, especially those related to changes in fluid volume status and muscle disorders. Current methods for quantifying these disorders, such as MRI, are resource-intensive limiting widespread adoption. We introduce a novel method of quantitative tissue separation using single-sided magnetic resonance sensors. We explore pulse sequences and fitting techniques to characterize distinct tissue compartments in heterogeneous samples. We then extend these techniques to in vitro and in vivo models, and we finally apply them to measure the progression of acute muscle edema in an animal model.
Background and Purpose
Many fluid volume and muscle disorders are characterized by changes in tissue fluid distribution. Disorders of the kidney (end-stage renal disease) and heart (congestive heart failure) lead to accumulation of excess free fluid in the muscle compartment (edema).
There is no objective, efficient method to track disease progression or treatment response for many of these diseases. A measure of free fluid within tissue would improve management of these diseases by providing an objective measure of progression and response.
Here, we first describe methods to isolate and assess the multicomponent T2 MR signal originating from muscle tissue despite the presence of subcutaneous tissue via in vitro and in vivo models (Figure 1-4). Then, we apply these techniques towards the measurement of onset and recovery of acute muscle edema (Figure 5).
Methods and Results
Muscle-fat separation using B1 frequency and multicomponent T2 relaxometry
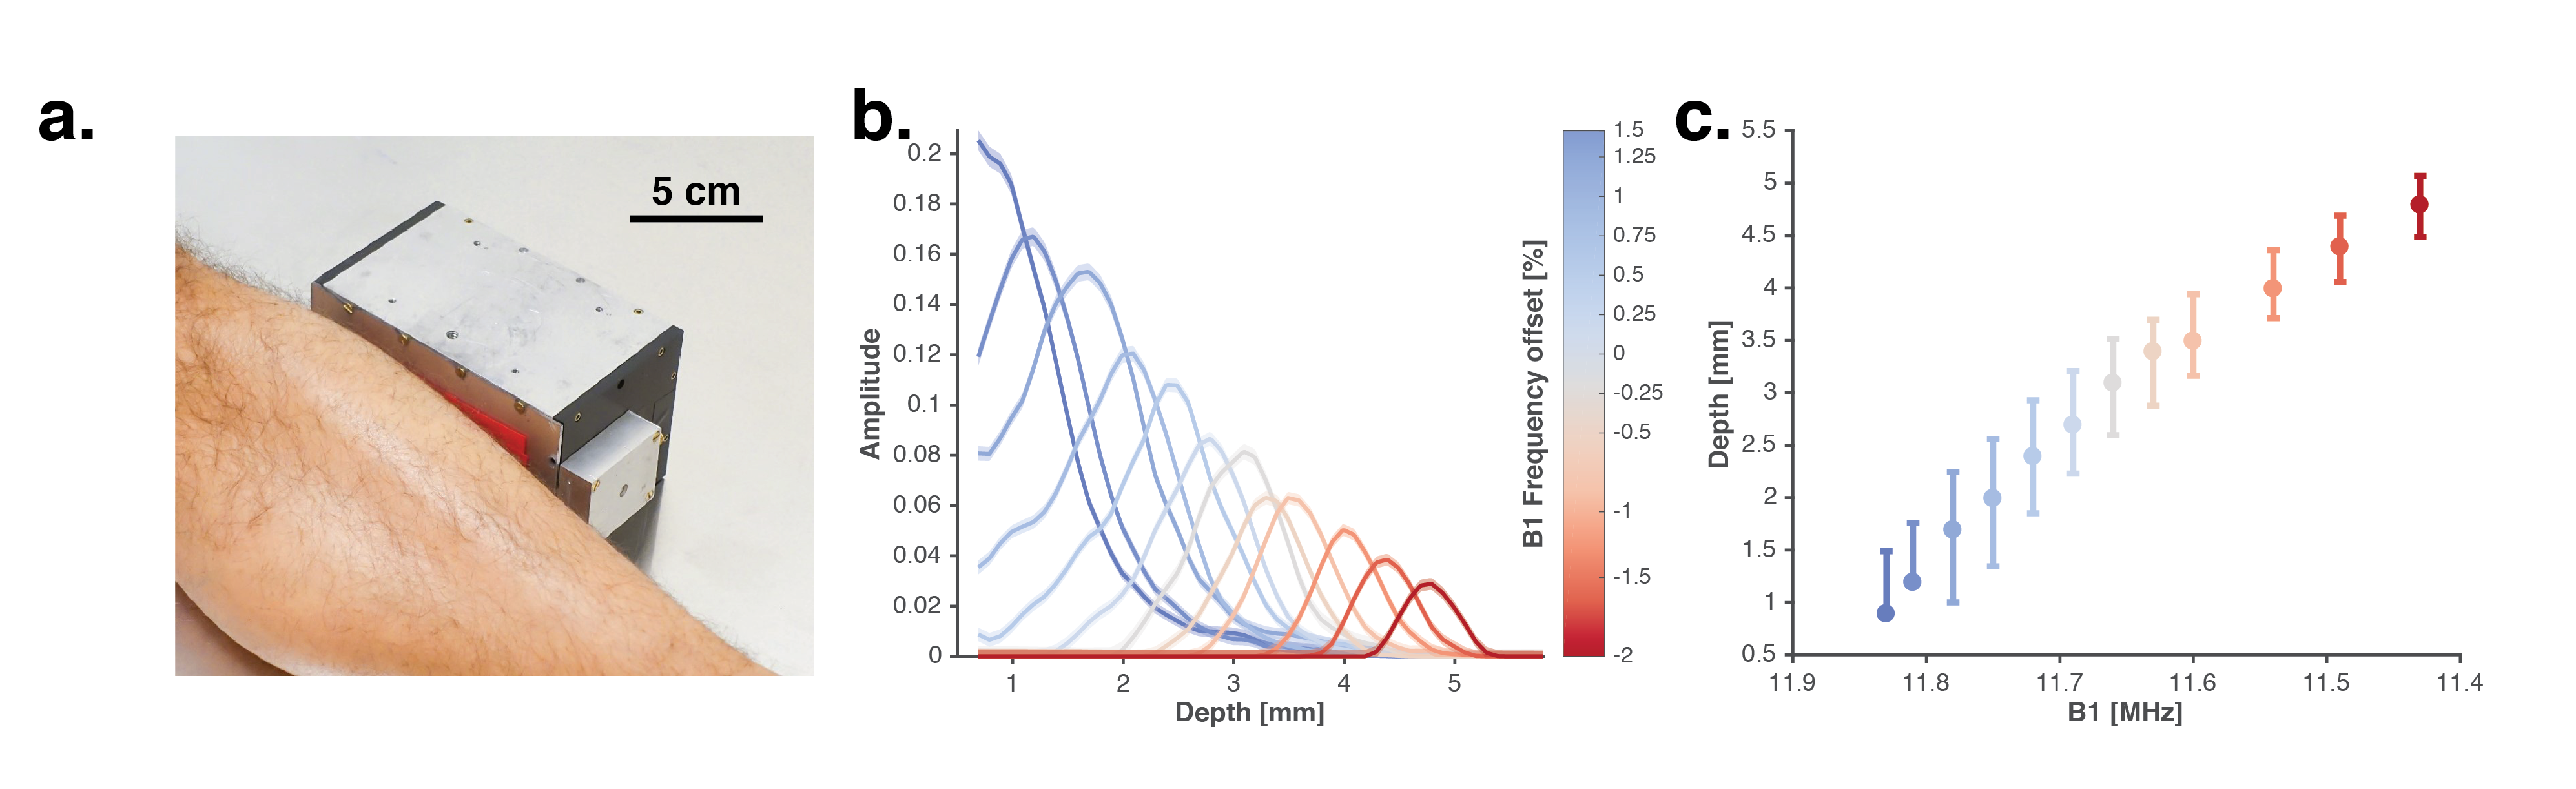
Portable, single-sided MR sensors allow measurement of samples remote from the sensor surface. Our portable sensor acquires a T2 decay via CPMG from the lower leg of a human subject (Figure 1a). Tuning RF pulse frequency allows for spatial selection of the sensitive region of our MR sensor (Figure 1b-c). Tuning RF pulse frequency offers control over the fraction of proximal subcutaneous versus more distal muscle tissue signal during acquisition.
Quantification of muscle-fat fraction and tissue thickness through in vitro and in vivo models
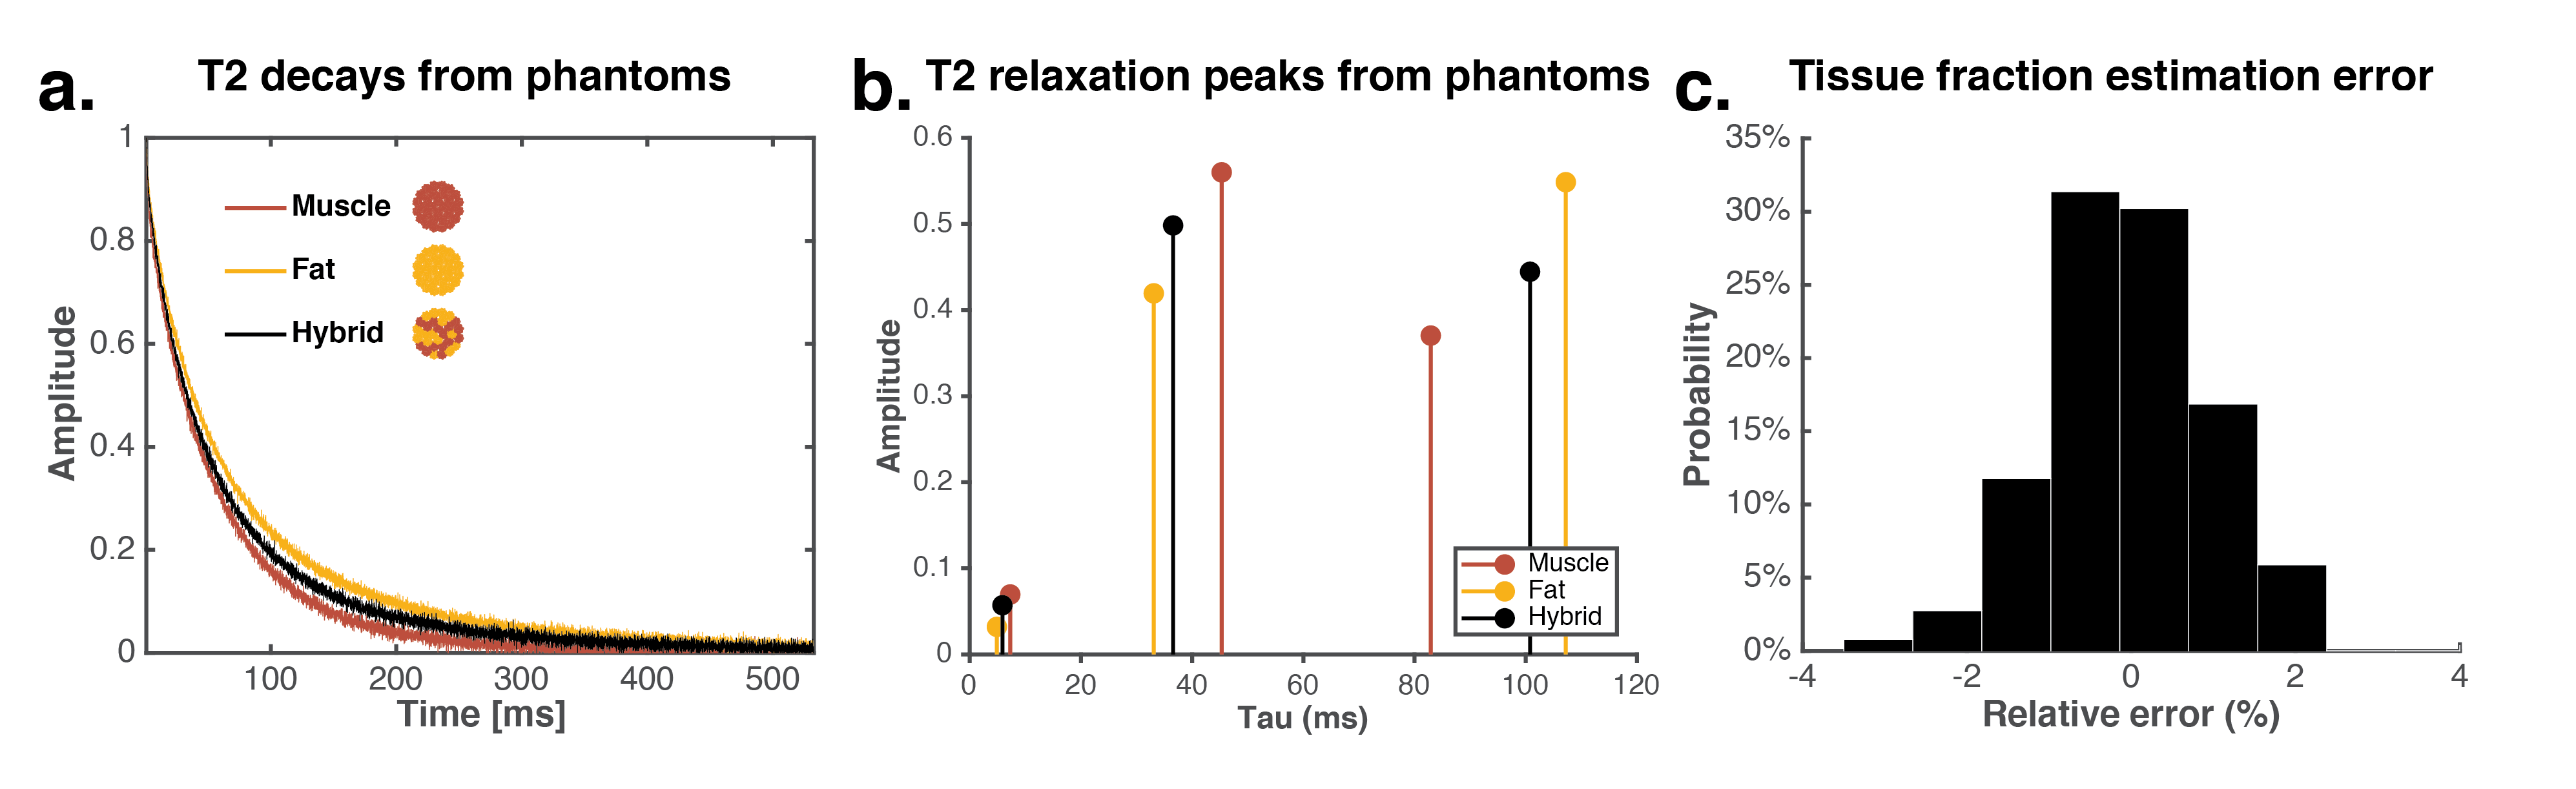
Multicomponent T2 relaxometry performed with our portable MR sensor allows quantification of tissue fractions in a heterogeneous hybrid ex vivo sample consisting of both muscle and fat tissue (Figure 2a-c). A triexponential fit of the hybrid sample identifies relaxation peaks between those of pure fat and pure muscle (Figure 1b). A novel, generative, iterative algorithm – first trained on the relaxation peaks of pure fat and muscle – is able to reconstruct the composition of a hybrid tissue sample to within 2% error.
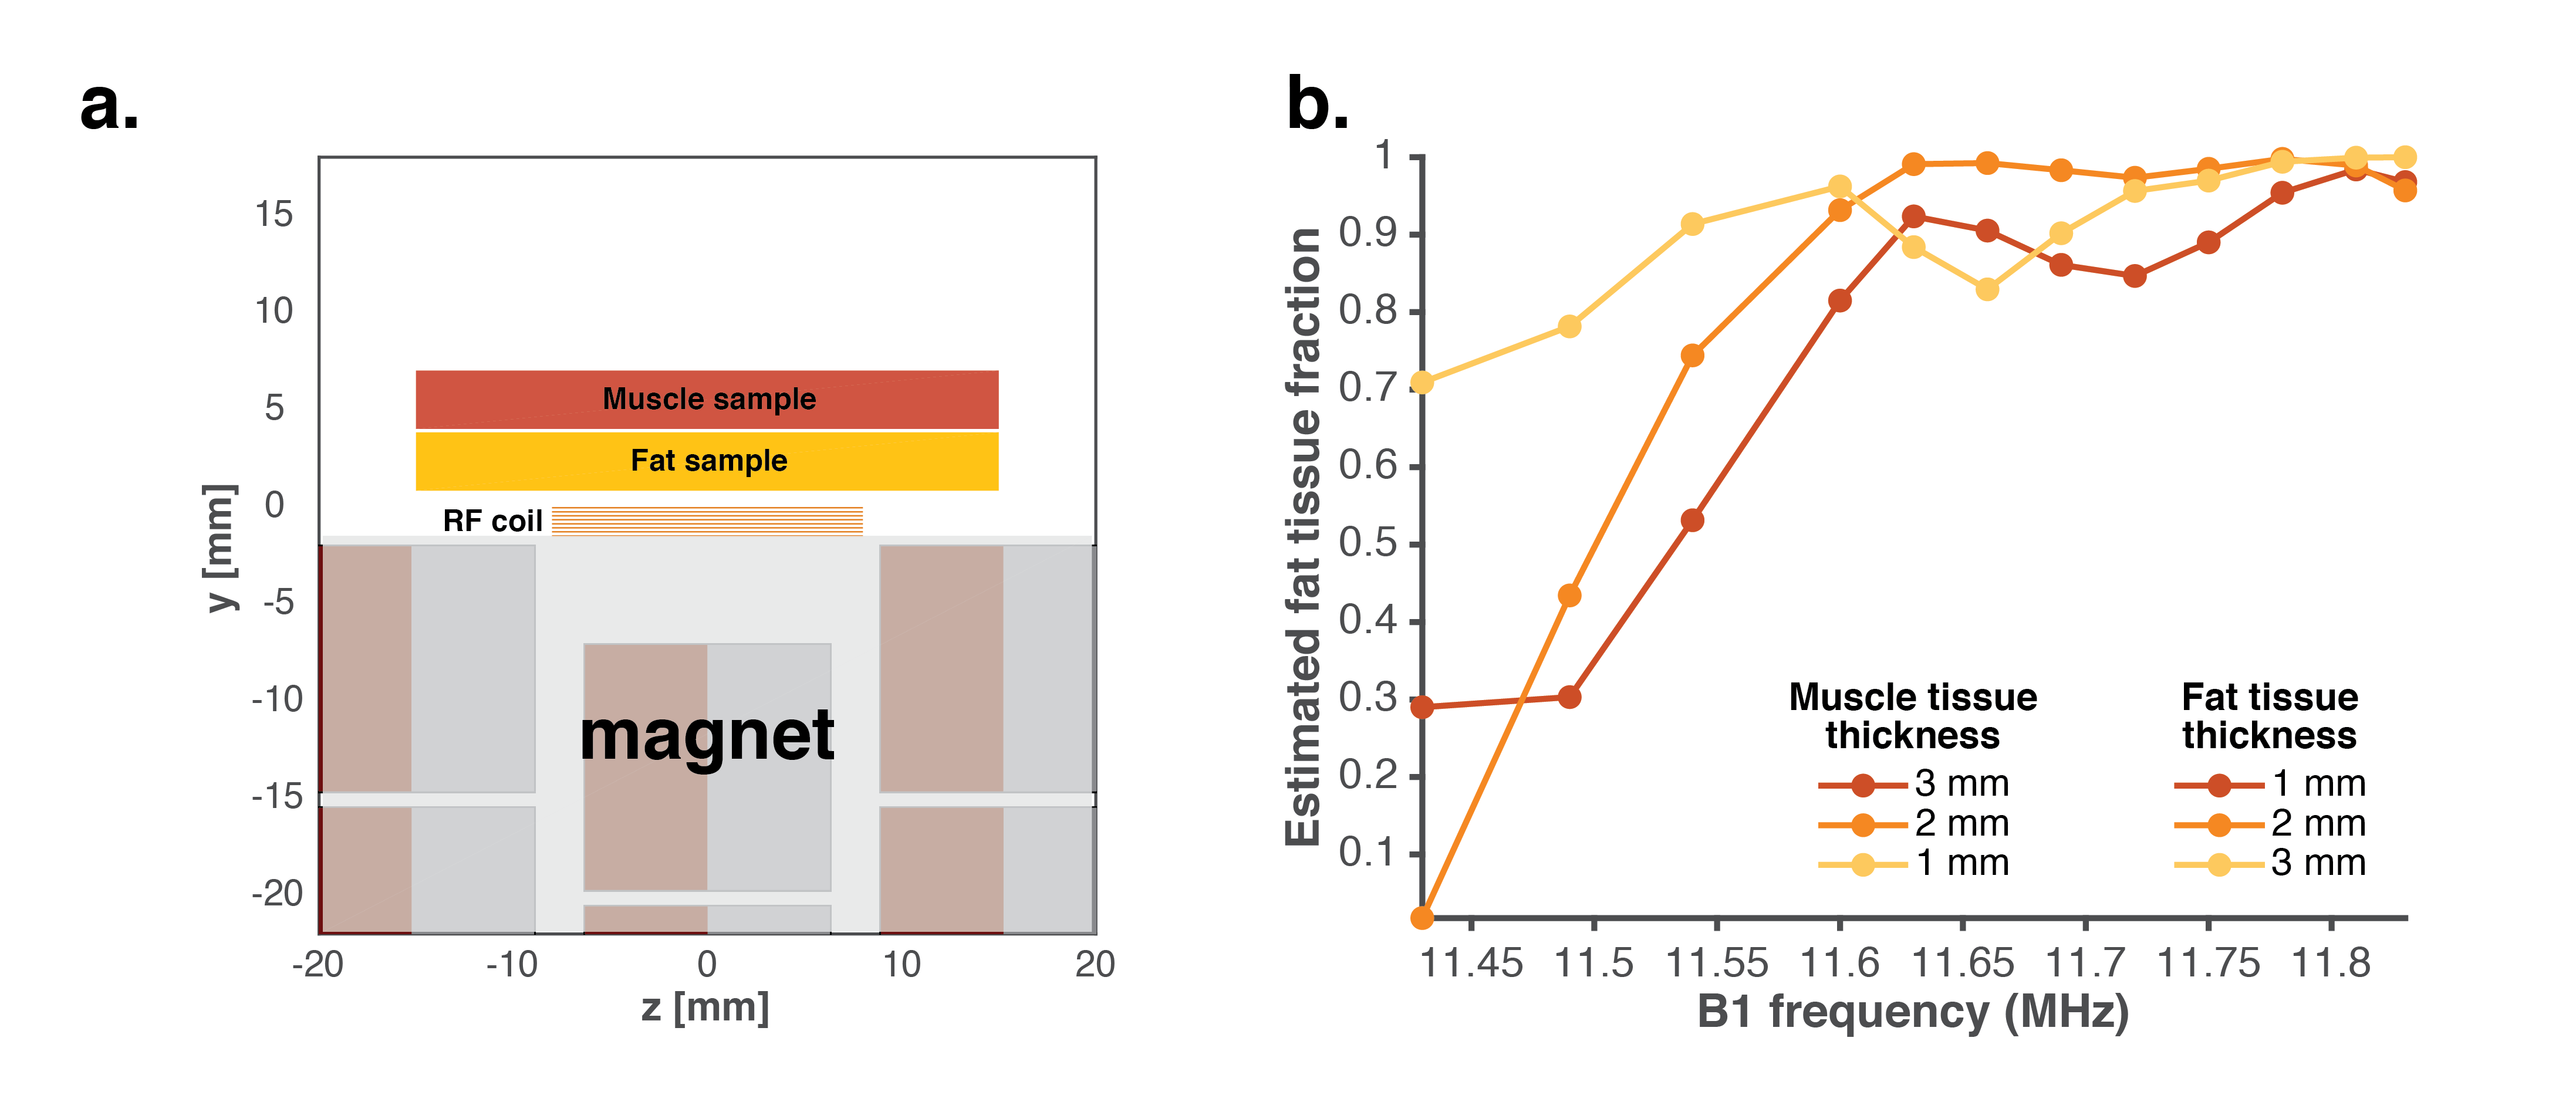
We then combine this technique with the spatial selectivity offered by varying B1 frequency to estimate the thickness of distinct synthetic muscle and subcutaneous tissue layers via an in vitro model. Experiments were performed by measuring a phantom consisting of two fluid compartments of variable thickness (Figure 3a). Each compartment, designed to represent muscle or fat, consisted of unique aqueous CuSO4 solutions mimicking in vivo relaxation rates of muscle and fat tissue. CPMG measurements of these phantoms at varied B1 frequencies shows a larger fat tissue fraction at higher B1 frequencies (Figure 3b) as expected from the depth profiling data (Figure 1b).
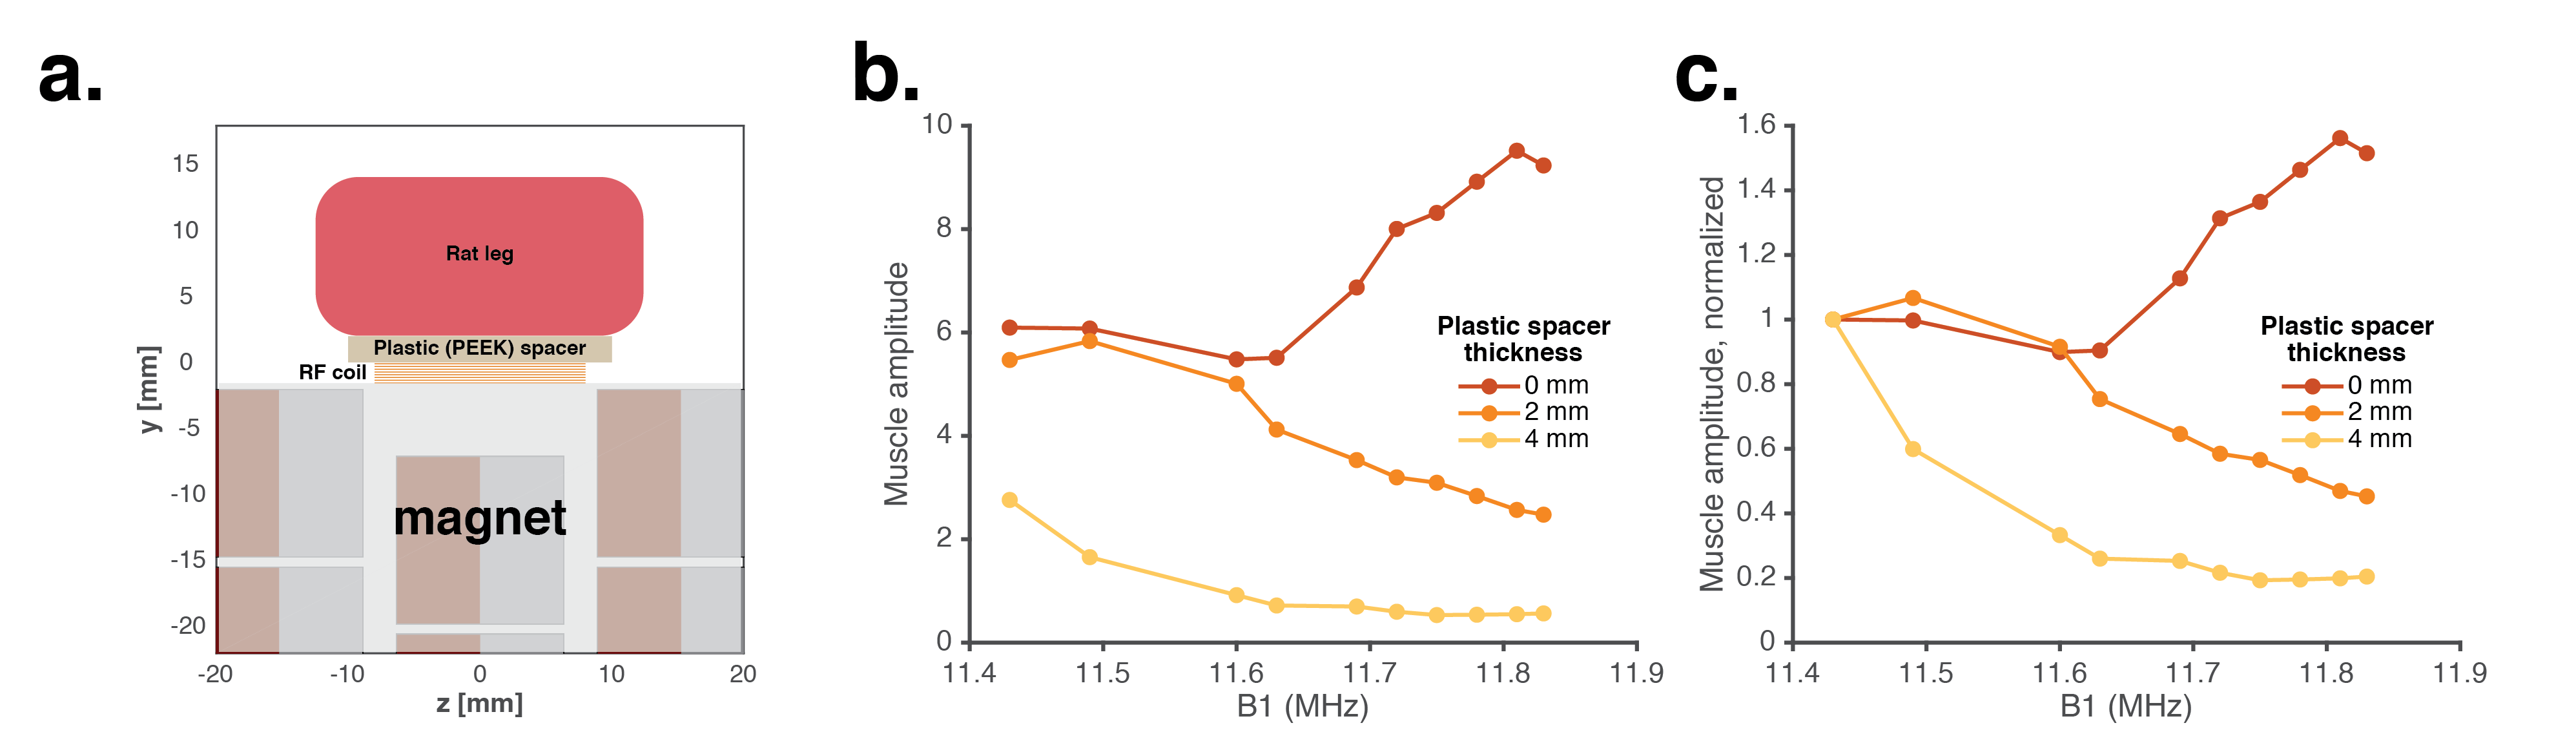
Finally, we demonstrate the ability to measure an offset between muscle tissue and surface of the sensor through an in vivo model. A rat leg was scanned at various distances from the sensor (Figure 4a). Varying the B1 frequency allows and multicomponent relaxometry allows identification of the signal contribution from the muscle fluid compartment in vivo (Figure 4b-c). Lower RF frequencies are able to localize the MR measurement to the muscle compartment when it is located 4 mm from the sensor, suggesting a similar approach could target the muscle compartment in patients with subcutaneous tissue that otherwise confound muscle measurements.
Identification of onset and recovery of muscle edema via muscle localization and separation techniques
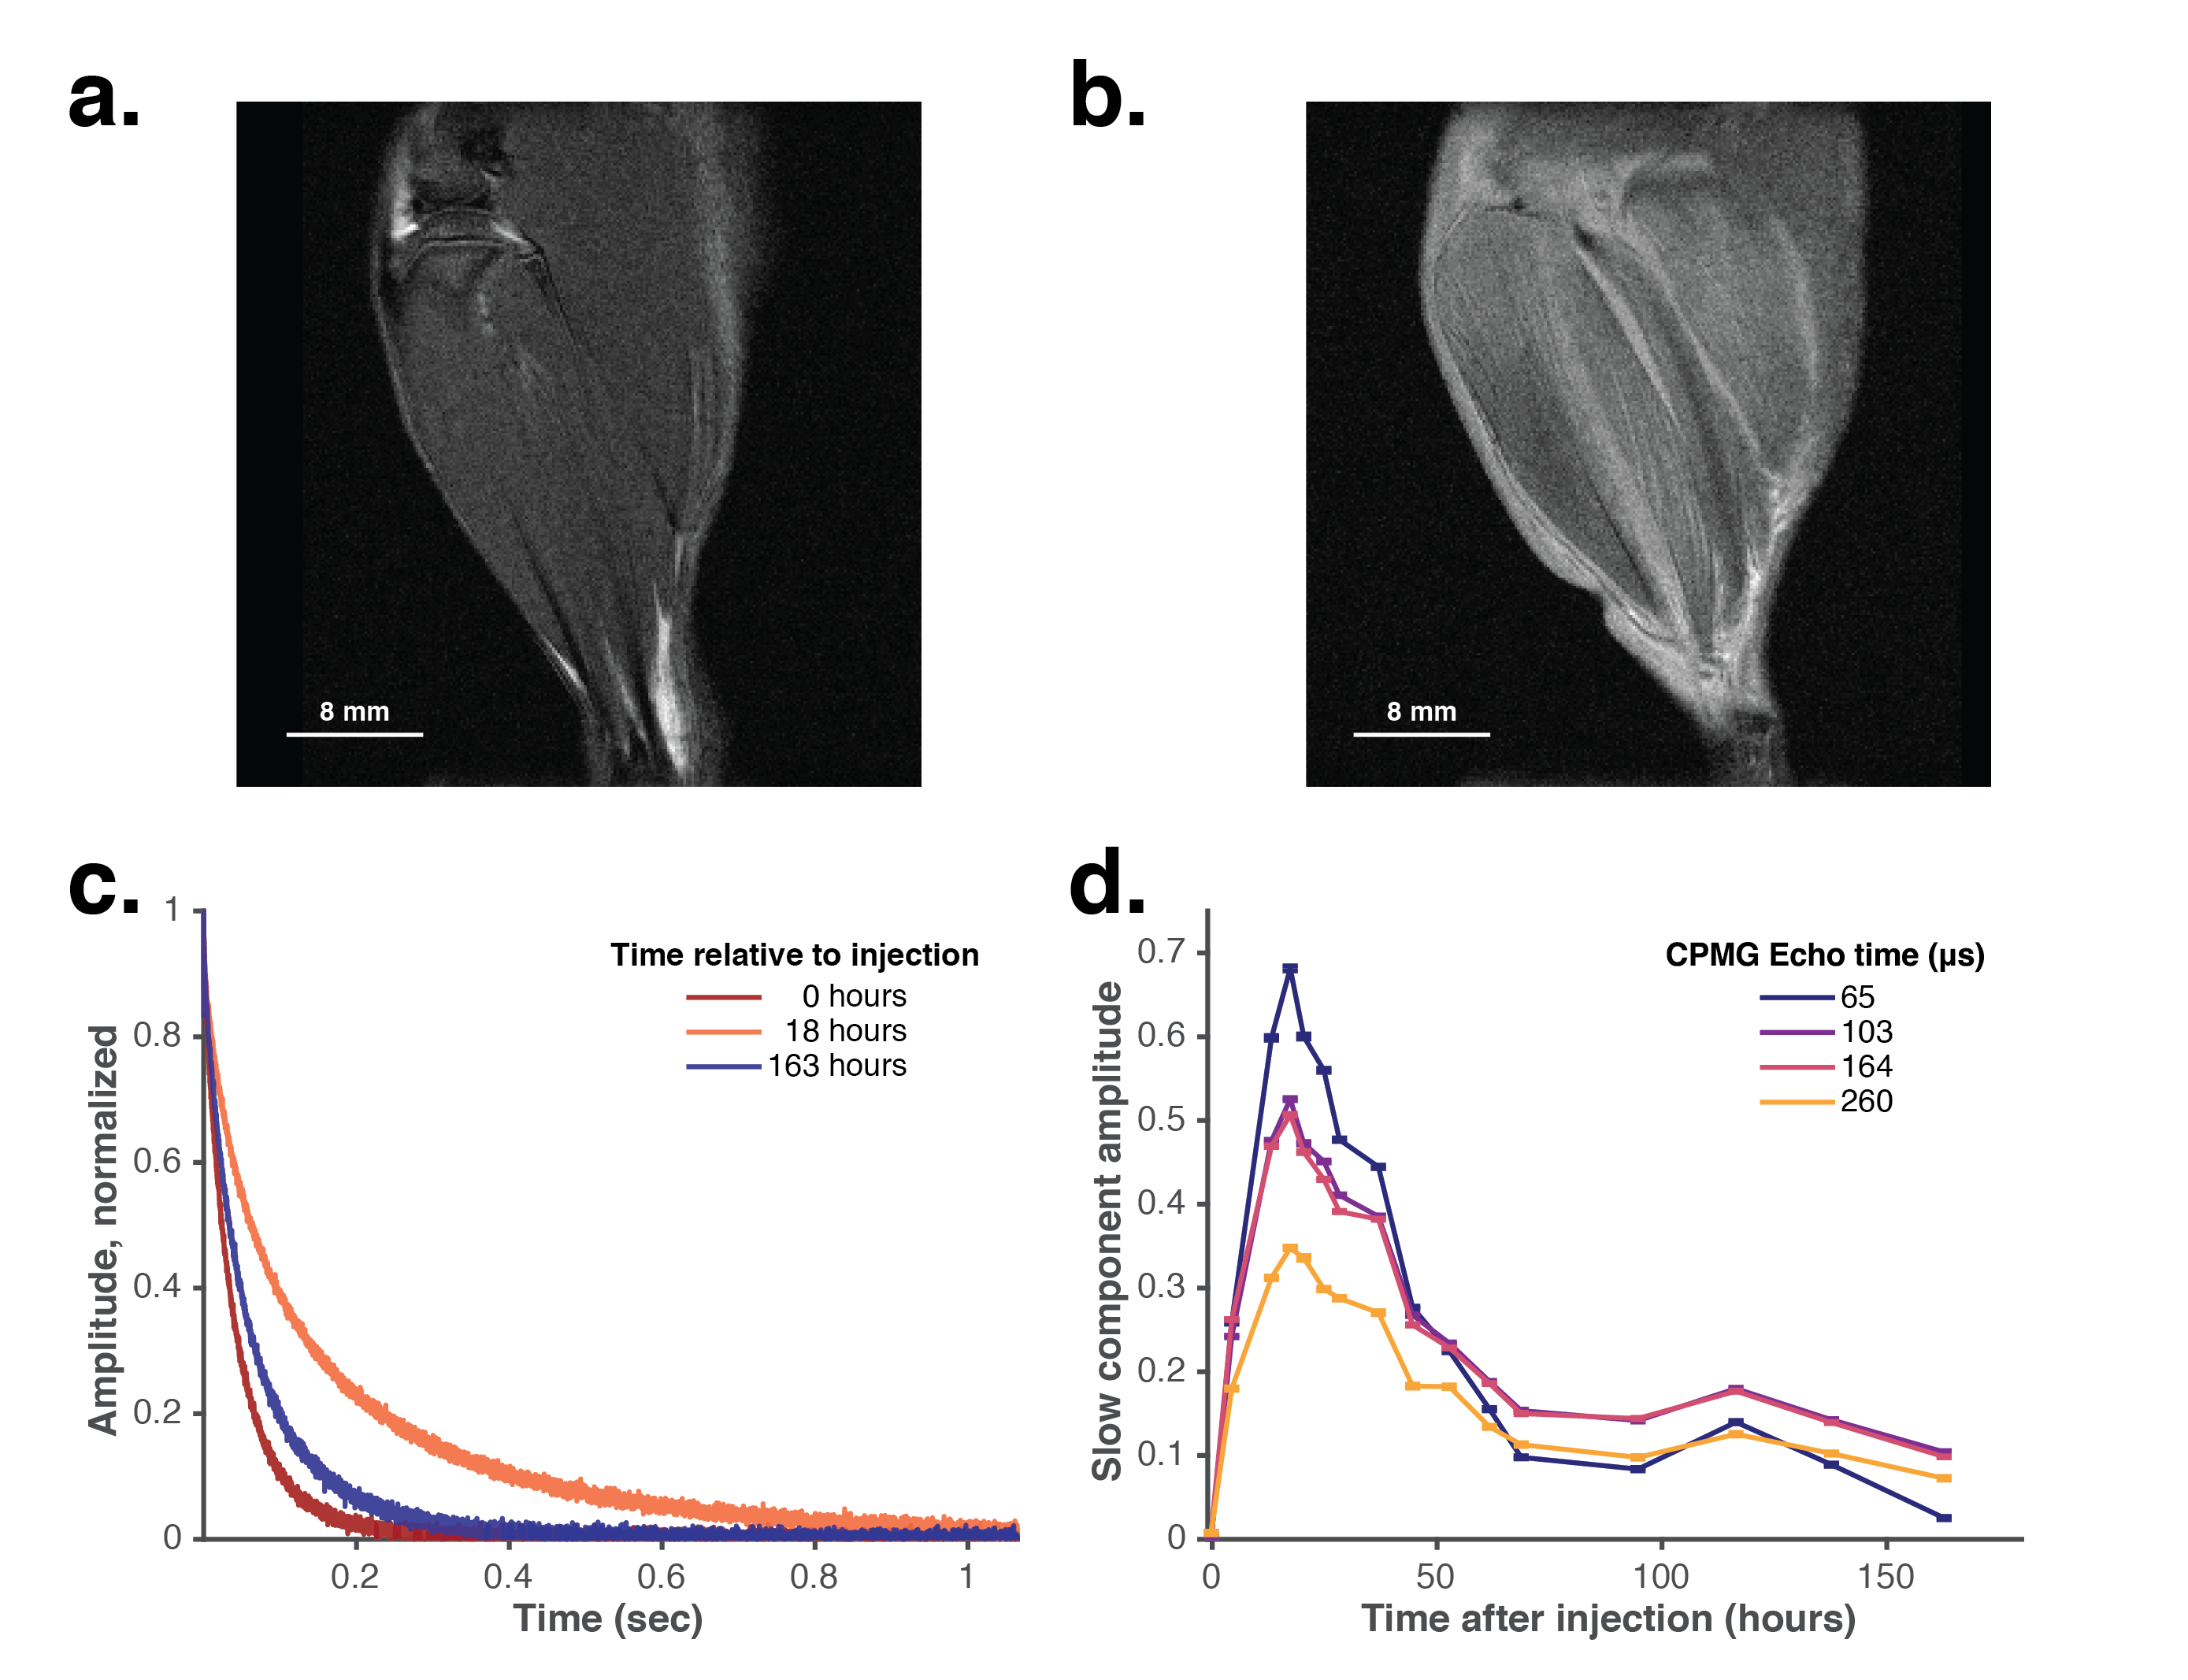
Muscle edema is characterized by an increase of free fluid in the muscle compartment. We induced acute muscle edema in the lower leg of a rat via an intramuscular injection of λ-carrageenan in one leg while the contralateral leg served as a control. T2-weighted MRI shows localized muscle edema as increased brightness on the experimental leg (Figure 5b) versus control leg (Figure 5a). Our MR sensor tracks onset of edema and recovery to baseline over a 7 day period (Figure 5c). Increasing the echo time of CPMG pulse sequence increases the diffusion attenuation during T2 relaxation. Signals acquired with greater echo times exhibit increased diffusion attenuation during the edematous period (~12-50 hours post injection) in the slow component due to an increase in free fluid during this period (Figure 5d).
Discussion and Conclusion
We first demonstrate that varying RF excitation frequency and reconstruction of tissue fraction via multicomponent T2 relaxometry can isolate the signal to distinct tissue compartments. We validate our methodology using in vitro and in vivo experiments designed to mimic the geometry of the lower leg in a human. Finally, we demonstrate the identification of and monitoring of progression of muscle edema in an animal model.
Quantifying fluid and muscle disorders using a portable, low-cost, non-invasive MR sensor enables clinicians to track disease progression and response to treatment over time enabling improved treatment decision making and, ultimately, long-term patient outcomes.
Acknowledgements
We thank the Koch Institute Swanson Biotechnology Center for technical support, specifically whole animal imaging core facility. We thank Gregory Ekchian, Richard Joshua Murdock, Max Cotler, Jason Stockmann, Matt Rosen, Jacob White, and Elfar Adalsteinsson for helpful discussions; Elizabeth Zhang and Brooke McGoldrick for assistance with instrumentation and experimental support. Funding: This work was supported in part by MIT Institute for Soldier Nanotechnologies (United States Army Research Office Grant W911NF-13D-0001); National Institutes of Health – National Cancer Institute Centers of Cancer Nanotechnology Excellence Grant U54 CA151884-02, and the Koch Institute Support (core) grant P30-CA14051 from the National Cancer Institute. AB was supported by a Fannie & John Hertz Foundation Graduate Fellowship and a National Science Foundation Graduate Fellowship.References
[1] S. Dhamija, T. Major, S. Liachenko, Quantification of Acute Peripheral Muscle Edema in Rats using MRI, (n.d.).
[2] H. Nose, G.W. Mack, X.R. Shi, E.R. Nadel, Shift in body fluid compartments after dehydration in humans, J. Appl. Physiol. (Bethesda, Md. 1985). 65 (1988) 318–324. http://www.ncbi.nlm.nih.gov/pubmed/3403475.
[3] S.N. Cheuvront, R.W. Kenefick, Dehydration: Physiology, assessment, and performance effects, Compr. Physiol. 4 (2014) 257–285. doi:10.1002/cphy.c130017.
[4] M. Li, C.C. Vassiliou, L.A. Colucci, M.J. Cima, (1)H nuclear magnetic resonance (NMR) as a tool to measure dehydration in mice., NMR Biomed. 28 (2015) 1031–9. doi:10.1002/nbm.3334.
[5] O. Cvitanic, G. Henzie, N. Skezas, J. Lyons, J. Minter, MRI diagnosis of tears of the hip abductor tendons (gluteus medius and gluteus minimus), Am. J. Roentgenol. 182 (2004) 137–143.
[6] D.J. Theodorou, S.J. Theodorou, Y. Kakitsubata, Skeletal muscle disease: patterns of MRI appearances, Br. J. Radiol. 85 (2012) e1298–e1308.
[7] S. Cho, J.E. Atwood, Peripheral edema, Am. J. Med. 113 (2002) 580–586. doi:10.1016/S0002-9343(02)01322-0.
[8] K.G. Brodowicz, K. McNaughton, N. Uemura, G. Meininger, C.J. Girman, S.H. Yale, Reliability and feasibility of methods to quantitatively assess peripheral edema, Clin. Med. Res. 7 (2009) 21–31. doi:10.3121/cmr.2009.819.
[9] A. Bashyam, M. Li, M.J. Cima, Design and experimental validation of Unilateral Linear Halbach magnet arrays for single-sided magnetic resonance, J. Magn. Reson. (2018).
[10] Z. Ababneh, H. Beloeil, C.B. Berde, G. Gambarota, S.E. Maier, R. V. Mulkern, Biexponential parameterization of diffusion and T2 relaxation decay curves in a rat muscle edema model: Decay curve components and water compartments, Magn. Reson. Med. 54 (2005) 524–531. doi:10.1002/mrm.20610
[11] R.H. Fan, M.D. Does, Compartmental relaxation and diffusion tensor imaging measurements in vivo in λ‐carrageenan‐induced edema in rat skeletal muscle, NMR Biomed. An Int. J. Devoted to Dev. Appl. Magn. Reson. Vivo. 21 (2008) 566–573.[12] F. Casanova, J. Perlo, B. Blümich, Single-sided NMR, Springer Berlin Heidelberg, Berlin, Heidelberg, 2011. doi:10.1007/978-3-642-16307-4.
Figures