1337
IVIM imaging of muscle following moderate and high-intensity exercise1Department of Orthopaedic Surgery, University of California San Diego, La Jolla, CA, United States, 2Department of Nanoengineering, University of California San Diego, La Jolla, CA, United States, 3Department of Radiology, University of California San Diego, La Jolla, CA, United States
Synopsis
IVIM imaging provides insight into microvascular blood flow. Here, we investigate IVIM parameters following moderate and high-intensity exercise protocols, activating the plantar flexors and dorsiflexors of the leg. By interleaving b=0 images throughout the diffusion-weighted acquisition, we were additionally able to evaluate T2 changes following exercise. We observed an increase in T2 and diffusion coefficient, D, following high-intensity exercise. Changes were less obvious following moderate-intensity exercise.
Introduction
Muscle activity results in increased local blood flow and oxygen extraction. In contrast to the brain, the dynamic range of blood flow changes is much greater, changing from approximately 3 mL/min/100g at rest to 80 mL/min/100g or more following exercise1. T2-weighted imaging is sensitive to fluid shifts in the muscle following exercise2. Recently, intravoxel incoherent motion (IVIM) MRI has gained interest as a strategy to evaluate muscle blood flow changes3,4. IVIM uses diffusion-weighted images over a wide range of b-values, sensitizing the images not only to molecular diffusion but also microvascular blood flow (so-called pseudo-diffusion)5. The measured data are then fit to a bi-exponential model that describes both the contribution of microvascular blood flow and molecular diffusion as:
$$$\frac{S(b)}{S_{0}}=(1-f)e^{-bD}+fe^{-bD^{*}}$$$ [1]
Where S(b)/S0 is the measured data, normalized to by a non-diffusion-weighted acquisition, f is the perfusion fraction, D the diffusion coefficient, and D* the pseudo-diffusion coefficient.
Here, we aimed to evaluate T2 and IVIM signal changes in response to exercise of varying intensity. We hypothesize that IVIM will be sensitive to blood flow changes following exercise.
Methods
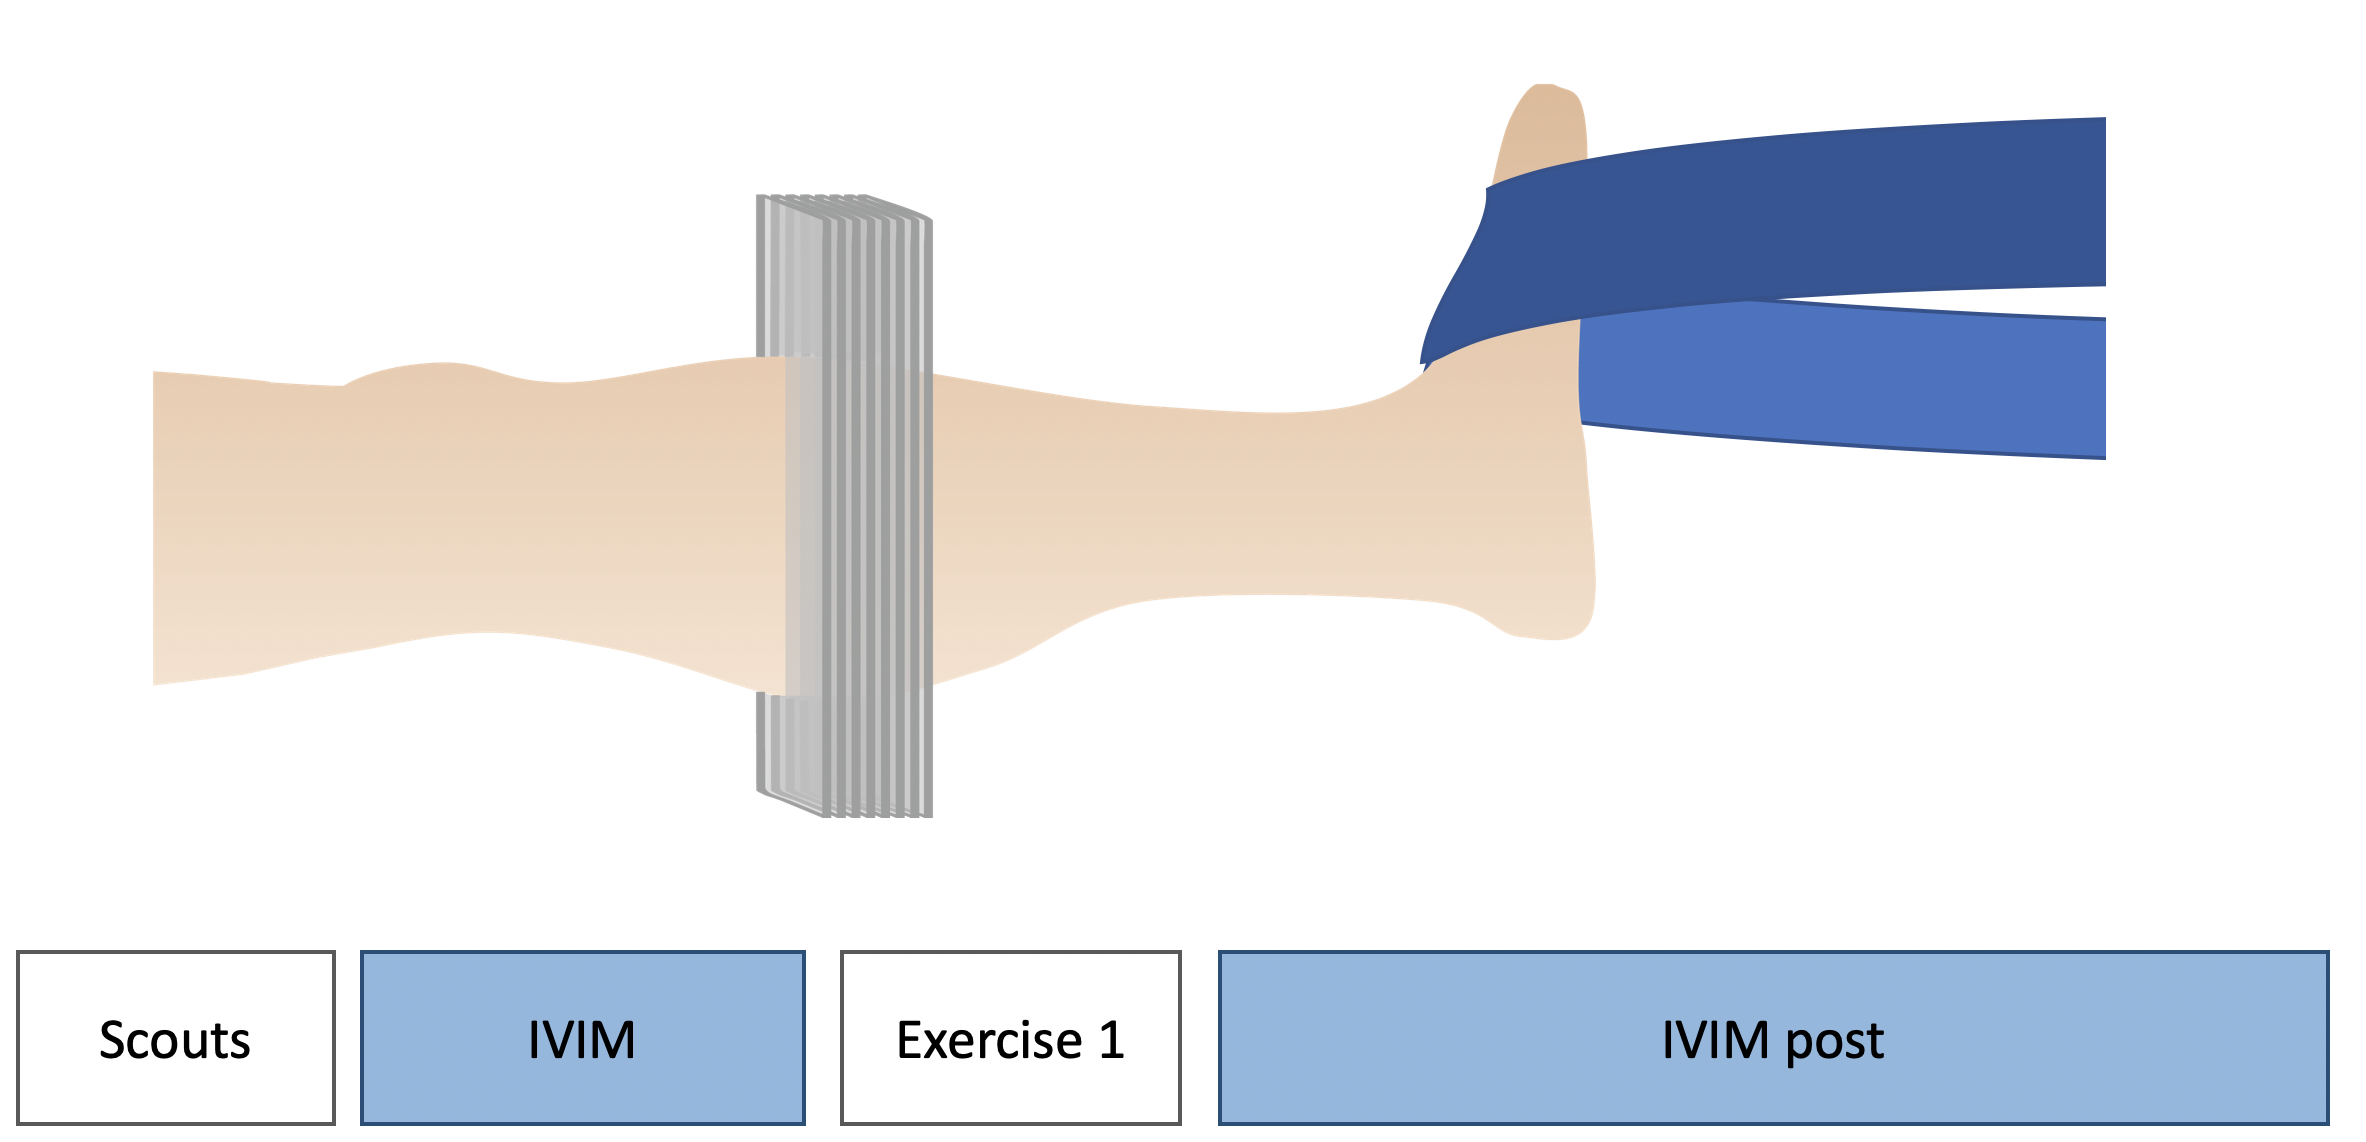
IVIM data were collected at 3T (GE) in six young healthy subjects (4 male). Subjects were positioned supine with the maximum cross-section of their leg centered in a 16 channel transmit-receive extremity coil. IVIM data were collected at baseline. Subjects then performed either high-intensity resisted dorsiflexion (n=4), moderate-intensity resisted dorsiflexion (n=2), or moderate-intensity resisted plantar flexion (n=3) exercises. Exercise intensity was defined relative to the maximum voluntary contraction (MVC) force measured by a hand-held dynamometer, where high-intensity exercise was targeted as approximately 60-80% of MVC, and moderate-intensity was 40-60% MVC. Two subjects participated in both the plantar flexion and dorsiflexion exercise protocols, and one subject performed both low- and high-intensity dorsiflexion exercise protocols. Exercise bouts lasted 3 minutes or until exhaustion. Following cessation of exercise, IVIM data were acquired during 5-15 minutes of recovery. Patient perceived exercise intensity was verified immediately post-exercise using the modified BORG Rate of Perceived Exertion (RPE) Scale (where 10 is maximum perceived exertion). Figure 1 shows the experimental protocol.
IVIM data were obtained with a 2D diffusion-weighted spin echo EPI sequence with the following sequence parameters: FOV=192×192 mm2, slice thickness=5 mm, 8 slices, matrix=128×128, TR/TE=2000/57.1 ms, flip angle=90˚, number of averages=3, and 3 directions of diffusion encoding with b-values=0, 10, 20, 40, 80, 110, 140, 170, 200, 300, 400, 500, 600, 700, 800, 900 s/mm2. b=0 s/mm2 images were interspersed throughout the diffusion-encoded acquisitions, allowing for evaluation of T2 changes over time. Total IVIM acquisition time was 282 s.
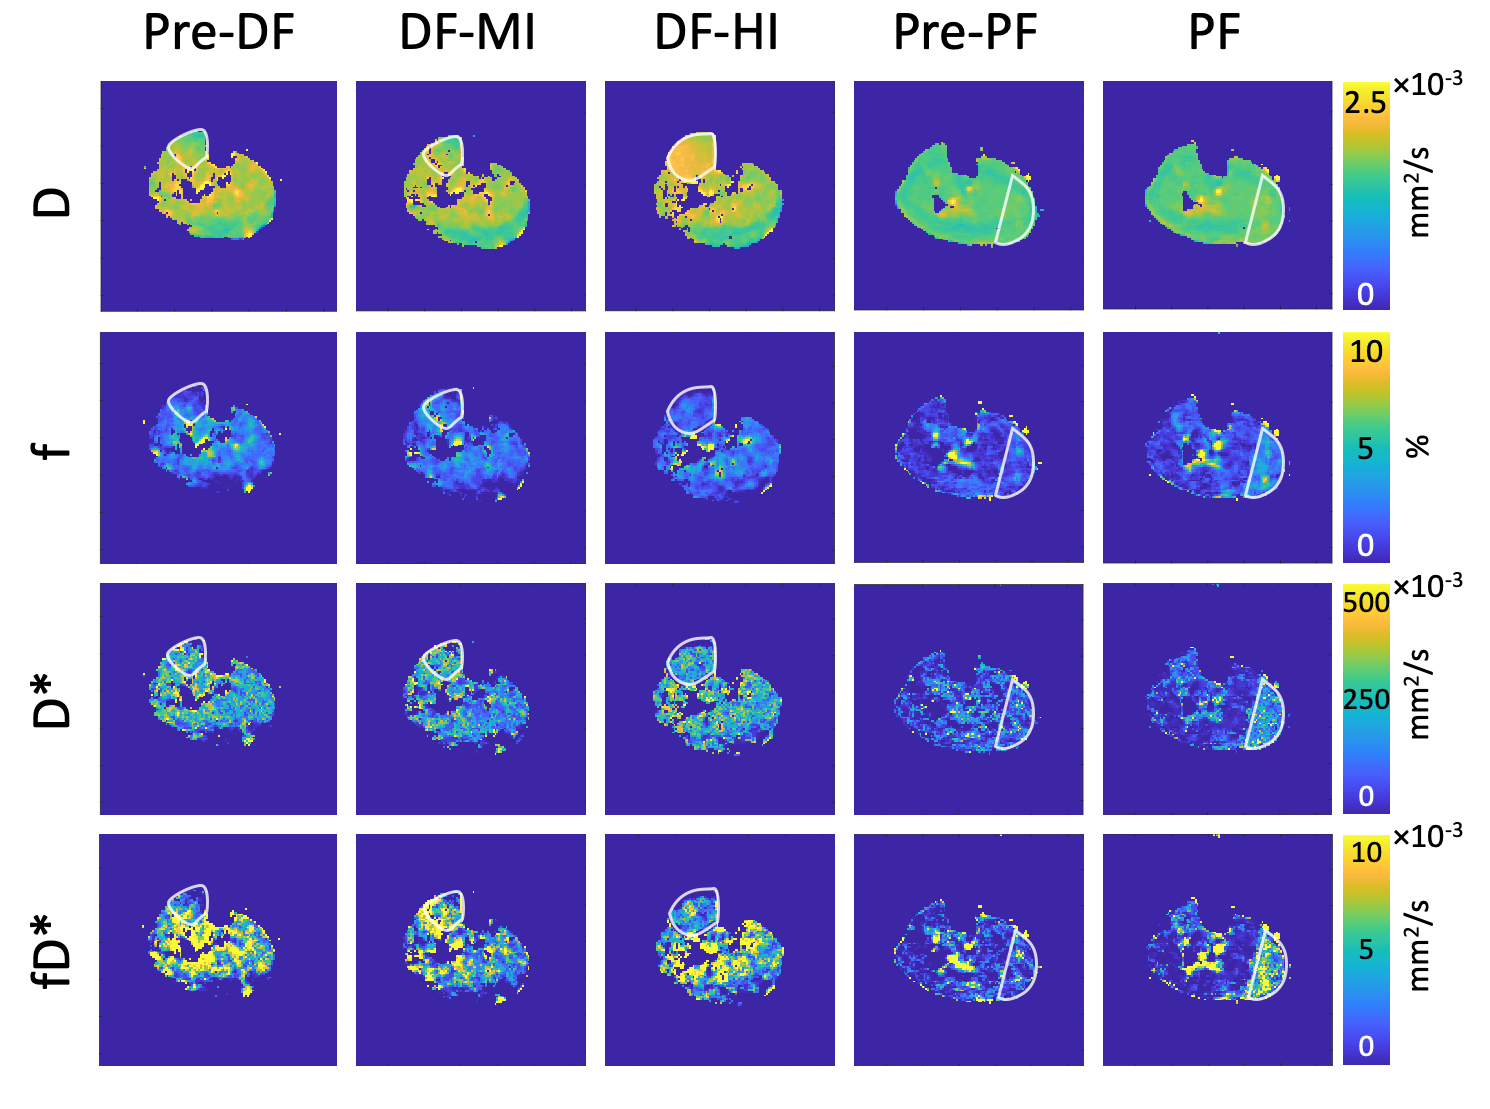
Image processing: Non-linear least-squares fitting was used to solve [Eq. 1] for D, f, and D* from the IVIM data using the standard two-part fitting method where b>200 s/mm2 data were fit to S/S0 = e-bD, and subsequently all data were used to determine f and D*. fD* was determined as the product of f and D*, and values were averaged in regions of interest (ROIs) in the anterior compartment (if exercise was dorsiflexion), or gastrocnemius muscle (if exercise was plantar flexion). Signal intensity was also measured in the same ROIs on the T2-weighted images (b=0), and normalized by the average baseline to obtain relative T2 changes following exercise.
Results
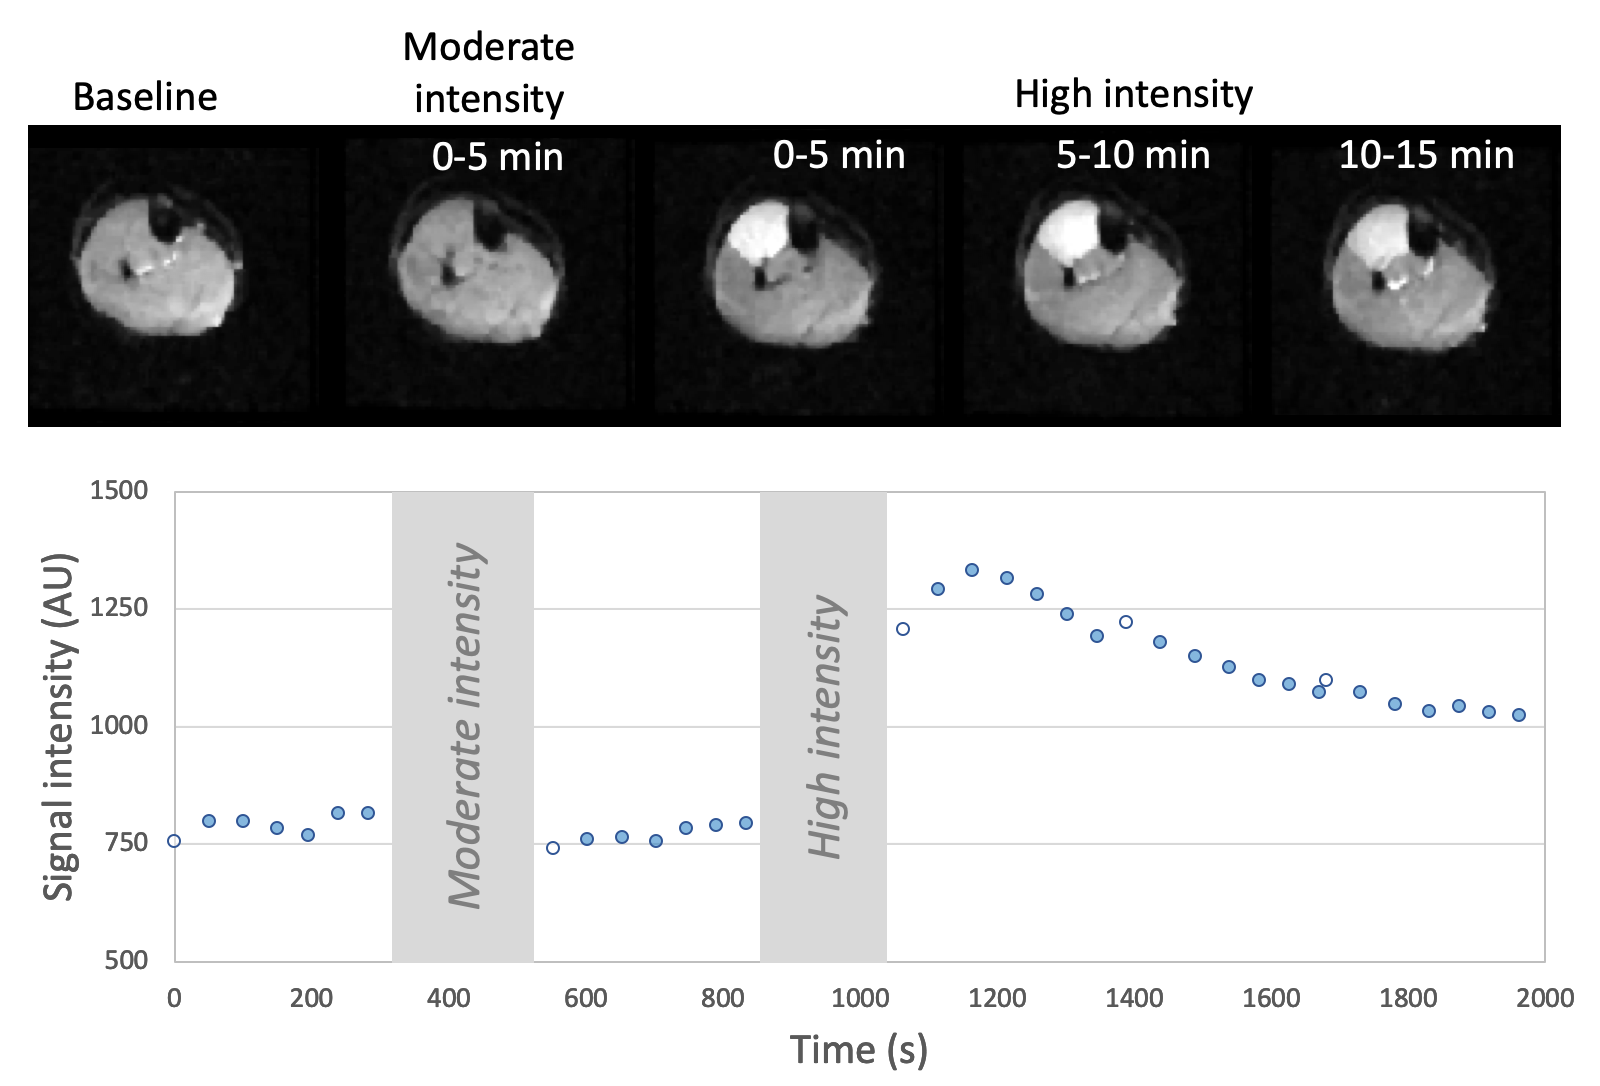
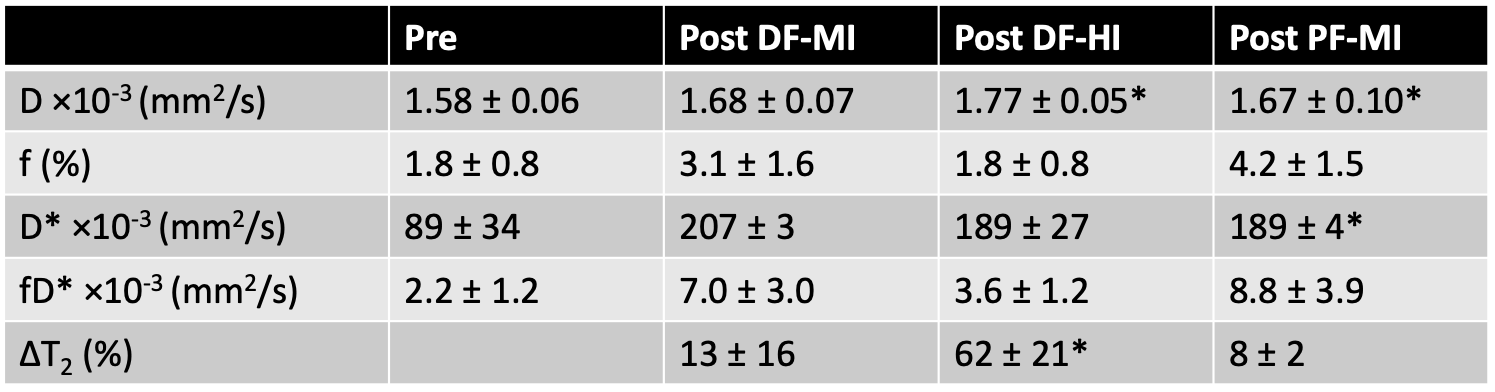
Figure 2 shows T2-weighted images, derived from the b=0 IVIM images, in a representative subject before and after moderate and high-intensity dorsiflexion exercise bouts. Obvious T2 changes are observed following high-intensity dorsiflexion exercise in the exercised muscles of the anterior compartment. Figure 3 shows IVIM-derived parameters at rest and following dorsiflexion and plantar flexion exercises. Subjects reported a range of RPE’s of 3-6 following moderate-intensity exercise, and 8-10 following high-intensity exercise. Table 1 summarizes the results.Discussion and Conclusion
High-intensity resisted dorsiflexion was generally perceived by the subjects to be much more difficult than the resisted plantar flexion exercise. Similar to previous reports2, high-intensity exercise lead to significant increases in T2, while only modest changes in T2 were observed following moderate-intensity exercise. D increased in the exercised muscle following both high-intensity dorsiflexion and moderate-intensity plantar flexion exercises. D* showed comparable increases between the two exercise bouts. Statistical findings need to be taken lightly due to the limited sample size.
While these results demonstrate feasibility, IVIM fitting is highly sensitive to input parameters, noise, and the cutoff value chosen between the low and high b-value range7. Given that the microvascular blood flow velocity changes following exercise, the correct cutoff value that crushes all microvascular signal will also vary. Optimization of IVIM post-processing, will be evaluated in the future.
Acknowledgements
This work was supported by R03 HD094598.References
- Englund EK, Rodgers ZB, Langham MC, Mohler ER, Floyd TF, Wehrli FW. Simultaneous measurement of macro- and microvascular blood flow and oxygen saturation for quantification of muscle oxygen consumption. Magn Reson Med. 2018; 79:846-855.
- Fleckenstein JL, Canby RC, Parkey RW, Peshock RM. Acute effects of exercise on MR imaging of skeletal muscle in normal volunteers. AJR. 1988; 151(2): 231-237.
- Mastropietro A, Porcelli S, Cadioli M, Rasica L, Scalco E, Gerevini S, Marzorati M, Rizzo G. Triggered intravoxel incoherent motion MRI for the assessment of calf muscle perfusion during isometric intermittent exercise. NMR Biomed. 2018; 31(6):e3922.
- Suo S, Zhang L, Tang H, Ni Q, Li S, Mao H, Liu X, He S, Qu J, Lu Q, Xu J. Evaluation of skeletal muscle microvascular perfusion of lower extremities by cardiovascular magnetic resonance arterial spin labeling, blood oxygenation level-dependent, and intravoxel incoherent motion techniques. J Cardiovasc Magn Reson. 2018; 20(1):18.
-
Le Bihan D, Breton E,
Lallemand D, Grenier P, Cabanis E, Laval-Jeantet M. MR imaging of intravoxel incoherent motions: application to diffusion and
perfusion in neurologic disorders. Radiology.
1986; 161(2):401-407.
- Meeus EM, Novak J, Withey SB, Zarinabad N, Dehghani H, Peet AC. Evaluation of intravoxel incoherent motion fitting methods in low-perfused tissue. J Magn Reson Imaging. 2017; 45(5):1325-1334.
Figures