1335
Assessing diffuse muscle fibrosis by ECV estimation, T1 and T2 relaxometry in a non-dystrophic murine model1NMR Laboratory, Neuromuscular Investigation Center, Institute of Myology, CEA/DRF/IBFJ/MIRCen, Paris, France
Synopsis
Skeletal muscle fibrosis, a key pathological feature in muscle disorders, is still inaccessible by NMR. In this study, we investigated the effects of diffuse muscle fibrosis on T2, natT1, and extracellular volume (ECV, estimated from muscle and plasma T1 pre and post-Gd injection). In order to reduce interfering effects with fibrosis, we developed a new non-dystrophic mouse model with increased muscle fibrosis, but limited levels of inflammation and no fat infiltration. A positive correlation between ECV and collagen content could be observed. Collagen content presented a weak positive correlation with T1, and a weak but significant negative correlation with T2.
Introduction
Fibrosis is a pathological alteration observed in almost any tissue/organ and is characterized by increased deposition of extracellular matrix, predominantly composed by collagen1. In skeletal muscle, diffuse endomysial fibrosis is commonly observed in muscle dystrophies, where chronic injury ultimately leads to replacement of muscle by connective and adipose tissues2. While fat infiltration can be quantified with NMR, it remains unclear how and to which extent endomysial fibrosis alters NMR variables. In dystrophic muscle, fibrosis most frequently develops simultaneously with other pathological processes as cell membrane leakage, inflammation, necrosis, regeneration and fat infiltration. Such processes influence NMR variables to different and sometimes opposing extends. Aiming at characterizing how endomysial fibrosis affects NMR variables, we developed a non-dystrophic mouse model with increased muscle fibrosis, but minimized confounding factors such as inflammation, fat infiltration and membrane leakage. Muscle T2, native T1 (natT1) and T1 values after Gd injection were measured. ECV (or Gd-distribution volume) was estimated, and NMR variables were compared to fibrosis as quantified by histological analysis.Materials and methods
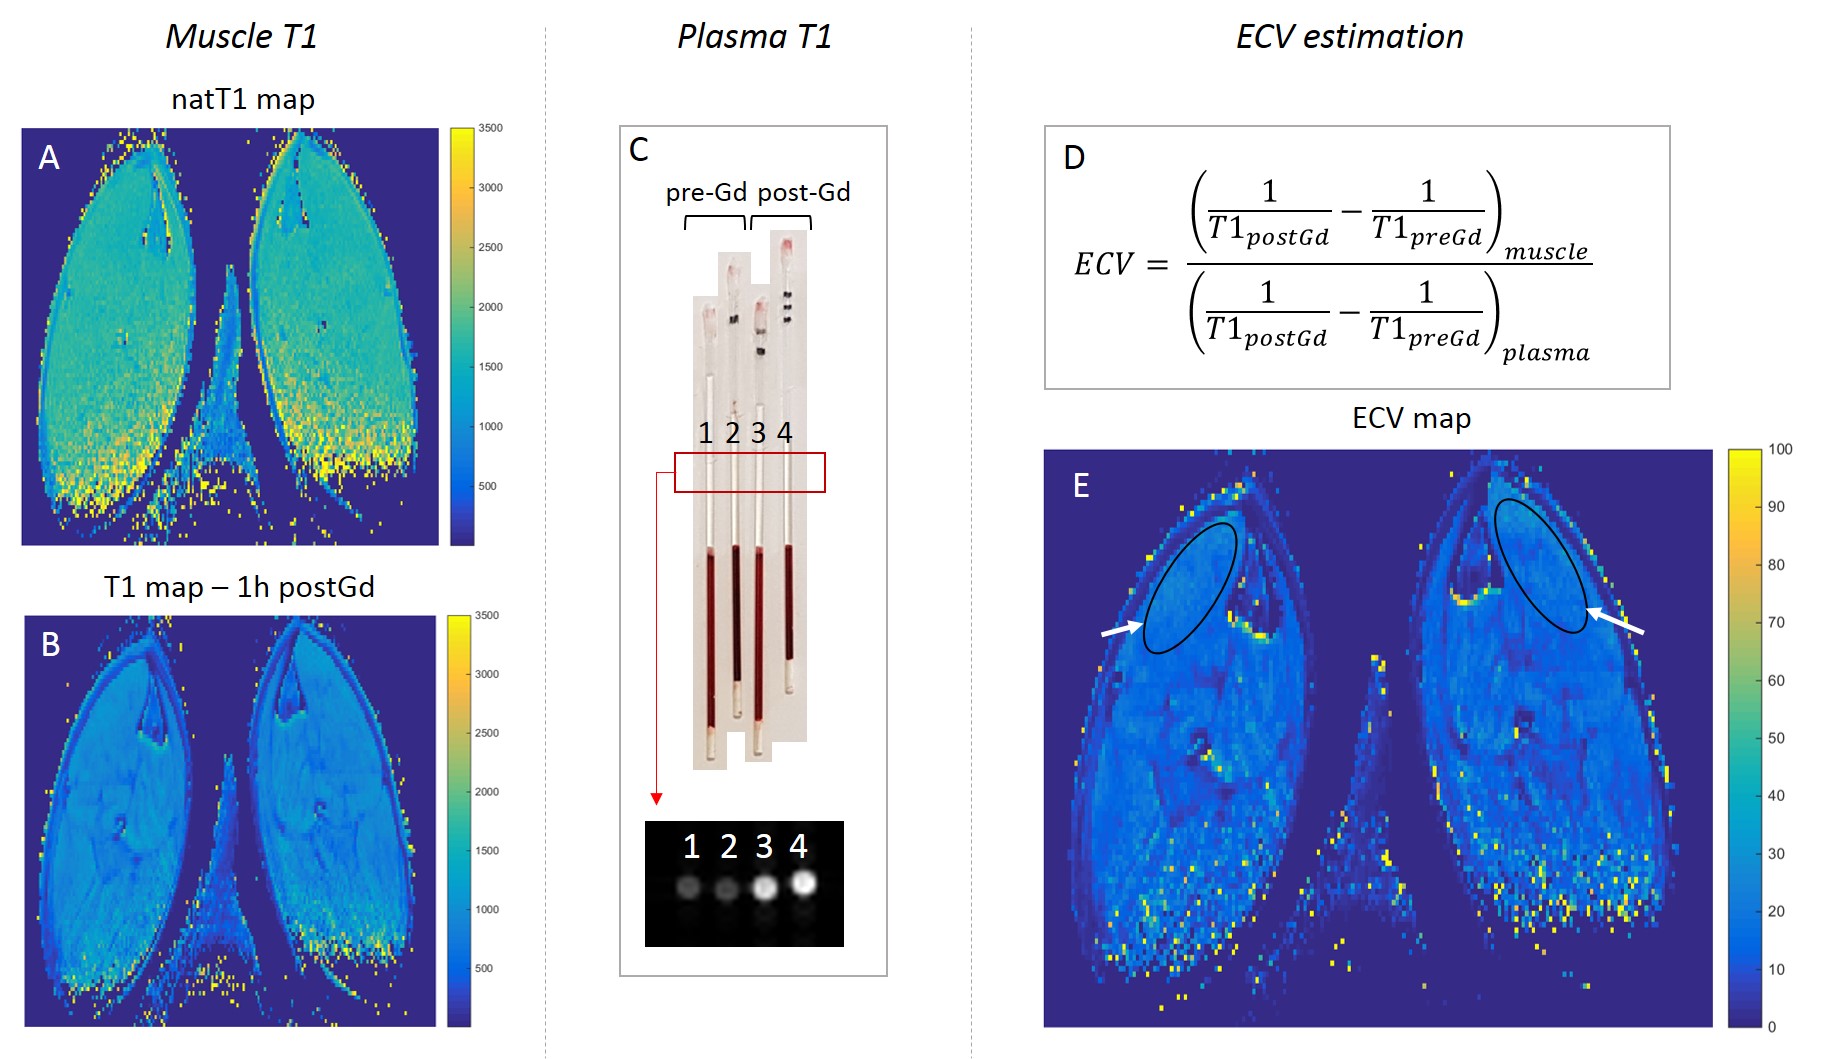
Sixteen C57Bl (BL) and 15 DBA/2J (DBA) mice were included and fibrosis was induced locally in the left tibialis anterior (TA). Fibrosis was induced by combining acute and chronic injuries. Acute muscle injury was induced by electroporation (8 pulses, 100V, 20ms pulse duration, 2Hz pulse frequency, pulse train repeated twice turning the electrodes by 90°). Chronic injuries were obtained by intra-muscular injections (NaCl 0.9% in the left TA, 50µl, 3 times per week during 3 weeks). Subsequently, mice had 2 weeks without injury to allow tissue regeneration and reduction of muscle inflammation. This combination injury/regeneration was repeated twice, completing a 10 weeks injury protocol. During this time, mice were treated with anti-fibrotic drugs, either halofuginone (200µg/kg, 3 times per week, 5 DBA and 5 C57Bl), or Angiotensin 1-7 (Tarix, 1mg/kg, daily, 5 C57Bl mice). Remaining mice did not receive any anti-fibrotic treatment. The purpose of these treatments was to induce different levels of muscle fibrosis in order to assess correlations between different degrees of fibrosis and changes in NMR variables. Uninjured right TAs served as normal control muscles in pairwise comparisons. After fibrosis induction, mice were evaluated by NMR with T2 maps (MSME, TR=3500ms, TE=n*5.15ms, n=1,…, 32, EPG fitting), natT1 maps (saturation-recovery RARE, TE=6.66ms, 13 TR: 82.9, 100, 128, 171, 214, 602, 286, 359, 1010, 1694, 2842, 4769, 8000ms), and T1-maps 1 hour after Gd injection (Dotarem, 2µmol Gd/g mouse weight, intraperitoneal injection saline:Dotarem 1.6:1). Acquisitions were done under isoflurane anesthesia in a 7T Bruker system, with a Bruker cryoprobe (spatial resolution: 0.1x0.1x1mm3). Immediately before the NMR acquisitions and just after the last T1-map, blood samples were collected, centrifuged, and plasma T1 was measured with the same pulse sequence as used for muscle T1 mapping. ECV or Gd distribution volume was estimated3 (Figure 1). After imaging, mice were euthanized and left and right TAs were dissected for histological analysis. Samples were stained with Sirius Red (SR) for quantification of the collagen content and hematoxilin-eosin (HE), for assessment of the degree of inflammation, centronucleation, fat infiltration and necrotic calcifications.Results
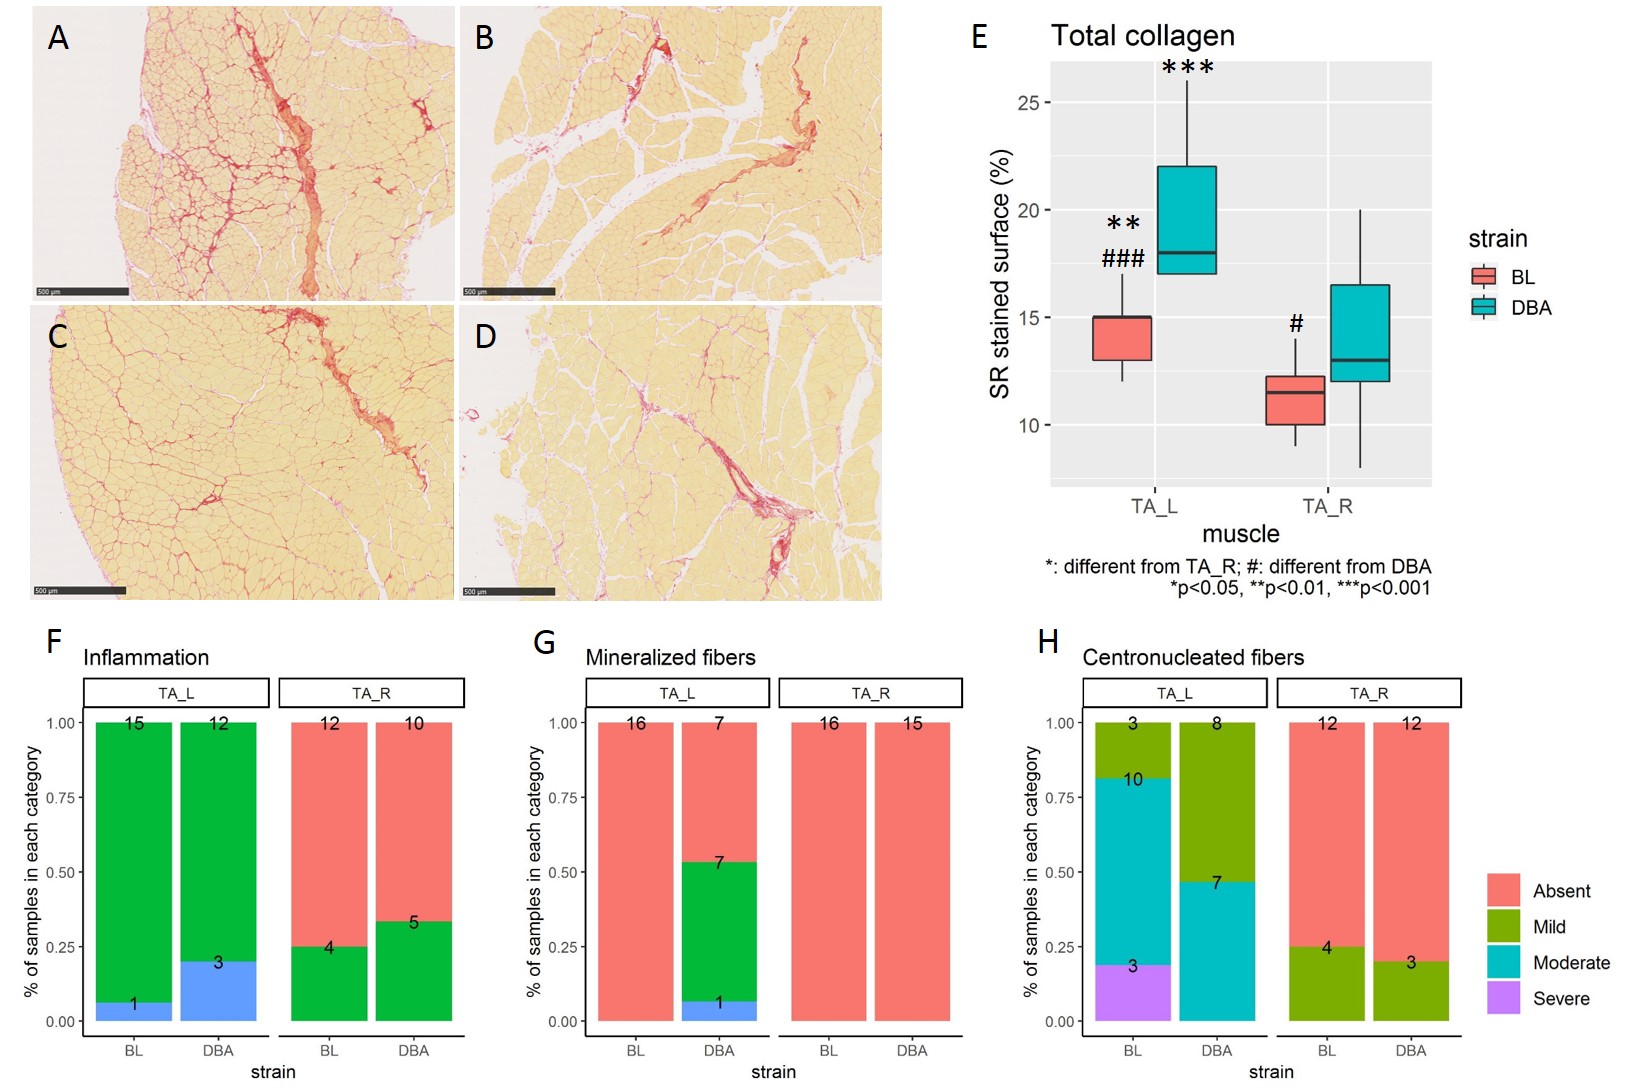
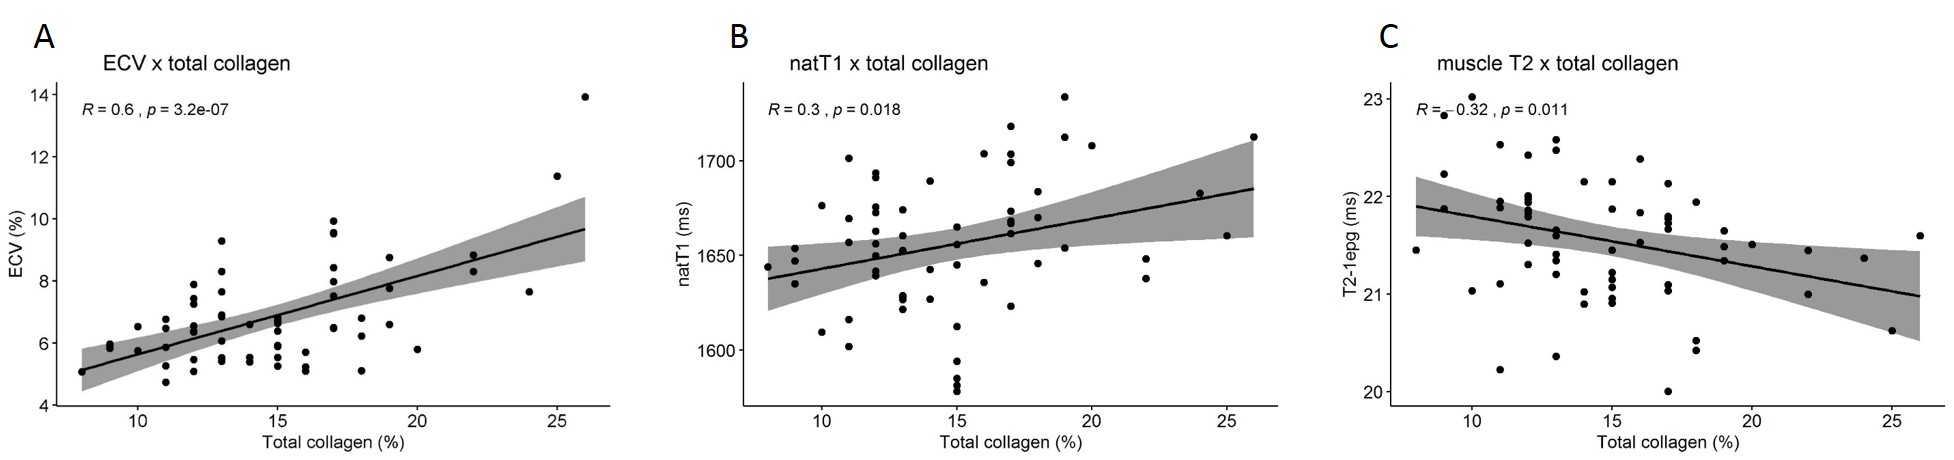
The injury protocol successfully induced endomysial fibrosis (Figure 2, A-E), without fat infiltration and only mild to moderate inflammation in the injured muscles (Figure 2-F). Centronucleated fibers were common features in both mouse strains. Alterations identified as mineralized necrotic fibers could be observed mainly in injured DBA muscles (Figure 2-G, H). Pairwise T-test revealed increased ECV after injury (injured: 7.3±2.0%, control: 6.4±1.1%, p<0.05). ECV correlated significantly with collagen content on histological sections (R=0.6, p<0.001, Figure 3-A). No differences between injured and control TAs were observed in pairwise T-test for natT1, but a loose correlation between natT1 and collagen content could be detected (R=0.3, p<0.05, Figure 3-B). Injured TA presented slightly lower T2 values (injured: 21.4±0.6ms, control: 21.7±0.6ms, p<0.05), and a loose negative correlation could be detected between T2 and collagen content (R=-0.32, p<0.05, Figure 3-C).Discussion and conclusion
Our observations show that muscle fibrosis correlates with increased extracellular volume, similarly to what is observed in myocardial fibrosis3. Our model, unlike dystrophic muscle, showed predominant fibrosis, but was not able to disentangle completely fibrosis from other pathological processes like inflammation and regeneration. Even though, collagen content correlated also, but to a lesser extent, with natT1 (positive correlation) and muscle T2 (negative correlation). Despite these promising results, caution should be taken as confounding factors can still have a disturbing influence on correlations between fibrosis and these NMR variables.Acknowledgements
No acknowledgement found.References
1. Lieber, R. L. & Ward, S. R. Cellular mechanisms of tissue fibrosis. 4. Structural and functional consequences of skeletal muscle fibrosis. Am. J. Physiol. Cell Physiol. 305, C241-52 (2013).
2. Serrano, A. L. & Muñoz-Cánoves, P. Fibrosis development in early-onset muscular dystrophies: Mechanisms and translational implications. Semin. Cell Dev. Biol. (2016).
3. Flett, A. S. et al. Equilibrium contrast cardiovascular magnetic resonance for the measurement of diffuse myocardial fibrosis: Preliminary validation in humans. Circulation 122, 138–144 (2010).
Figures