1333
Short-Term Effects of Running on T2 Relaxation Times of Femoral Cartilage in Female Runners1Mechanical Engineering, Stanford University, Palo Alto, CA, United States, 2Radiology, Stanford University, Palo Alto, CA, United States, 3Bioengineering, Stanford University, Palo Alto, CA, United States, 4Electrical Engineering, Stanford University, Palo Alto, CA, United States
Synopsis
This study tracks changes in water content in femoral cartilage from running by comparing T2 relaxation times of cartilage at baseline, time 0, and time 60 minutes post-run. Significant decreases in T2 relaxation times between baseline and time 0/time 60 minutes post-run scans occurred in superficial and deep cartilage, and a significant increase in T2 relaxation time occurred between time 0 and time 60 minutes post-run scans in deep cartilage, suggesting a reduction and partial recovery of cartilage water content. This study demonstrates the high sensitivity of T2 to cartilage loading patterns during running and supports the potential of using this setup as a method for identifying early changes in cartilage health.
Introduction
Osteoarthritis (OA) is a chronic, debilitating joint disease characterized by degenerative changes to joint cartilage1. Cartilage is important for shock absorption and load distribution in the knee during exercise. There are different interpretations of whether biomechanical running-induced stress in the knee is a risk factor for developing knee OA2,3. The MRI-based biomarker, T2 relaxation time, has been correlated to changes in collagen structure, organization, and orientation in cartilage4. Both reductions and increases in T2 relaxation times have been observed in knee cartilage following various lengths of time running5,6. This study aims to determine if there are changes in the T2 relaxation times of superficial and deep articular femoral cartilage of healthy female runners between baseline, post-run and recovery scans to examine the potential of describing cartilage loading patterns during running as a novel method for identifying early changes in cartilage health.Methods
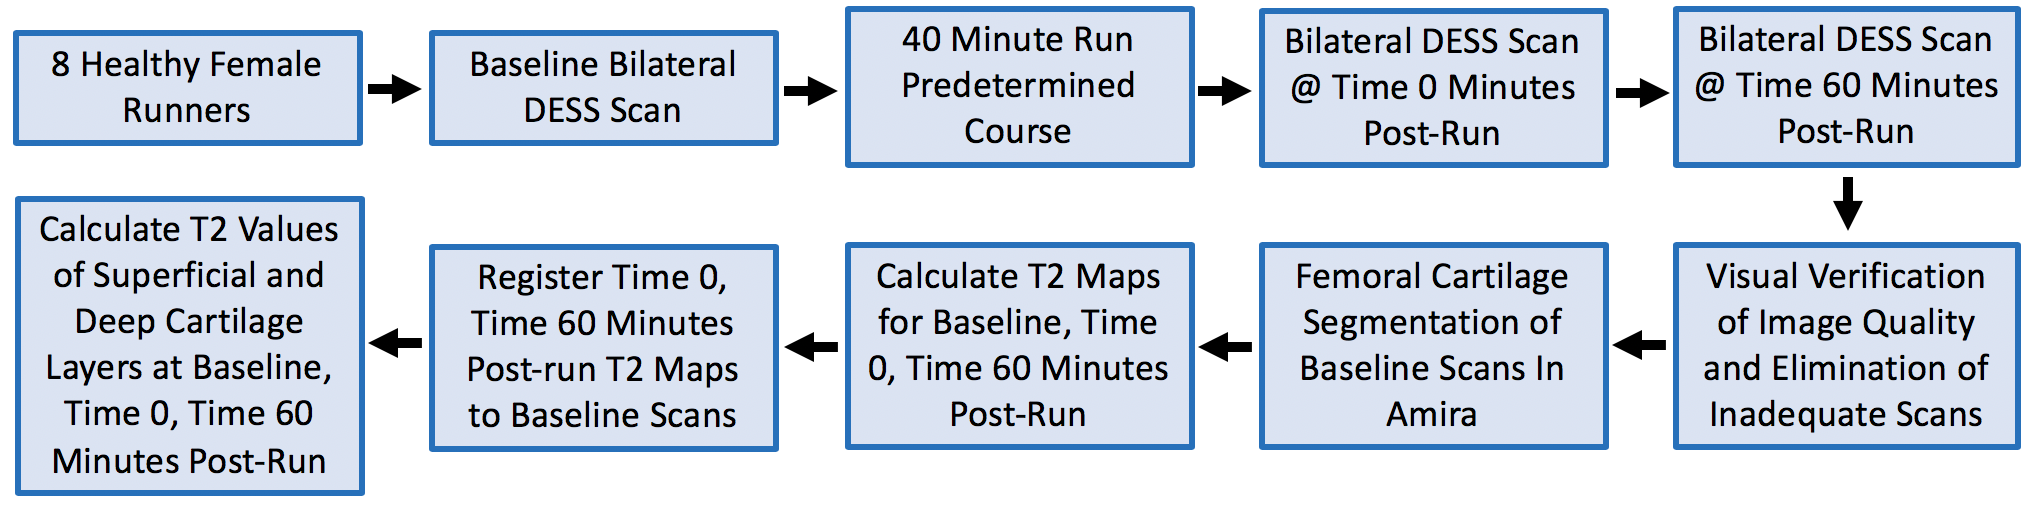
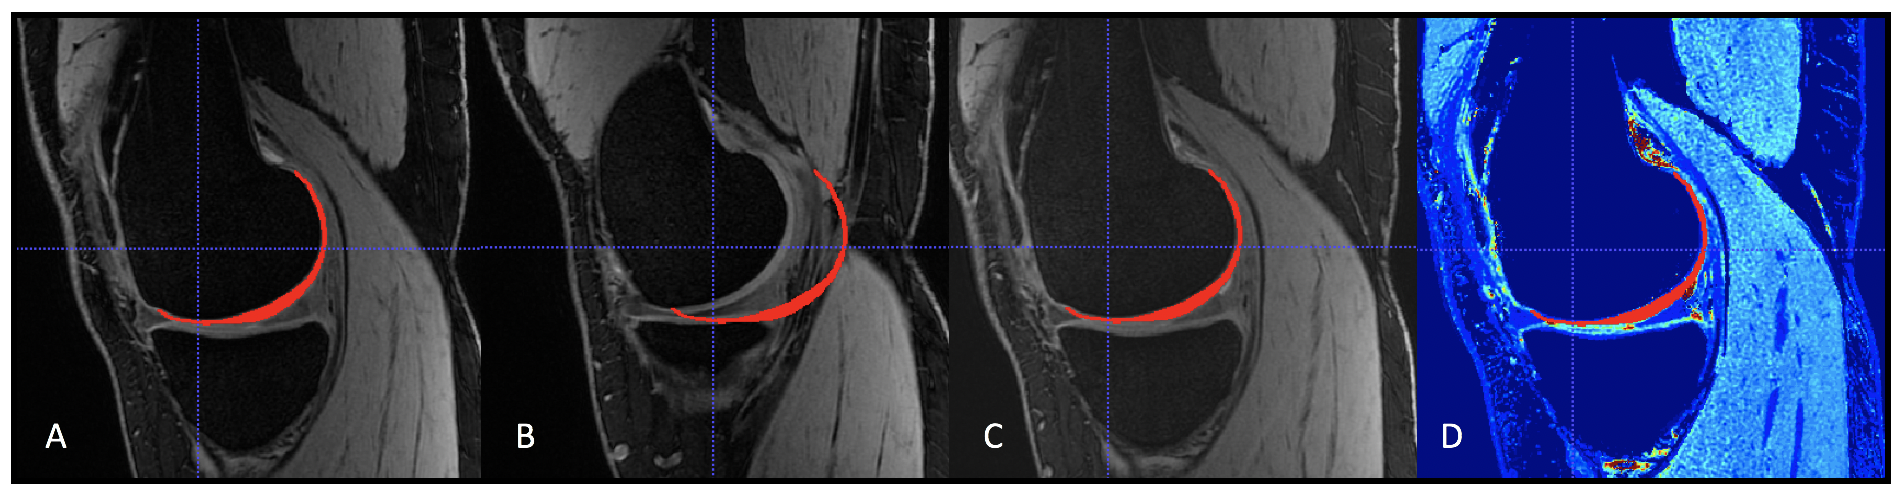
Eight healthy female volunteer runners (23yo-59yo, run 9-25 miles/week) were scanned on a 3T MRI scanner (GE Healthcare, Milwaukie, WI) with a 16-channel flex coil on each knee. Image acquisition used a bilateral qDESS sequence7 with parameters: TR=15.5ms, TE1/TE2=5.2/25.8ms, 1.4mm slice thickness, 256x256 matrix. Volunteers were scanned at baseline and following a 40 minute run (see experiment flow chart, Figure 1). Femoral cartilage of baseline scans was manually segmented and algorithmically separated into deep and superficial layers using the first echo of qDESS. T2 relaxation times were calculated by analytically inverting the qDESS signal model8. The T2 relaxation times were registered to baseline scans with a multiresolution affine transformation using elastix (see Figure 2)9. The T2 relaxation times across the 3D femoral cartilage surface for both layers were projected onto a 2D plane10. A paired Wilcoxon signed rank test was performed to determine whether T2 relaxation times at baseline, and 0 and 60 minutes post-run in each knee were significantly different for superficial and deep cartilage. A p-value<0.05 was considered to be significant.Results
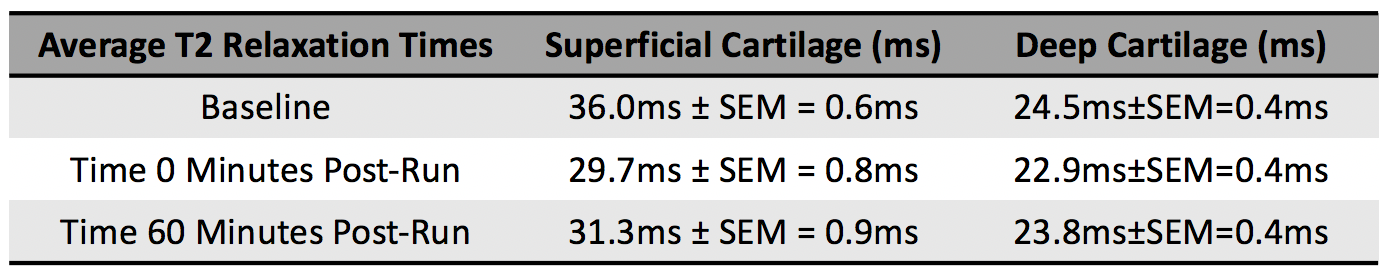
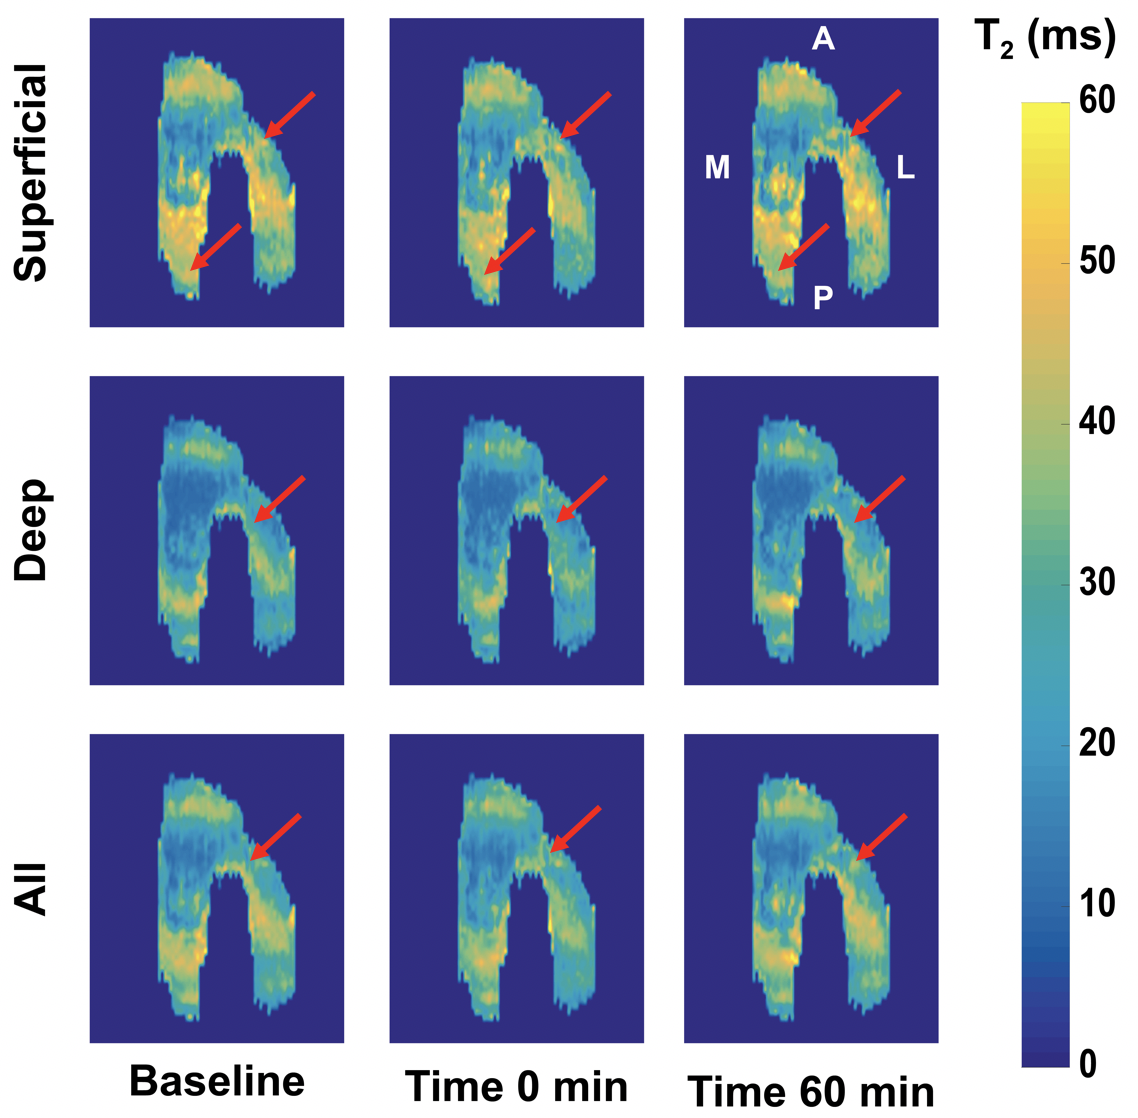
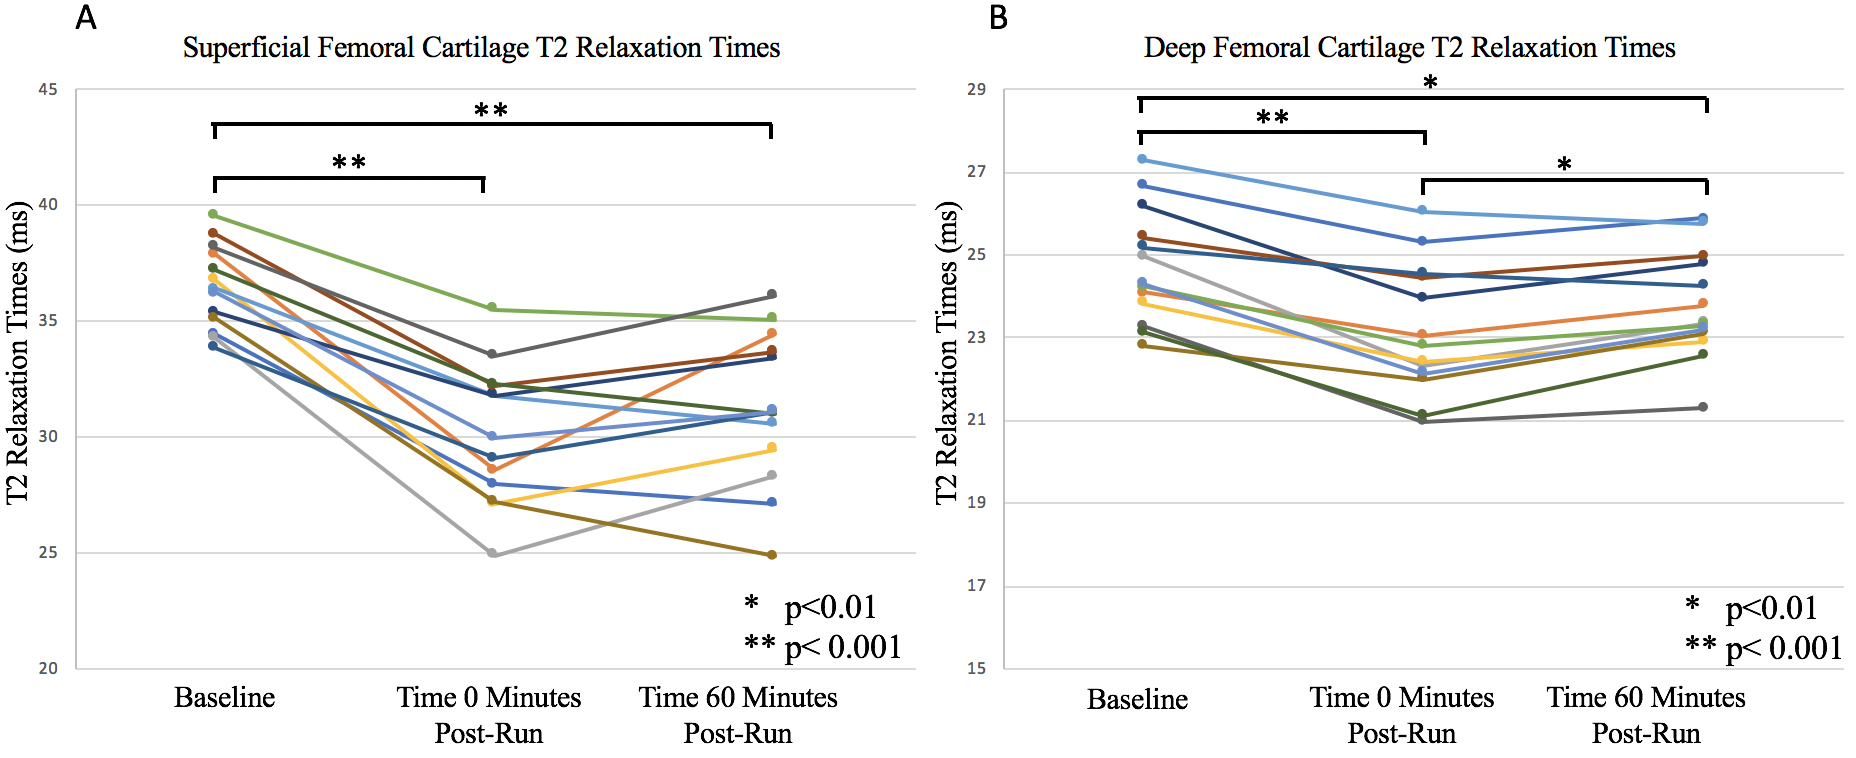
Average T2 relaxation times for superficial and deep cartilage were calculated for 15 knees at baseline and time 0 minutes post-run (time 0) and 13 knees at time 60 minutes post-run (time 60) (see Figure 1, Figure 3). Average T2 relaxation time maps for superficial and deep cartilage are shown for baseline, time 0, and time 60 in Figure 4. Figure 5 shows changes in average T2 relaxation times for superficial and deep cartilage. T2 relaxation times of superficial cartilage at baseline were significantly different from T2 relaxation times at both time 0 (p<0.001) and time 60 (p<0.001), while no significant difference was observed between time 0 and time 60 (p>0.05). For deep cartilage, baseline T2 relaxation times at time 0 (p<0.001) and time 60 (p<0.01). T2 relaxation times at time 0 and time 60 were also significantly different from each other (p<0.01), though the differences on deep cartilage (1.6±0.8ms, 0.7±0.8ms, 0.9±0.8ms, respectively) were smaller in magnitude than significant differences (6.3±1.4ms, 4.7±1.5ms, respectively) in the superficial layer of cartilage.Discussion
There were significant differences in T2 relaxation times of superficial and deep cartilage between baseline and post-run scans in female runners. A significant reduction in T2 relaxation times in superficial cartilage is consistent with previous work11. A significant decrease in T2 relaxation time between baseline and time 0/time 60 in superficial and deep cartilage, and between time 0 and time 60 for deep cartilage, likely indicate changing cartilage water content. Water could be expelled from the cartilage matrix by increased biomechanical running forces before reabsorption during recovery. Superficial cartilage is more compressible than deep cartilage12, which could explain larger reductions in T2 relaxation times in superficial cartilage post-run compared to deep cartilage. Additionally, there was a significant reduction in T2 relaxation times between baseline and time 60 minutes for superficial and deep cartilage, which has not been examined previously, suggesting changes in cartilage composition from running were not fully recovered by one hour post-exercise, not shown previously.
Conclusion
Significant reductions in T2 relaxation times were observed between baseline and time 0/time 60 minutes post-run scans for both superficial and deep cartilage, and a significant increase in T2 relaxation times was observed between time 0 and time 60 scans for the deep femoral cartilage in the knees of eight volunteer healthy female runners. This work shows the high sensitivity of T2 to cartilage loading patterns during running and suggests the potential of using this setup as a novel method for identifying early changes in cartilage health.Acknowledgements
R01 AR065248-01A1 and GE HealthcareReferences
[1] Braun, H J, and Gold, G E. Diagnosis of Osteoarthritis: Imaging. Bone, August, 2012;51(2):278–288. doi: 10.1016/j.bone. 2011.11.019.
[2] Lane NE, Oehlert JW, Bloch DA, Fries JF. The relationship of running to osteoarthritis of the knee and hip and bone mineral density of the lumbar spine: a 9 year longitudinal study. J Rheumatol. 1998; 25 (2):334–41. PMID: 9489830
[3] Jackson BD, Wluka AE, Teichtahl AJ, Morris ME, Cicuttini FM, et al. Reviewing knee osteoarthritis–a biomechanical perspective. J Sci Med Sport. 2004; 7(3):347–357. PMID: 15518300
[4] Mordecai SC, et al. Treatment of meniscal tears: An evidence based approach. World Journal of Orthopedics. 2014;5(3):233-241. doi:10.5312/wjo.v5.i3.233
[5] Chen M, Qiu L, Shen S, Wang F, Zhang J, Zhang C, et al. (2017) The influences of walking, running and stair activity on knee articular cartilage: Quantitative MRI using T1 rho and T2 mapping. PLoS ONE 12(11): e0187008. https://doi.org/ 10.1371/journal.pone.0187008
[6] Luke AC, Stehling C, Stahl R, Li XJ, Kay T, Takamoto S, et al. High-field magnetic resonance imaging assessment of articular cartilage before and after marathon running: does long-distance running lead to cartilage damage? Am J Sports Med. 2010; 38(11):2273–2280. https://doi.org/10.1177/ 0363546510372799 PMID: 20631252
[7] Kogan F, Levine E, Chaudhari AC, Monu UD, Epperson K, et al. Simultaneous Bilateral-Knee MR Imaging. Magnetic resonance in medicine, 2018; 80(2):529-537. https://doi.org/10.1002/mrm.27045 This study tracks changes in water content in femoral cartilage from running by comparing between baseline/time 0 minutes post-run scans occurred in superficial and deep cartilage, and a significant relaxation times of cartilage at baseline, time 0, and time 60 minutes post-run. Significant decreases in T2 relaxation times increase in T2 relaxation time occurred between time 0/time 60 minutes post-run scans in deep cartilage suggesting a reduction and partial recovery of cartilage water content. This study demonstrates the
[8] Sveinsson B, Chaudhari AC, Gold GE, Hargreaves BA. A Simple Analytical Method for Estimating T2 in the Knee From DESS. Magnetic resonance in medicine, 2017; 38:63-70. doi: 10.1016/j.mri.2016.12.018.
[9] Klein S, Staring M, Murphy K, Viergever MA, Pluim JPW: Elastix: A toolbox for intensity-based medical image registration. IEEE Trans Med Imaging 2010; 29:196–205.
[10] Monu UD, Jordan CD, Samuelson BL, Hargreaves BA, Gold GE, McWalter EJ: Cluster analysis of quantitative MRI T2 and T1?? relaxation times of cartilage identifies differences between healthy and ACL- injured individuals at 3T. Osteoarthr Cartil 2017; 25:513–520.
[11] Subburaj K, Kumar D, Souza RB, et al. The acute effect of running on knee articular cartilage and meniscus magnetic resonance relaxation times in young healthy adults. Am J Sports Med. 2012;40(9):2134-41.
[12] Mosher TJ, Liu Y, Torok CM. Functional cartilage MRI T2 mapping: evaluating the effect of age and training on knee cartilage response to running. Osteoarthritis Cartilage. 2010;18(3):358-64. doi: 10.1016/j.joca.2009.11.011.
Figures