1332
Rapid Quantitative Simultaneous Bilateral Knee Imaging with Fully Automated Femoral Cartilage Analysis: Toward Knee Asymmetry Evaluation.1Department of Physics and Astronomy, University of Bologna, Bologna, Italy, 2Department of Radiology, Stanford University, Stanford, CA, United States, 3Department of Bioengineering, Stanford University, Stanford, CA, United States, 4Department of Electrical Engineering, Stanford University, Stanford, CA, United States
Synopsis
Quantitative bilateral knee MRI and whole femoral cartilage analysis is currently limited by costs and scan time. We propose a rapid, simultaneous bilateral knee MRI protocol followed by a fully automated pipeline to perform quantitative T2 analysis of the whole femoral cartilage plate of both knees. Five healthy subjects and a subject with an ACL reconstruction were scanned in this study and the results demonstrated high scan-rescan repeatability and a good agreement between manual and automatic segmentation. The proposed acquisition method with automated analysis may make bilateral imaging more feasible and efficient for use in longitudinal and cross-sectional studies.
Introduction
Magnetic Resonance Imaging (MRI) is a noninvasive tool to study osteoarthritis (OA) progression, providing quantitative MR parameters (such as transverse relaxation time T2) sensitive to macromolecular changes in collagenous tissues1. For knee OA, various studies have shown that bilateral examinations are beneficial for evaluating OA changes2 as well the importance of full volumetric quantitative analysis of tissues such as femoral cartilage (FC)3. Scan-time restrictions and costs limit the clinical or research feasibility of bilateral acquisition, and analysis of the whole femoral cartilage plate is often very time-consuming requiring both segmentation and subregions definition to be defined manually. In this preliminary work we propose a rapid, simultaneous bilateral knee MRI protocol followed by a fully automated pipeline to perform quantitative T2 analysis of the whole femoral cartilage plate of both knees. This method enables feasibility of bilateral knee studies, allowing routine study of asymmetries between knees, which may help highlighting knee OA pathways in longitudinal as well as cross-sectional studies.Methods
Simultaneous bilateral knee MRI acquisitions4 were performed on a GE 3T SIGNA Premier scanner (GE Healthcare, Milwaukee, WI, USA) using two 16-channel flexible phased-array, receive-only coils (NeoCoil, Pewaukee, WI, USA). A 3D quantitative double-echo in steady-state (qDESS) sequence was used5 and T2 relaxometry maps were computed by analytically inverting the qDESS signal model6. Five healthy subjects and a subject with an ACL reconstruction in the right knee were scanned in this study. The qDESS acquisition was repeated for each subject after repositioning for repeatability assessment. A Python-based deep-learning open-source musculoskeletal MR analysis (DOSMA) framework was used to perform automatic segmentation of FC, to compute a T2 map and to visualize the 3D segmented volume projected onto a 2D space3. The FC was sub-divided into different layers (total, deep and superficial) and 6 sub-regions (anterior/central/posterior for the medial/lateral sides) and average T2 values per sub-region were computed. For each subject, the first scan was manually segmented, and the second scan was registered to the first to obtain a full set of manual FC segmentations for use as gold standards. The sub-regional analysis was performed on both the manual and automatic segmentations. Bland-Altman (BA) analysis, was used to assess scan-rescan repeatability, left-right knee symmetry and manual vs. automatic segmentation accuracy. Concordance metrics such as Lin’s concordance coefficient (ρc) and root-mean-square-error (RMSE) coefficient variation percentage (CV) were also evaluated. To assess intra-subject asymmetry between left and right knee, the T2 distributions of the two knees were also computed and Jensen-Shannon divergence (JSD) used as similarity metric7,8.Results
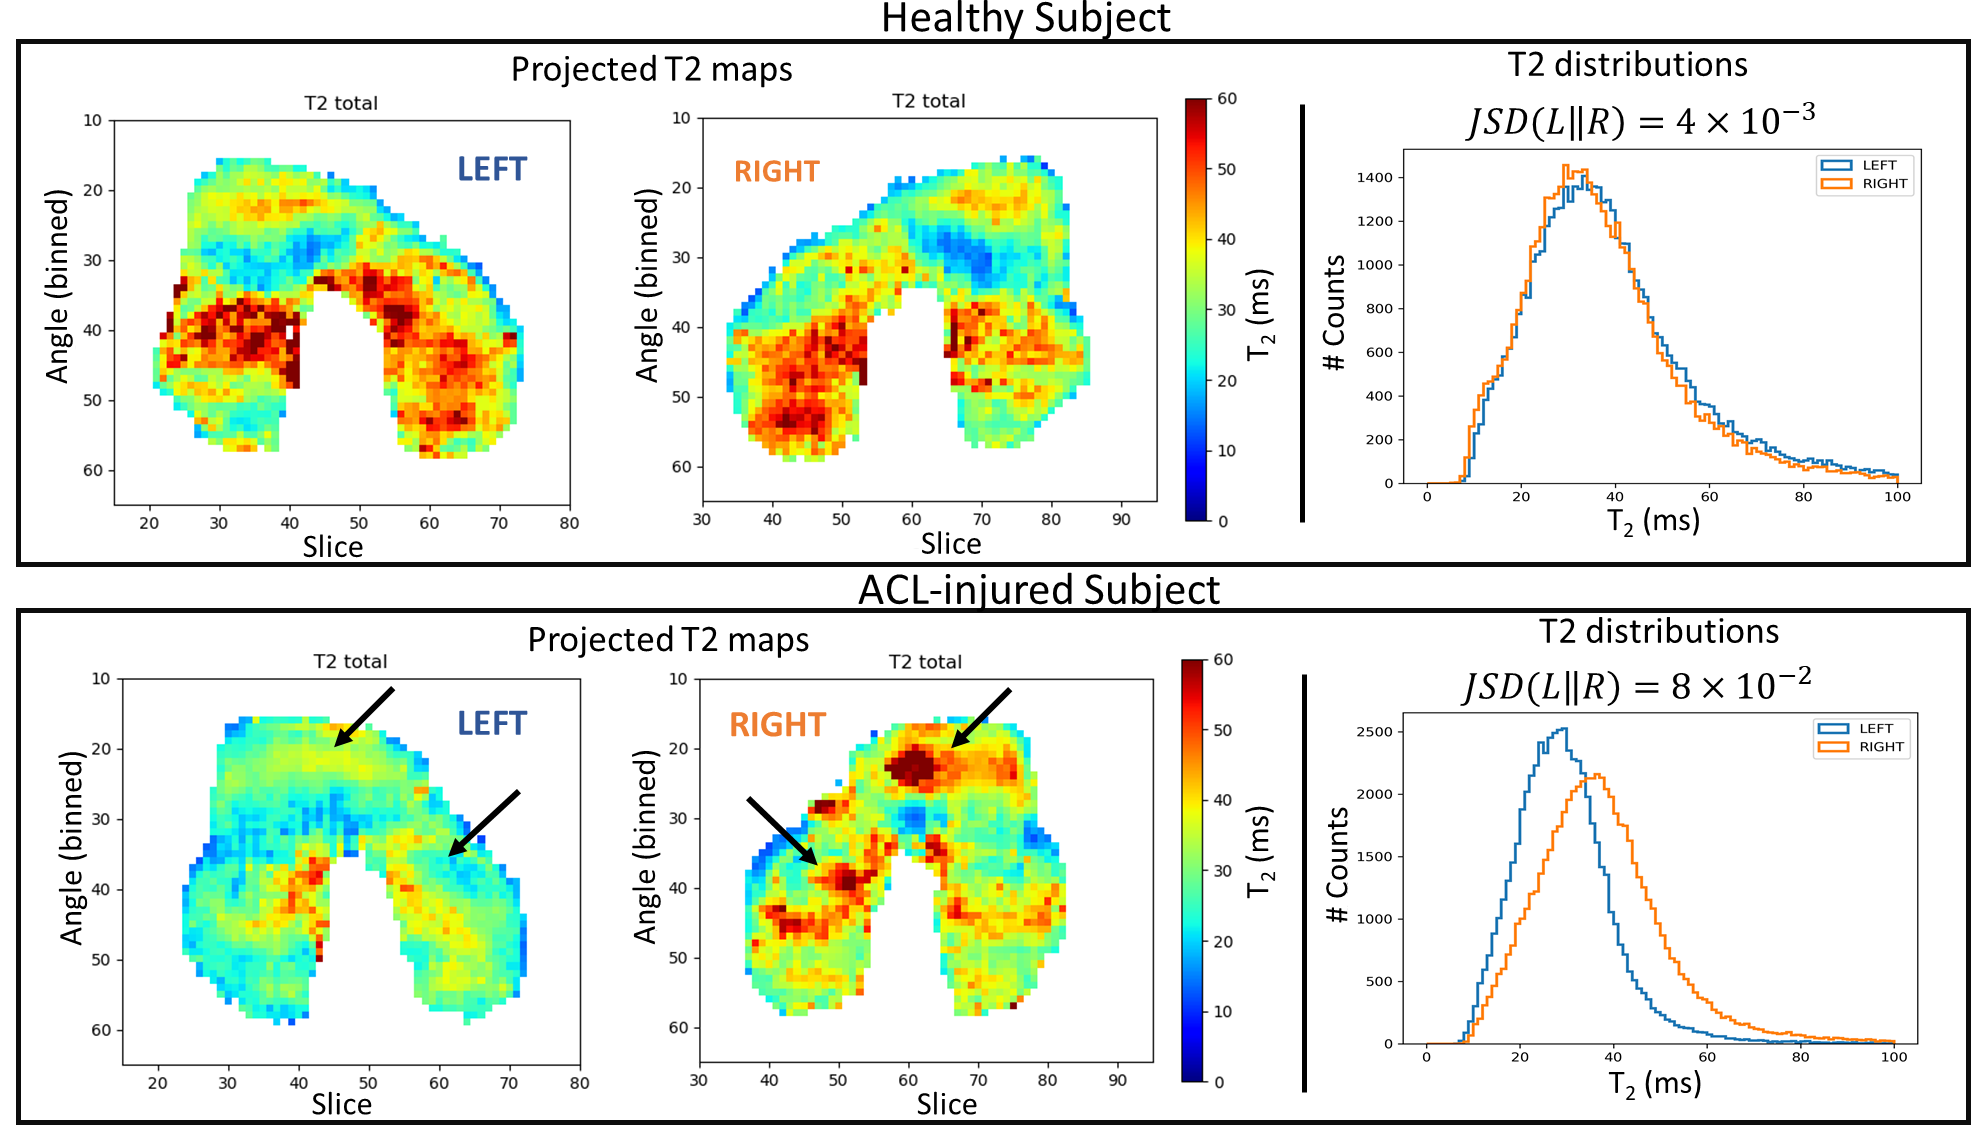
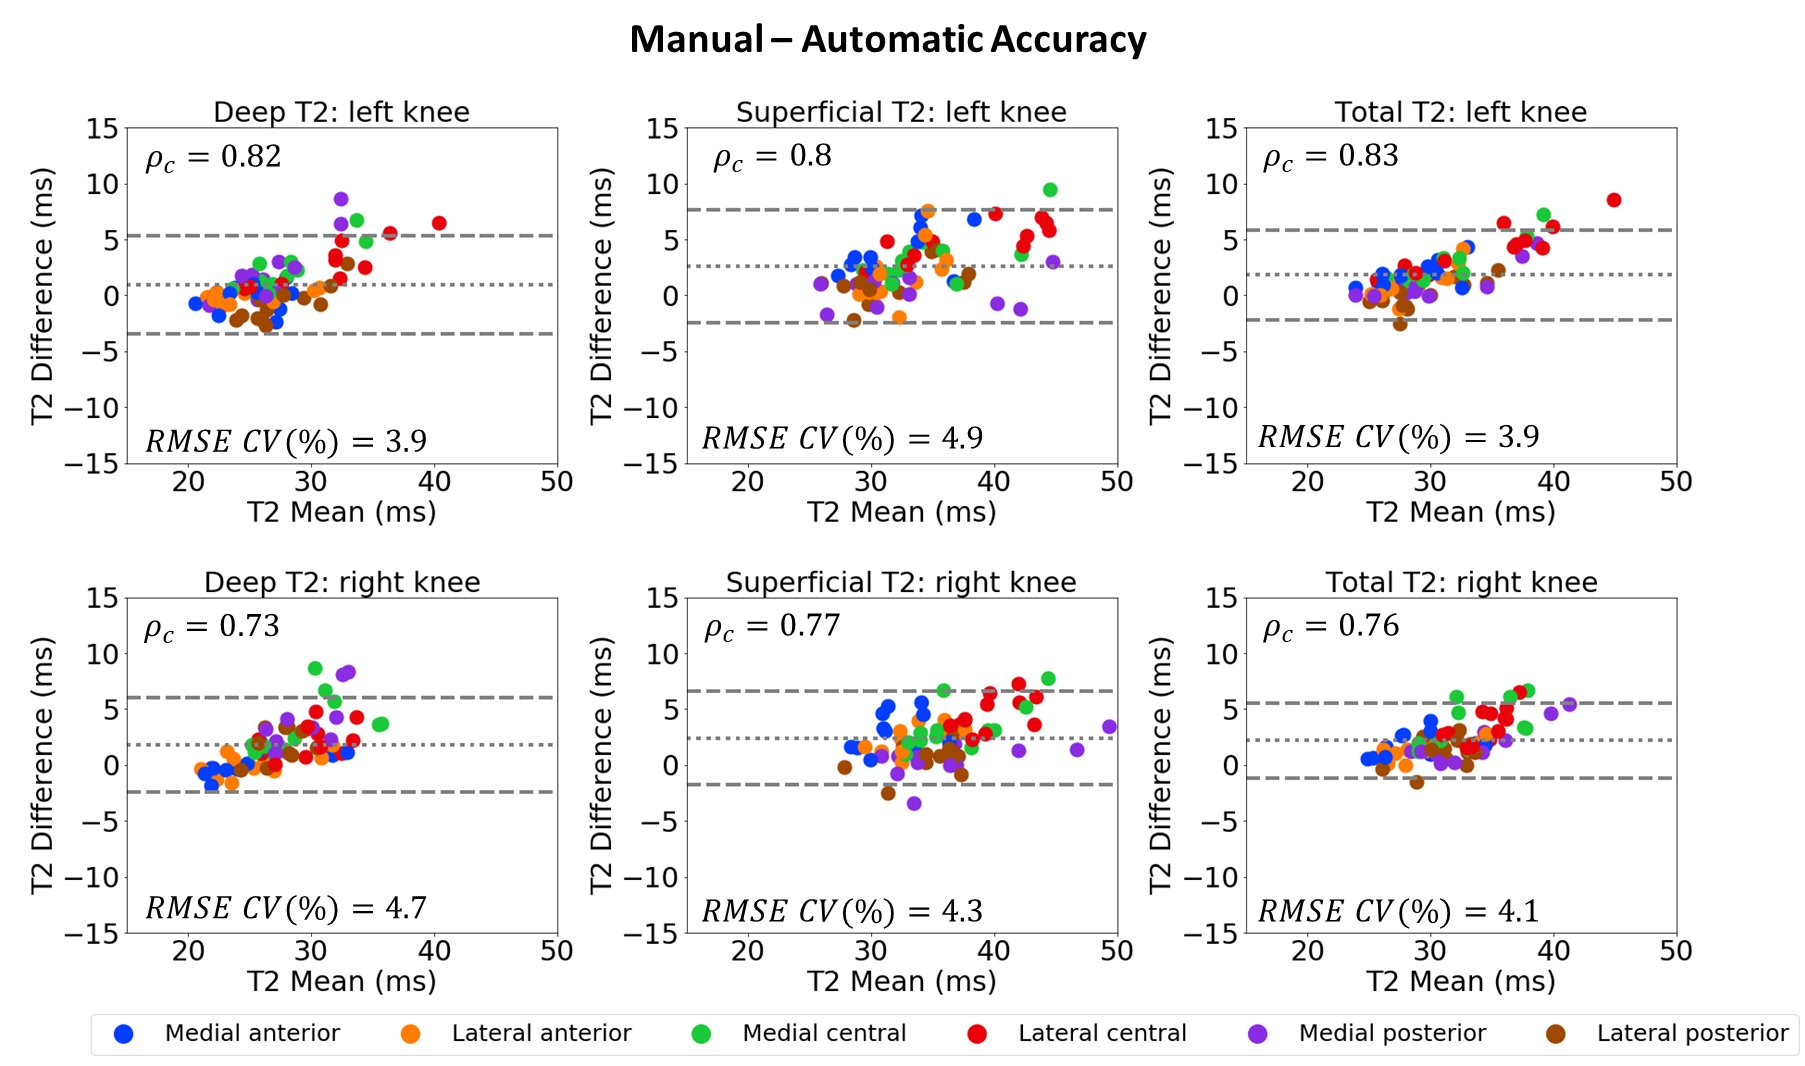
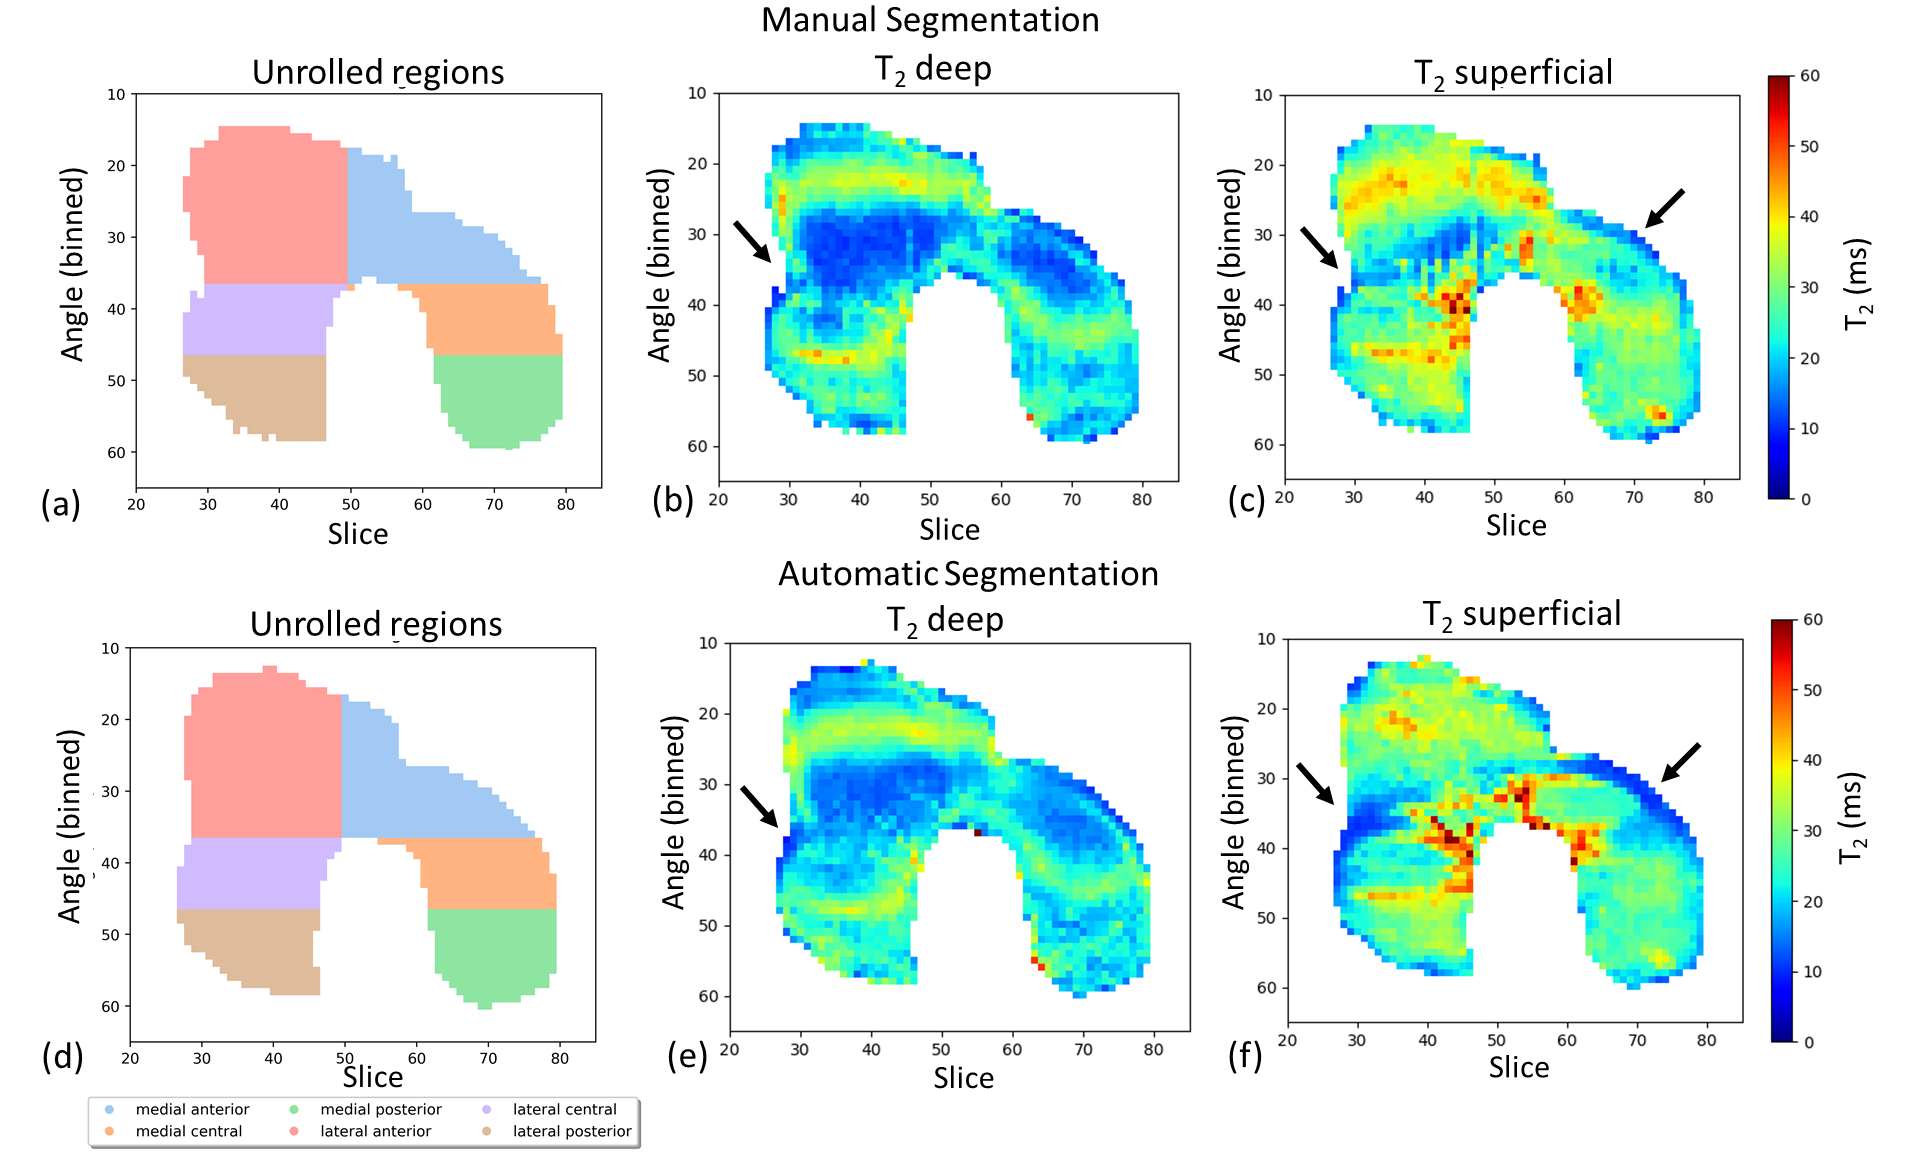
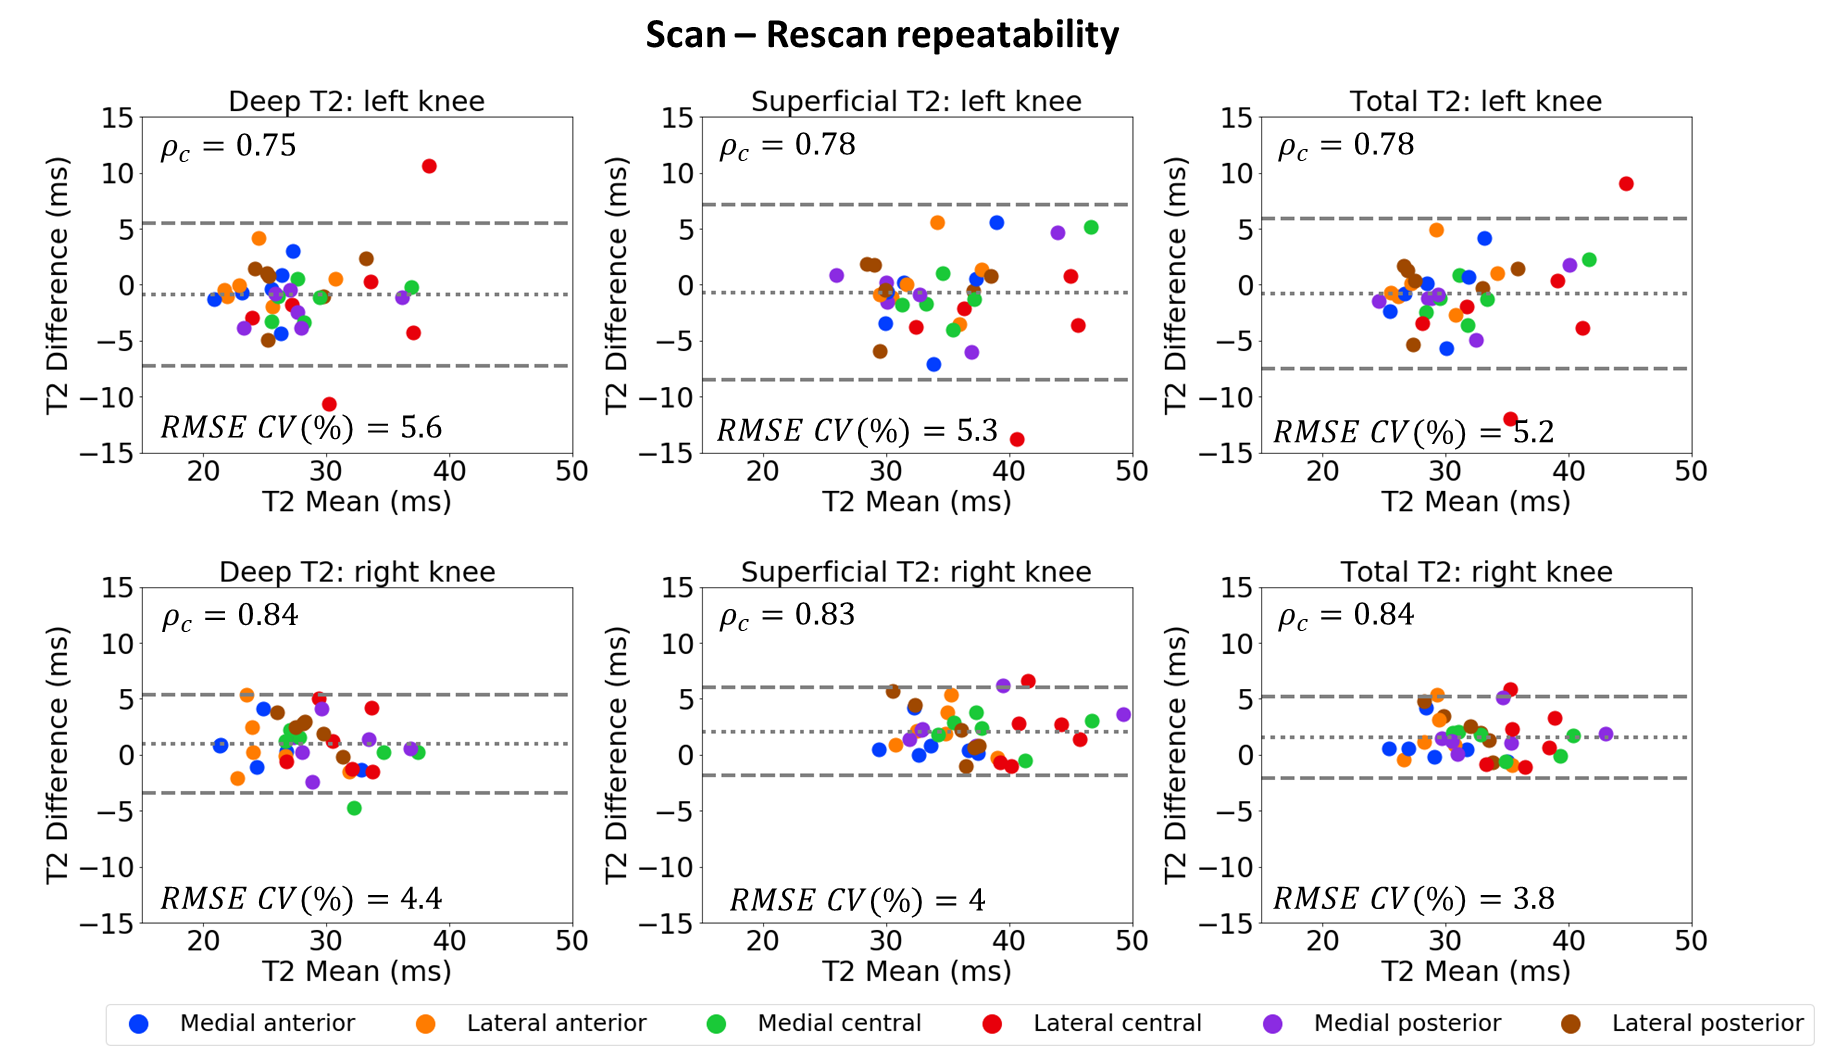
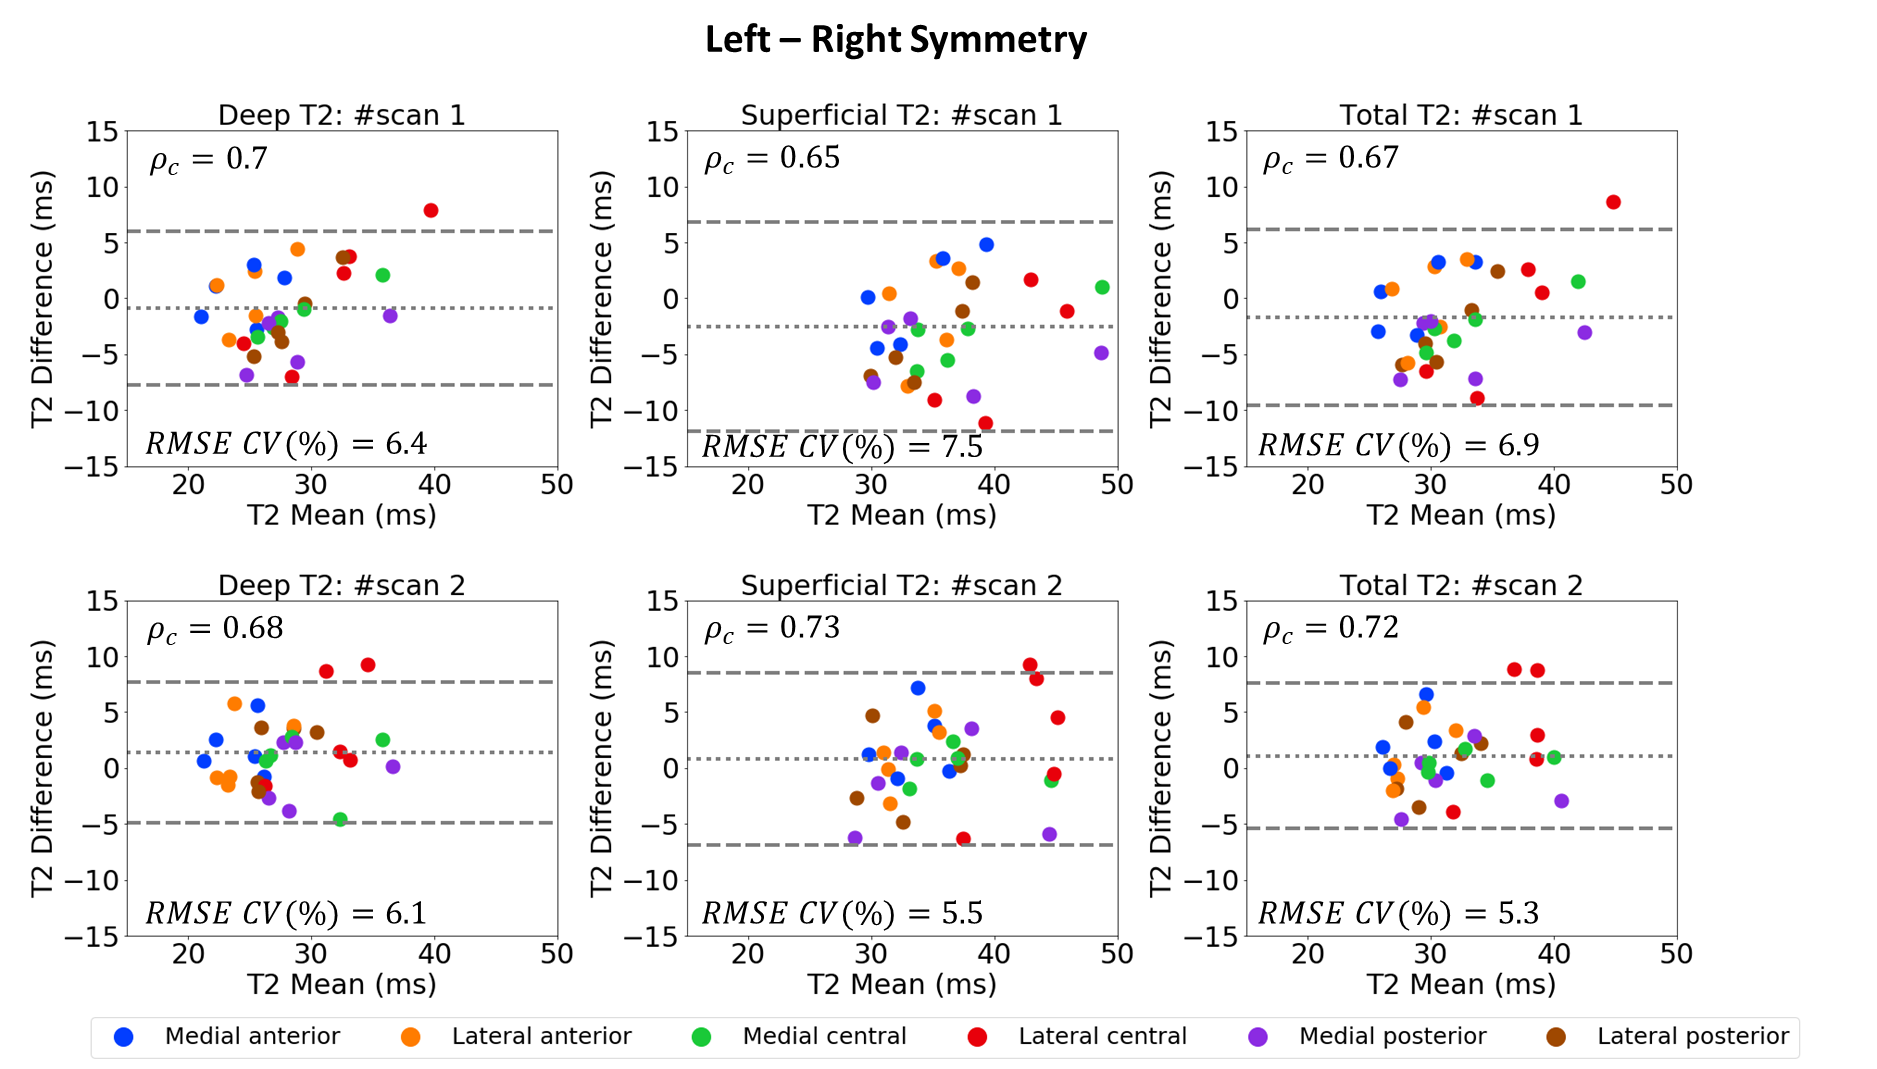
Example of intra-subject asymmetry measurements are shown in Fig. 1. The JSD for a healthy volunteer was more than an order of magnitude higher than that for the ACL-injured subject. Unrolled T2 maps allowed one to identify regions of asymmetry, such as the trochlea. The BA plots for assessment of the manual-automatic segmentation accuracy are reported in Fig. 2 along with the concordance metrics (ρc > 0.73 and RMSE CV < 5%, ). The BA plots showed a minimal bias with differences almost symmetric around zero. This behavior can be explained by looking at Fig. 3 where a qualitative comparison between the results obtained using a manual and an automatic segmentation is reported. With automatic segmentation, cartilage edges slices were segmented with lower accuracy. Scan-rescan BA repeatability (Fig. 4) demonstrated that the mean values of the differences were close to zero and the measurements were scattered above and below the zero-difference line (ρc > 0.73 and RMSE CV < 5.6 %). There were no systematic errors observed. Fig. 5 reports BA plots for left-right symmetry, where 0.65 < ρc < 0.73 and 5.3%< RMSE CV < 7.5%. The scan-rescan variability of overall T2 values (ρc =0.85) was comparable to manual-automated segmentation variability (ρc =0.86).Discussion
Overall there is a very good agreement between manual and automatic segmentation, and scan-rescan repeatability results suggest that repeated iterations of the protocol can provide comparable quantitative measurements. Left-right symmetry shows less level of agreement. However, between-knee symmetry has not been studied conclusively, and these results aim to quantitatively estimate the variability.Conclusion
A rapid bilateral knee MRI protocol has been proposed along with a fully-automated pipeline for quantitative T2 analysis of femoral cartilage of both knees. The preliminary results have shown the method to have good scan-rescan repeatability and a good agreement between manual and automatic segmentation. The proposed method can make more feasible bilateral knee studies allowing to focus on asymmetries between knees, which may help highlighting knee OA pathways through longitudinal studies as well as cross-sectional studies.Acknowledgements
No acknowledgement found.References
[1] Liu F, Chaudhary R, Hurley SA, Munoz Del Rio A, Alexander AL, Samsonov A, Block WF, Kijowski R. Rapid multicomponent T2 analysis of the articular cartilage of the human knee joint at 3.0T. J Magn Reson Imaging 2014;39:1191–1197.
[2] Jungmann PM, Brucker PU, Baum T, et al. Bilateral cartilage T2 mapping 9 years after Mega-OATS implantation at the knee: a quantitative 3T MRI study. Osteoarthritis Cartilage 2015;23:2119–2128.
[3] Monu UD, Jordan CD, Samuelson BL, Hargreaves BA, Gold GE, McWalter EJ. Cluster analysis of quantitative MRI T2 and T1ρ relaxation times of cartilage identifies differences between healthy and ACL-injured individuals at 3T. Osteoarthritis and cartilage 2017;25(4):513-520.
[4] Kogan F, Levine, E, Chaudhari AS, Monu UD, Epperson K, Oei EH, Gold GE and Hargreaves BA (2018), Simultaneous bilateral‐knee MR imaging. Magn. Reson. Med., 80: 529-537. doi:10.1002/mrm.27045.
[5] Chaudhari AS, Black MS, Eijgenraam S, Wirth W, Maschek S, Sveinsson B, Eckstein F, Oei EH, Gold GE, Hargreaves BA. Five‐minute knee MRI for simultaneous morphometry and T2 relaxometry of cartilage and meniscus and for semiquantitative radiological assessment using double‐echo in steady‐state at 3T. Journal of Magnetic Resonance Imaging 2018;47(5):1328-1341.
[6] Sveinsson B, Chaudhari A, Gold G, Hargreaves B. A simple analytic method for estimating T2 in the knee from DESS. Magnetic resonance imaging 2017;38:63-70. [7] Lin J. Divergence Measures Based on the Shannon Entropy. IEEE Transactions on Information Theory. 1991; (33) 1: 145-151. [8] Endres M. and Schindelin J. E. A new metric for probability distributions. IEEE Trans. on Info. Thy. 2003; (49) 3: 1858-1860.
Figures