1330
MRI texture analysis of vertebral subchondral bone1Radiology, Renmin Hospital of Wuhan University, Wuhan, China, 2Renmin Hospital of Wuhan University, Wuhan, China, 3GE Healthcare China, Bejing, China
Synopsis
The purpose of this study is to assess the feasibility of MRI texture analysis as a method of quantifying vertebral subchondral bone (VSB) in early intervertebral disk degeneration (IDD). Sagittal T1WI, T2WI and T2* mapping images of lumbar vertebra were scanned at 3T MRI. Texture parameter values(mean, variance, skewness, correlation and entropy) of VSB (on T1WI) and T2* value of CEP were used for statistical evaluations. It was found that Significant differences in VSB texture parameters (mean ,variance and entropy) and T2* value of CEP were demonstrated between groups at the cephalic and caudal. Accordingly, texture parameter-mean showed significantly higher diagnostic accuracy than other texture parameters (variance and entropy) and T2* value for differentiating early IDD. MRI texture analysis can be used to assess human lumbar early IDD.
Introduction
Intervertebral disk degeneration (IVDD) is a leading cause of lumbar spine related low back pain. Multiple factors, such as cell aging, dystrophia, biomechanical changes, may lead to intervertebral disc proteoglycan degradation and loss of collagen and water, which finally resulting in degeneration. VSB and cartilaginous endplate (CEP) play a critical role in spinal function and maintenance of intervertebral disk health [1].Method
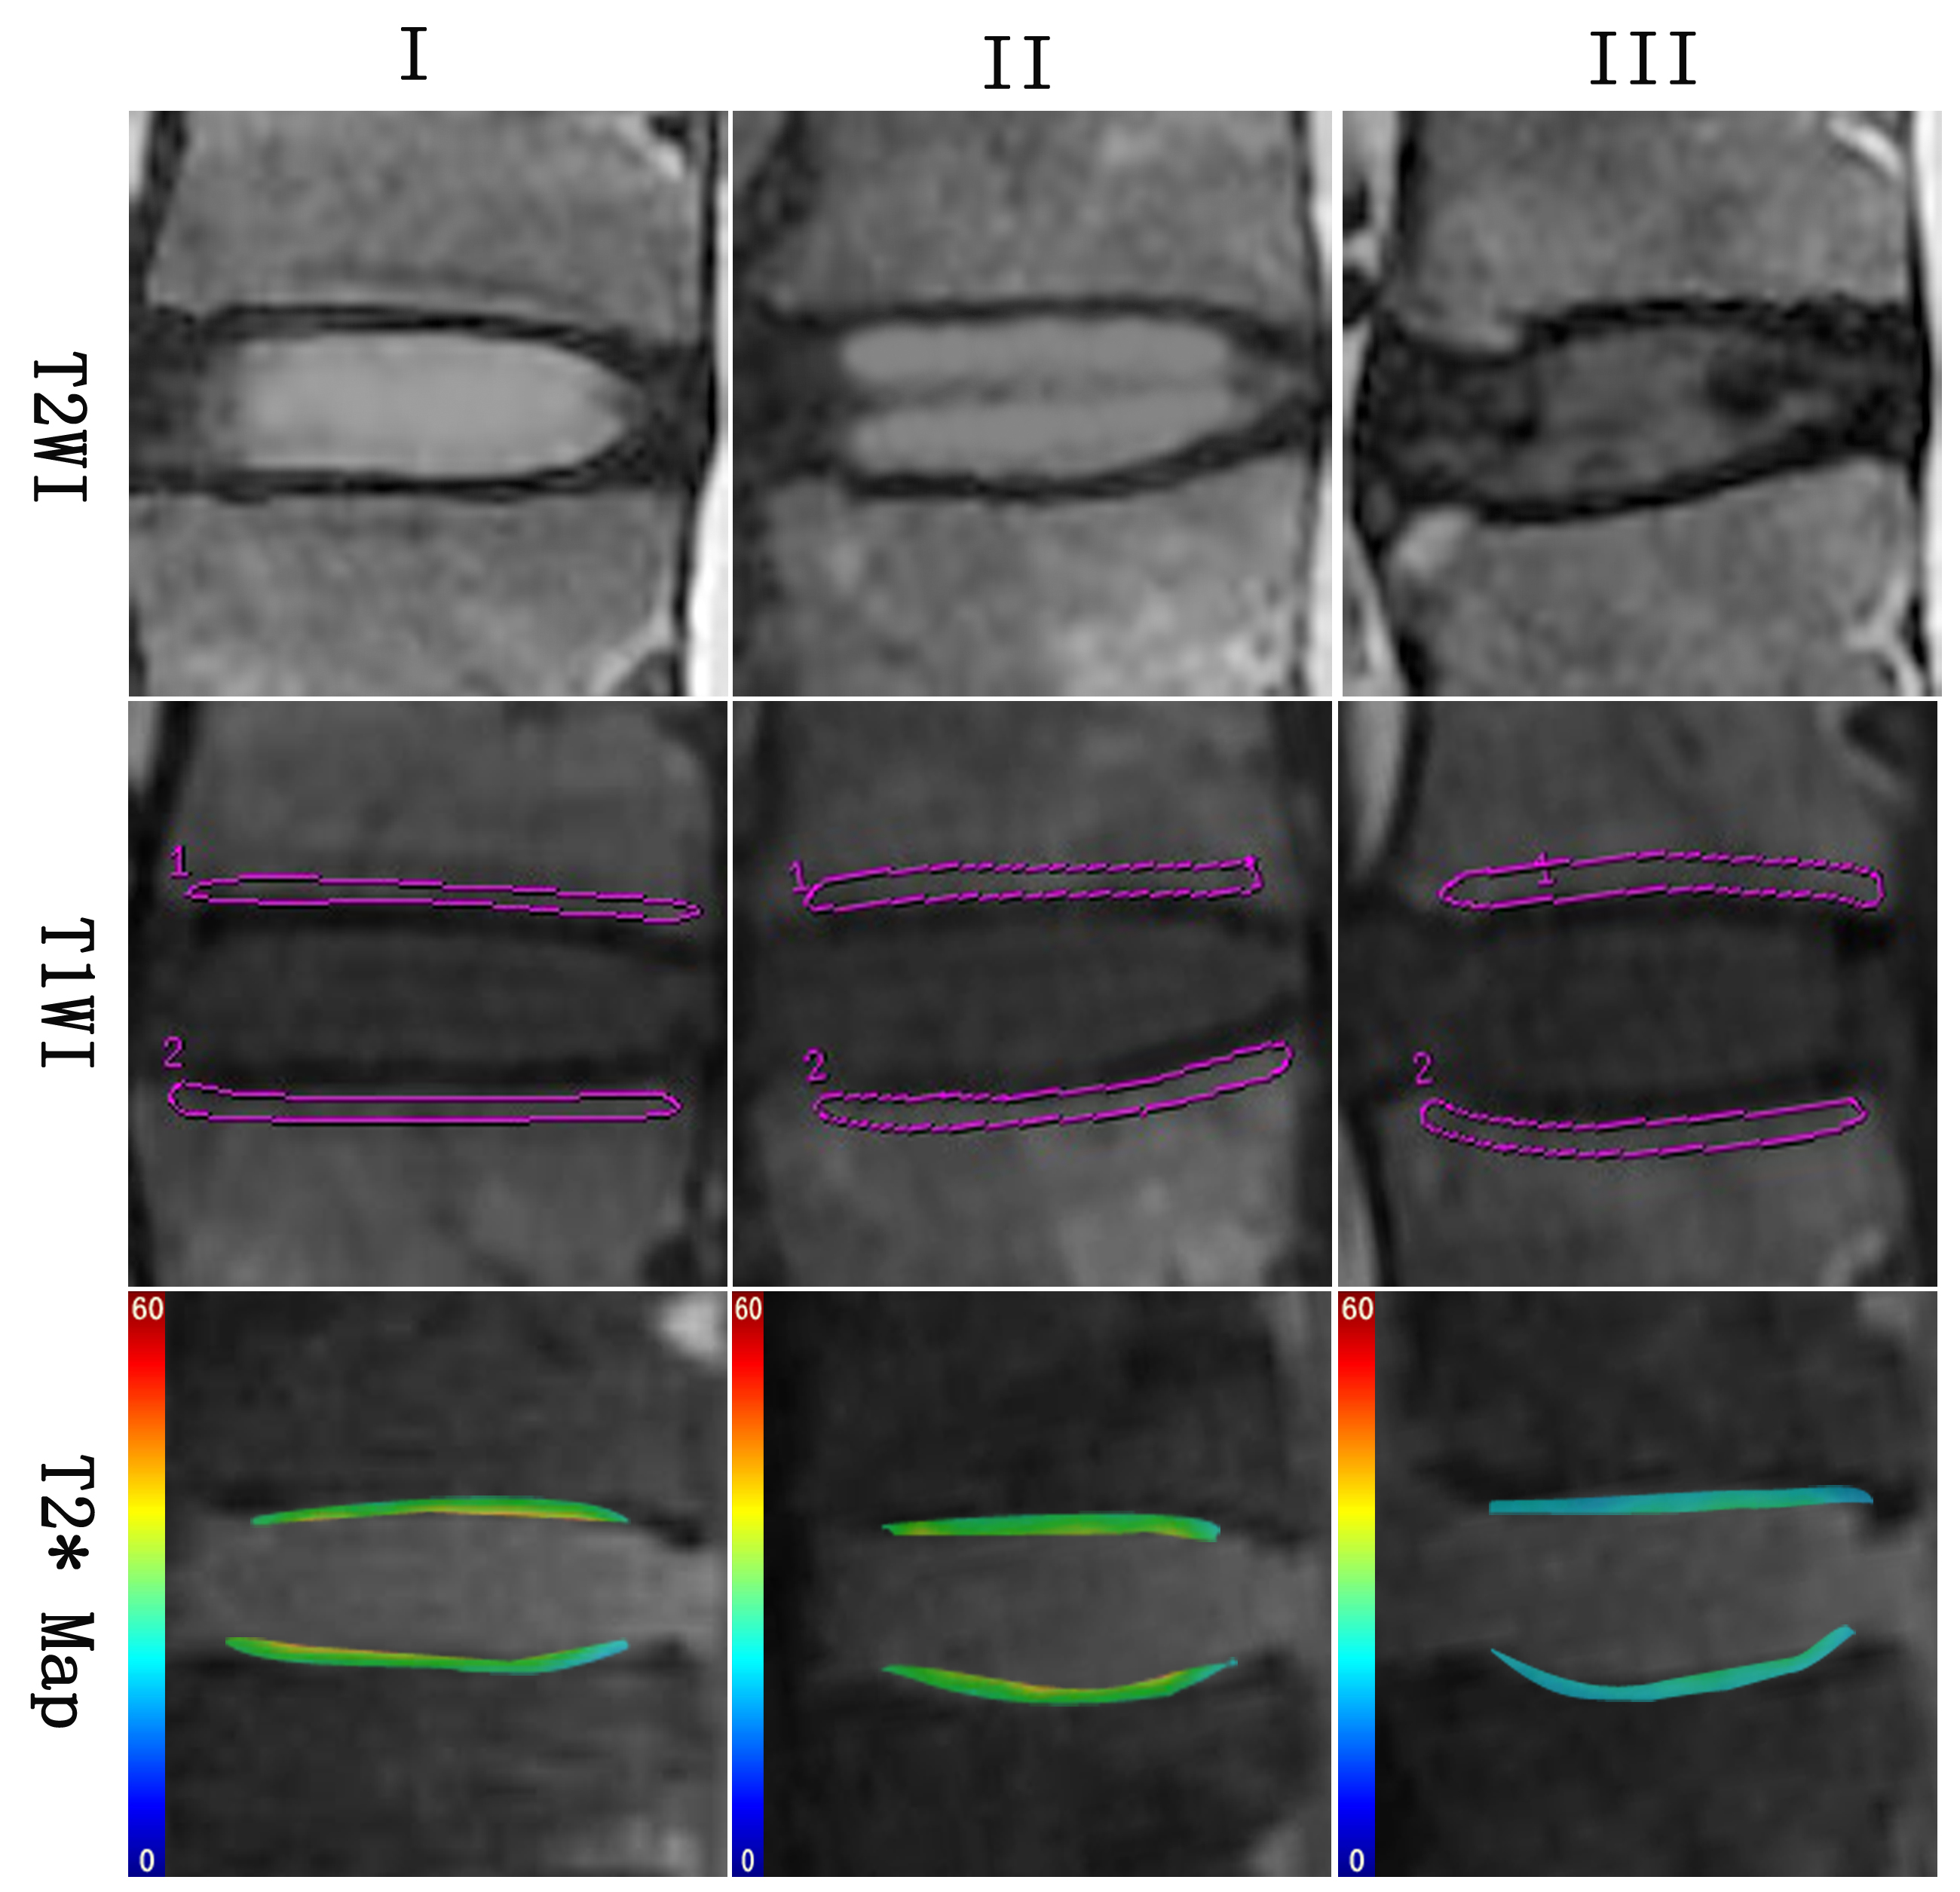
A tall of 80 subjects underwent sagittal T1WI, T2WI and T2* mapping of lumbar vertebra at 3T MRI. According to the Pfirrmann grade system [2], three groups were performed: group Ⅰ (Pfirrmann grade Ⅰ), group Ⅱ (Pfirrmann grade Ⅱ), group Ⅲ (Pfirrmann grade Ⅲ). Regions of interest were created in the cephalic and caudal on T1WI in all the groups, as well as cephalic and caudal CEP on T2* Map (Fig. 1). Texture parameter values(mean, variance, skewness, correlation and entropy) of VSB and T2* value of CEP were used for statistical evaluations. ANOVA, Kruskal-Wallis test, Mann-Whitney U test and Dunnett’s T3 test were performed. Receiver operation characteristic curves (ROC) were generated for each statistical parameters to assess the area under the receiver operating characteristic curve (AUC), sensitivity and specificity for differentiating grade Ⅰ and Ⅱ.Results
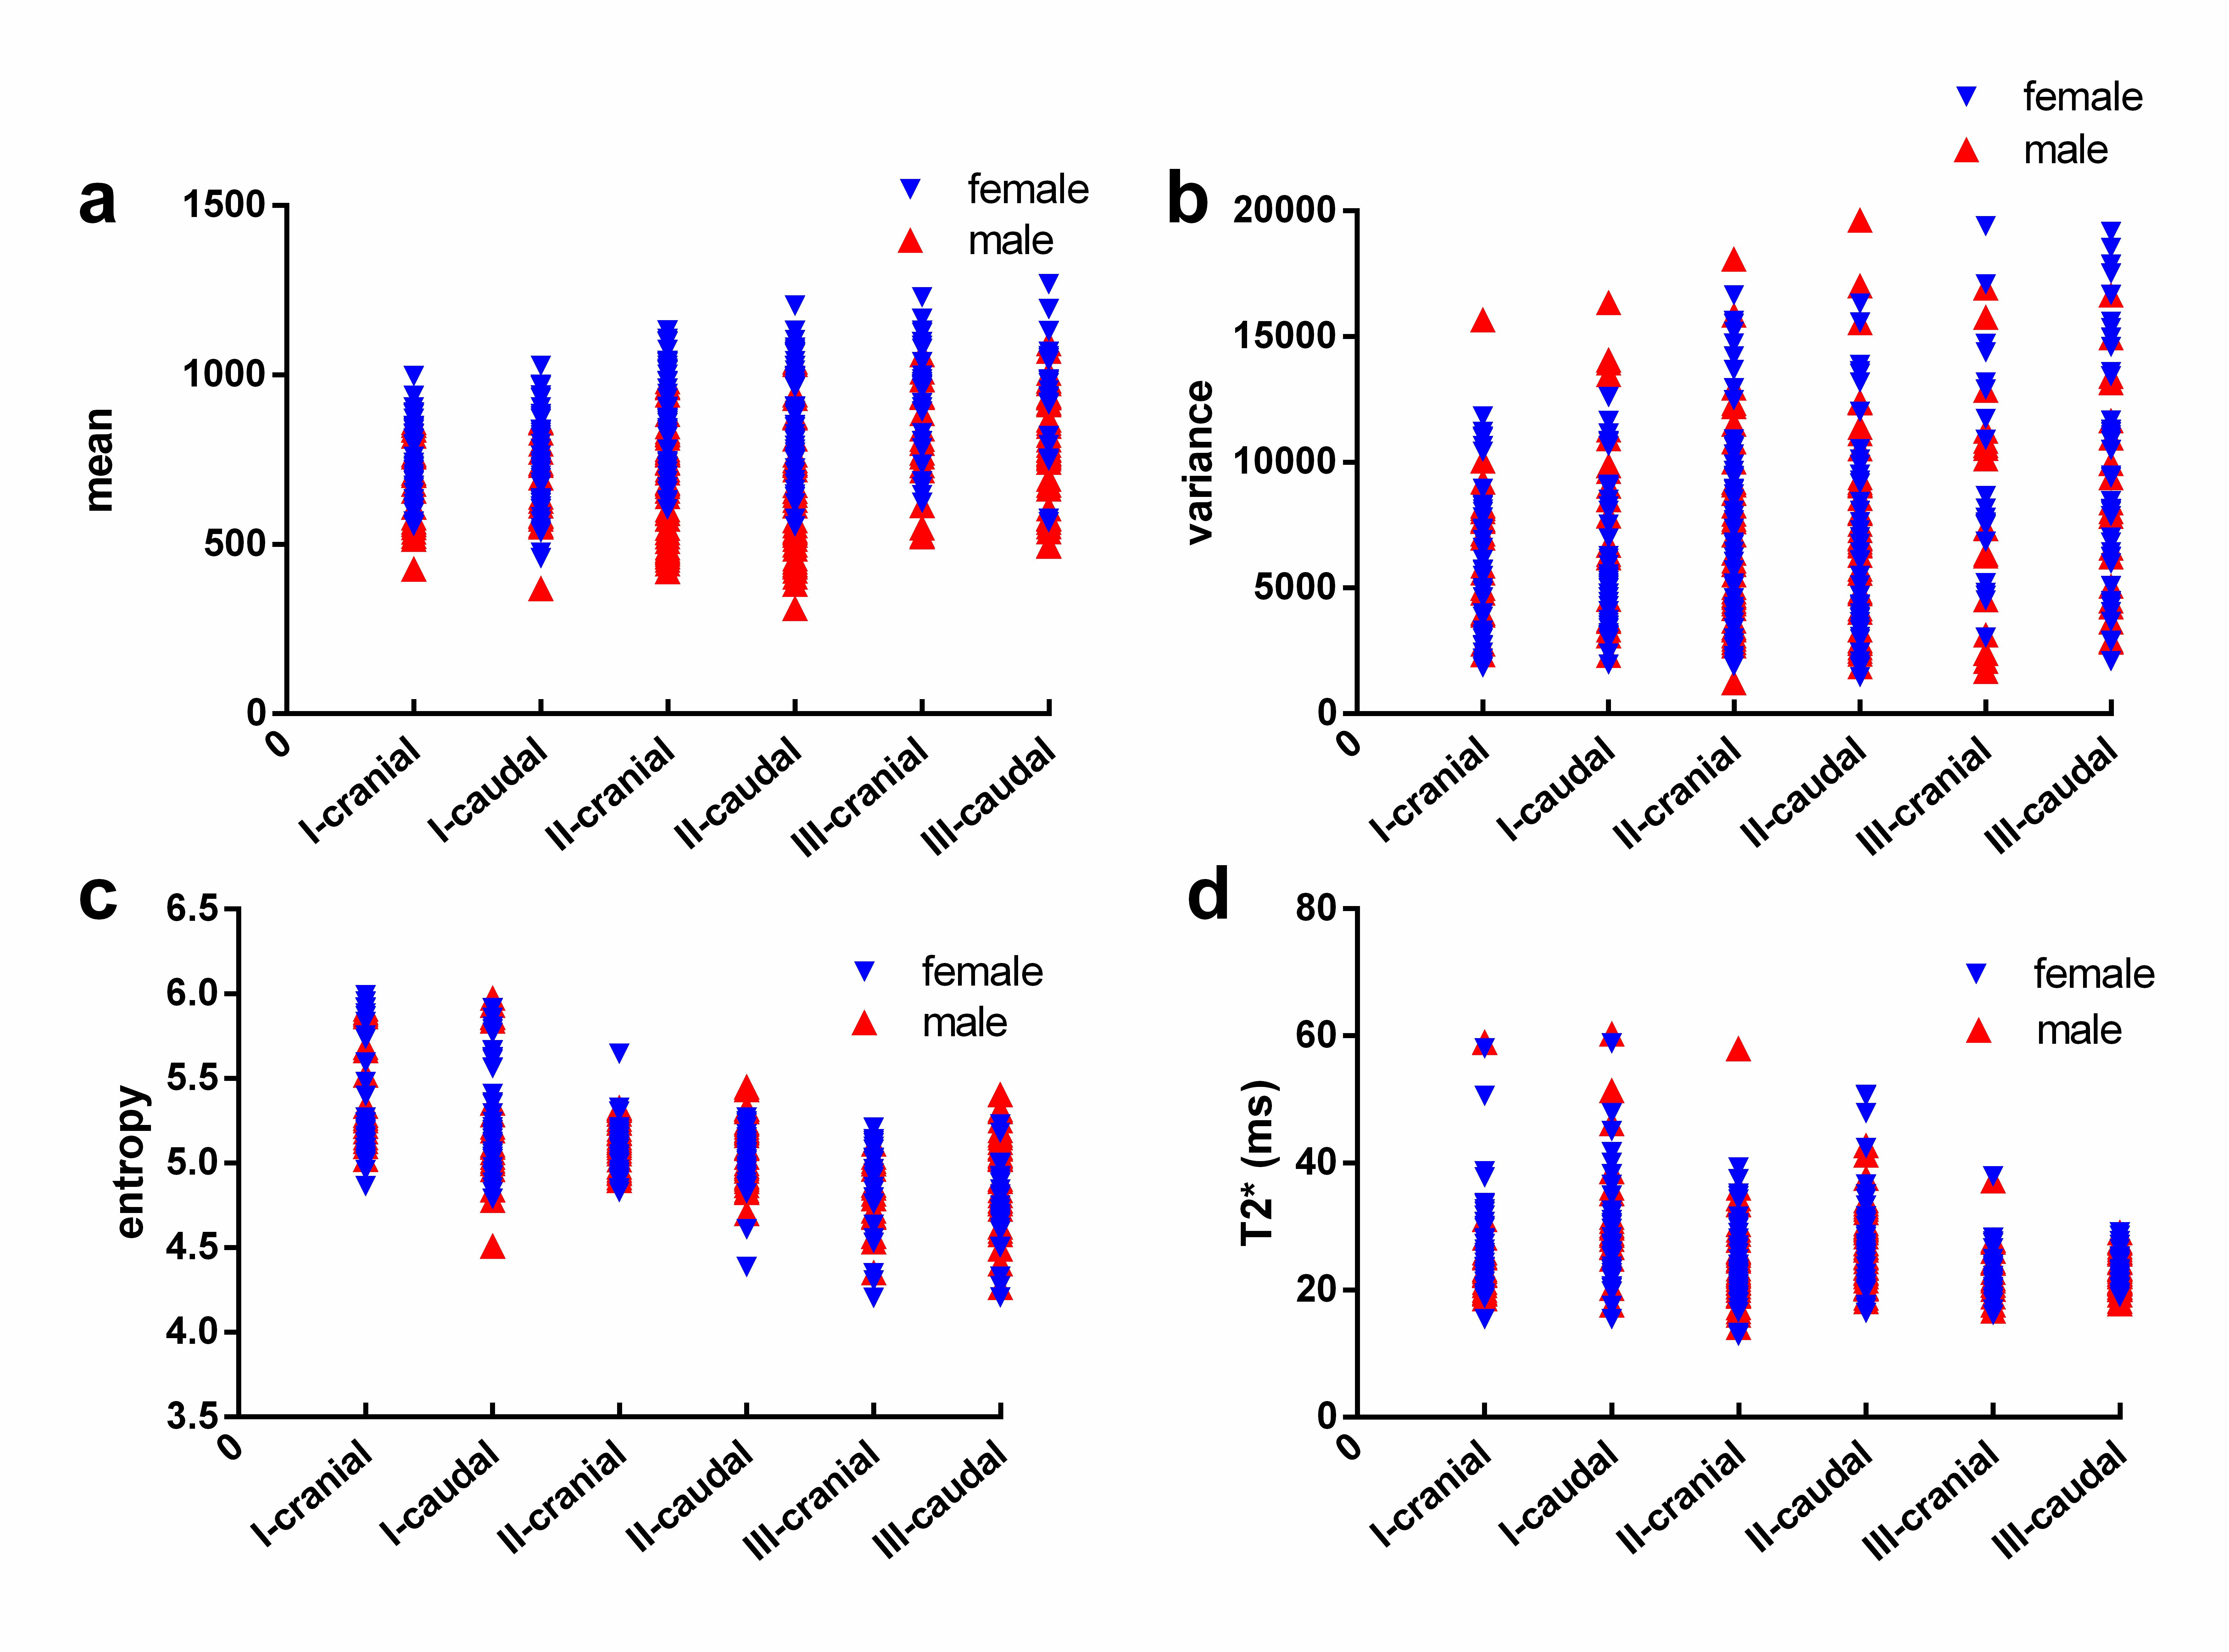
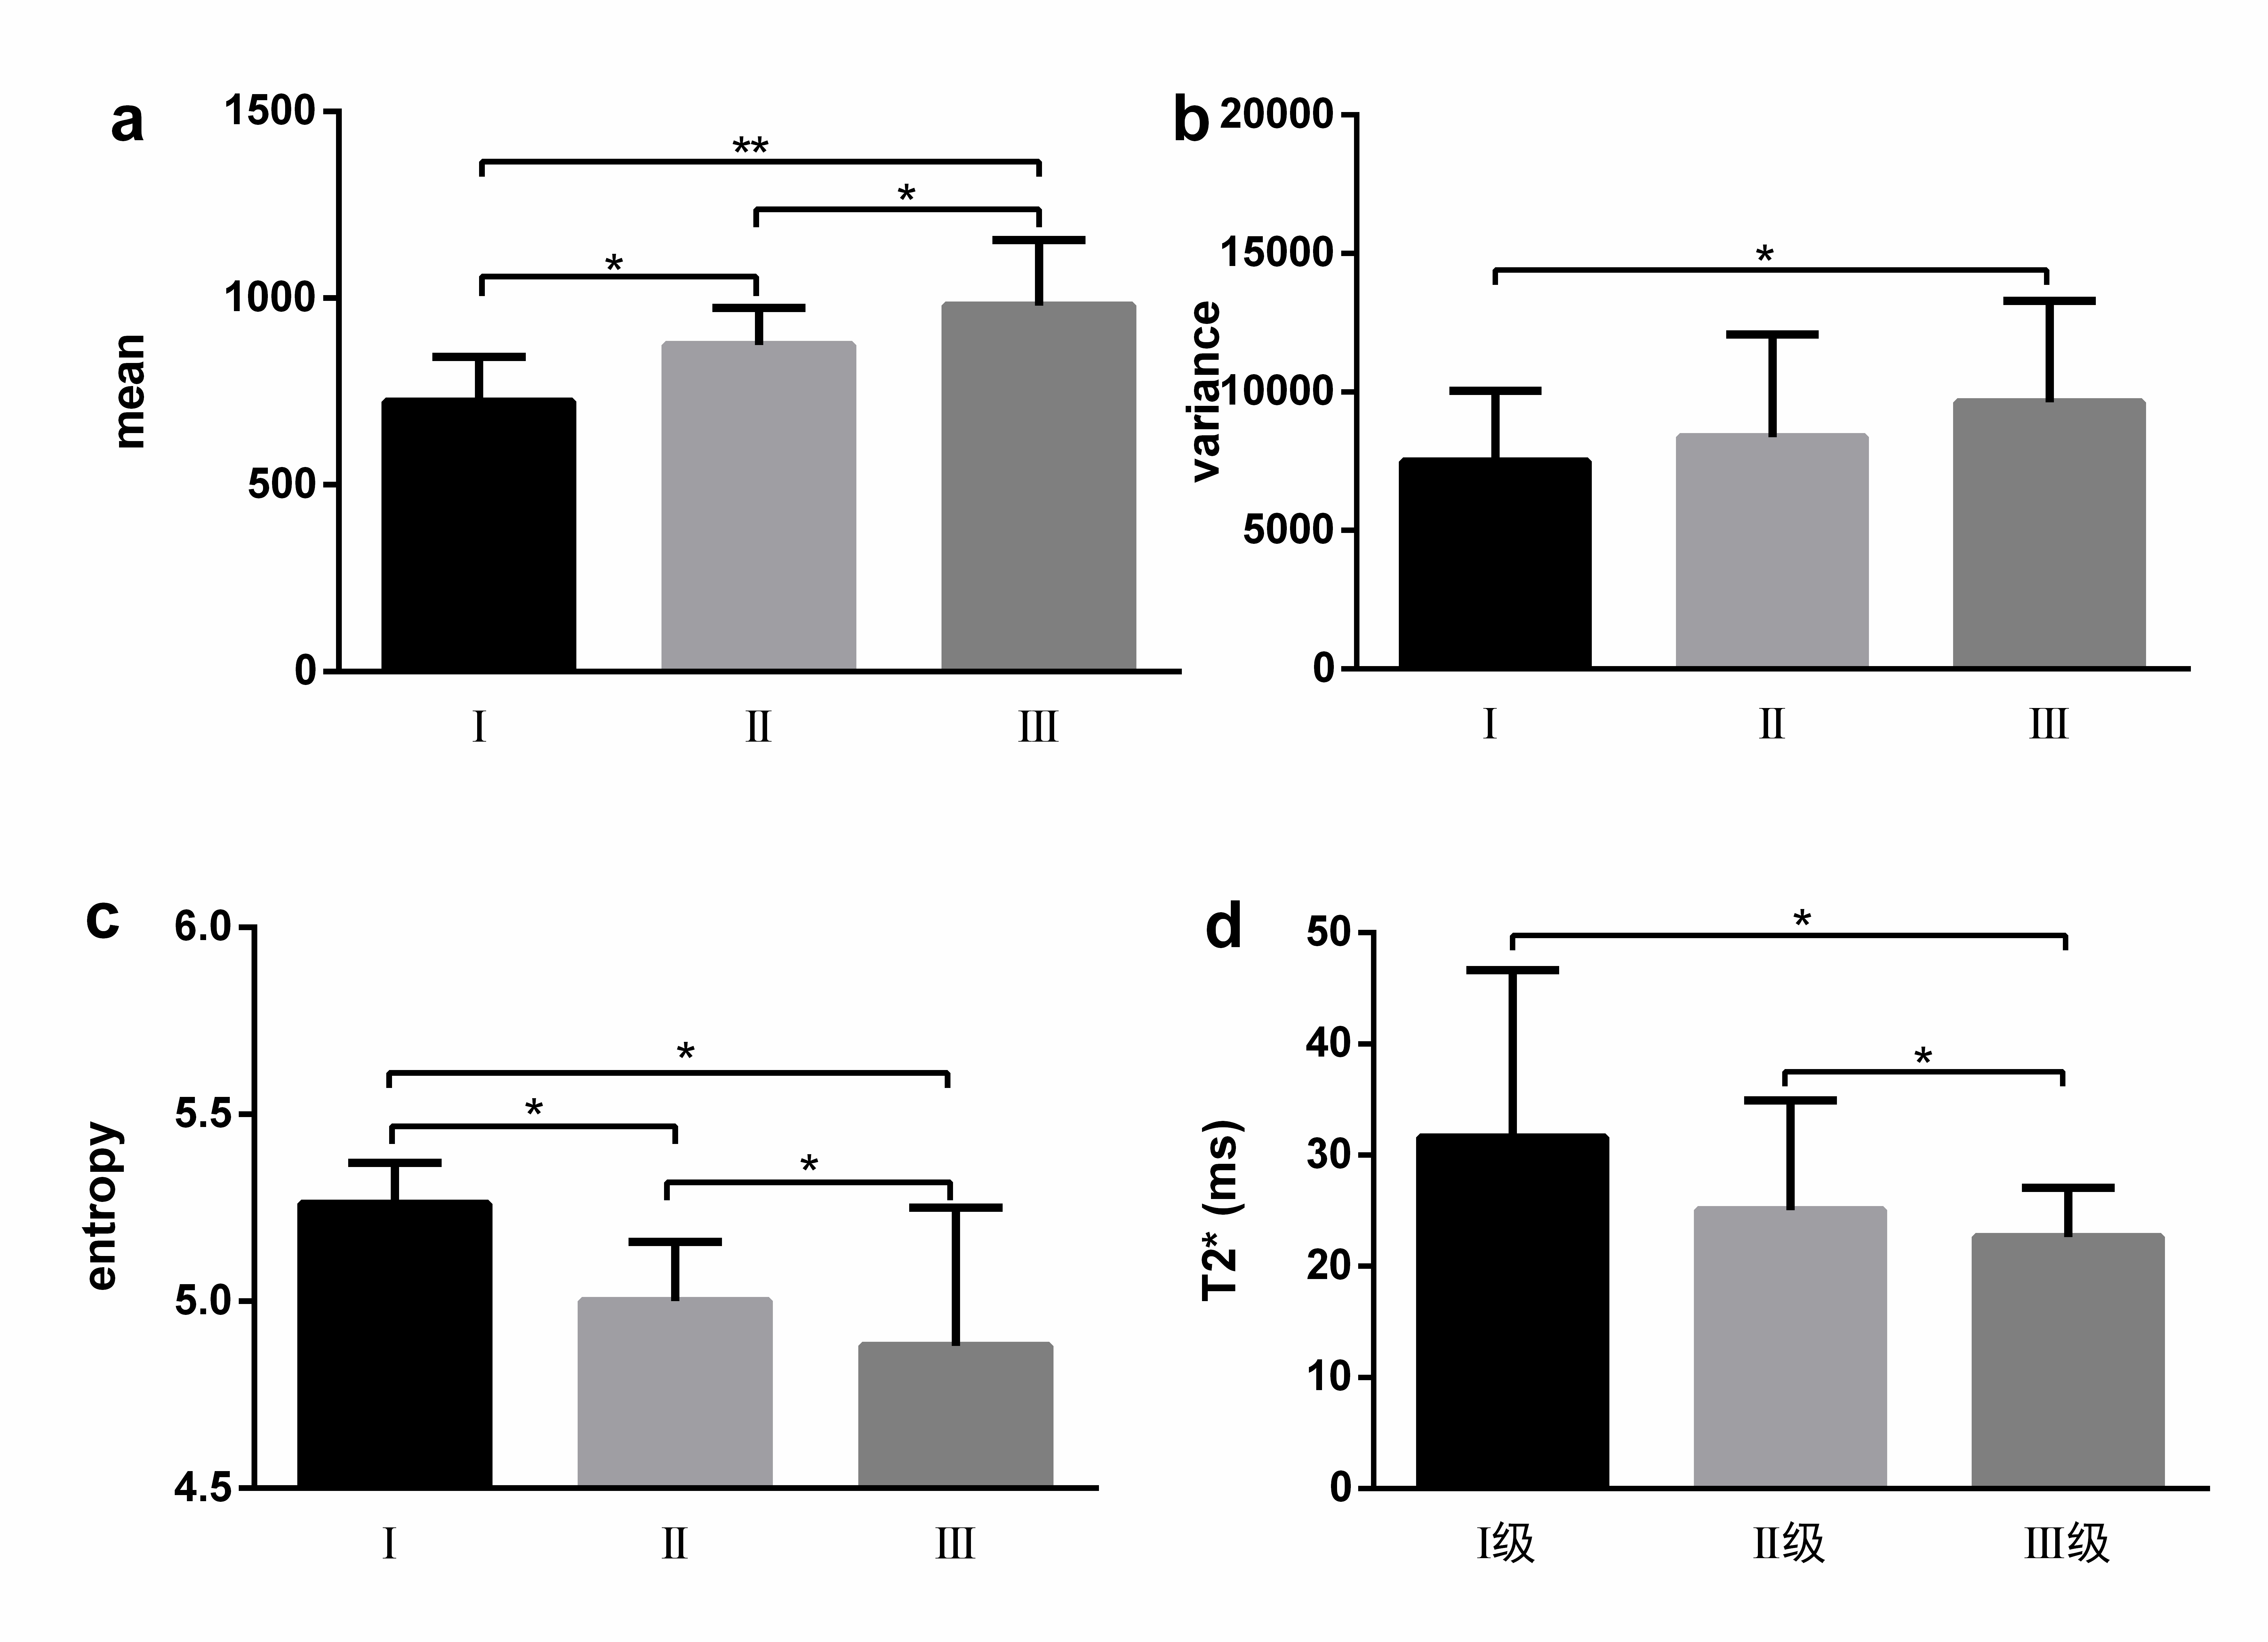
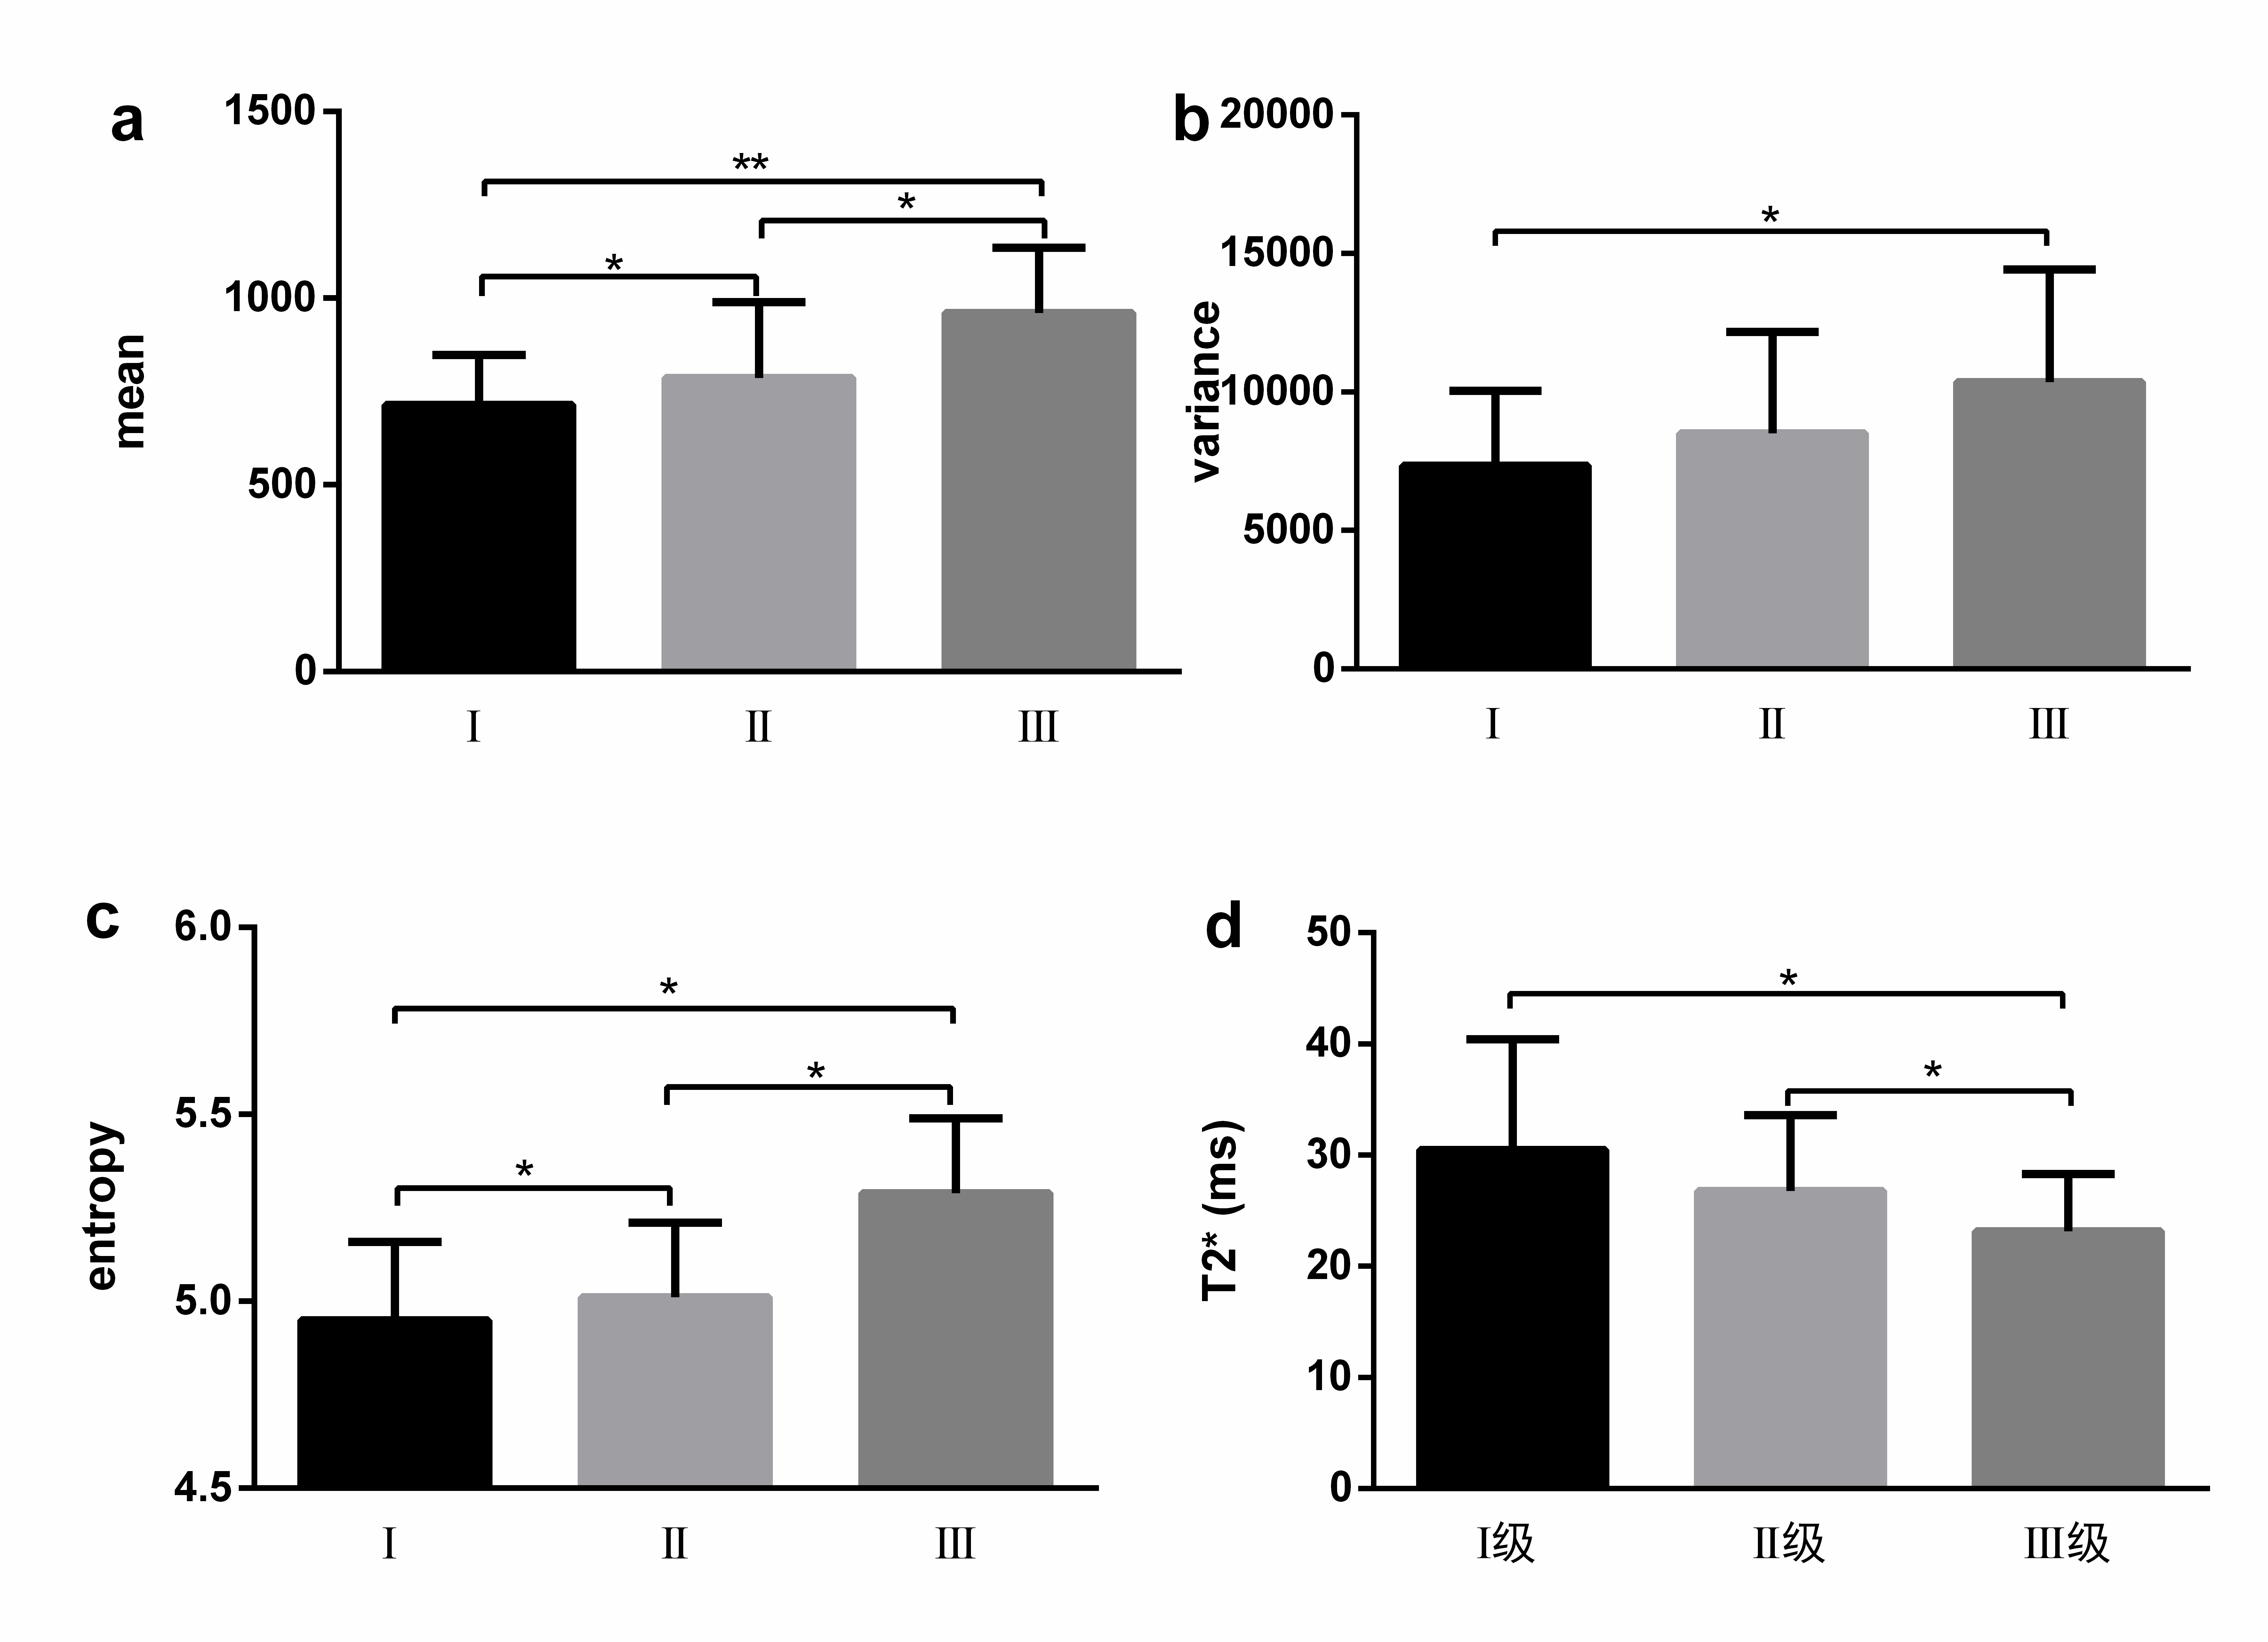
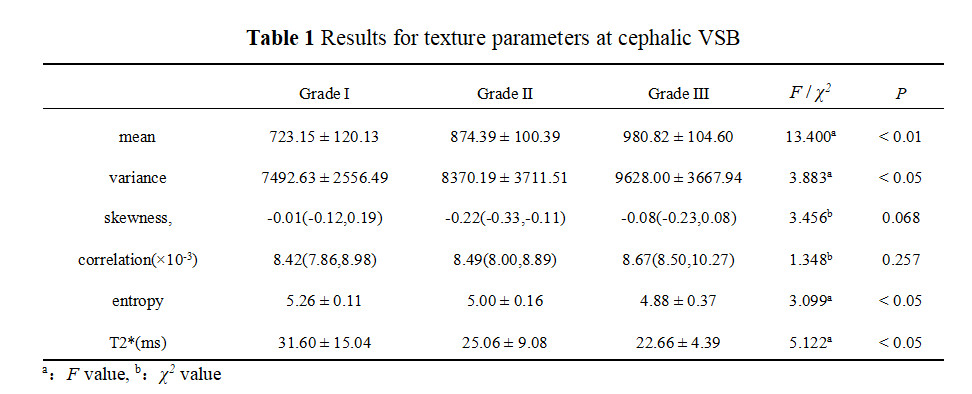
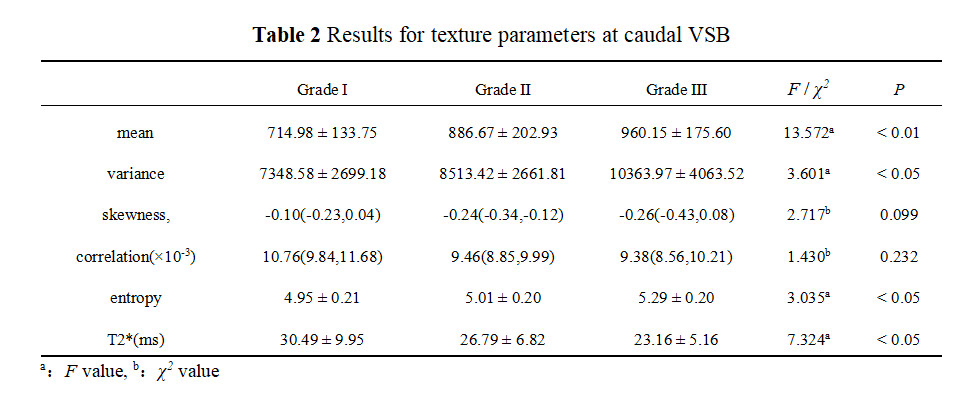
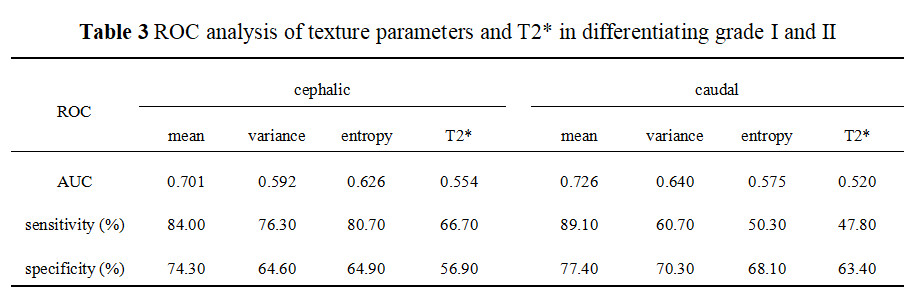
Significant differences in VSB texture parameters (mean ,variance and entropy) and T2* value of CEP were demonstrated between groups at the cephalic (Table 1) and caudal (Table 2) (all P < 0.05). No significant difference was found in men and women for all calculated values in all grade groups (all P > 0.05) (Fig. 2). Multiple comparisons results showed that both in cephalic and caudal, significant difference was found in all grades comparisons of mean and entropy (all P < 0.05) and no significant difference was found in the comparison of the variance value of group Ⅰ and Ⅱ and group Ⅱ and Ⅲ, as well as the T2* value of group Ⅰ and Ⅱ (all P > 0.05) (Fig. 3 and 4). And no significant difference was found in cephalic and caudal of all calculated values. ROC analysis (Table 3) demonstrated that texture parameter-mean showed significantly higher diagnostic accuracy than other texture parameters (variance and entropy) and T2* value for differentiating grade Ⅰ and Ⅱ, both in cephalic and caudal.Discussion
This study demonstrated a significant difference in the MR VSB texture of Pfirrmann grade Ⅰ, Ⅱ and Ⅲ. Discriminant analysis using texture parameters was able to accurately classify subjects into the correct group. These results suggest that MR texture analysis is a feasible method of quantifying VSB architecture at early IDD stage.Conclusion
MRI texture analysis can be used to assess human lumbar early IDD.Acknowledgements
I would like to thank my supervisor Professor Yunfei Zha for his guidance and Yang Fan from GE Healthcare for his technical assistance.References
[1] Cui YZ, Yang XH, Liu PF,et al.Preliminary study on diagnosis of lumbar disc degeneration with magnetic resonanceT1ρ, T2 mapping and DWI quantitative detection technologies[J]. Eur Rev Med Pharmacol Sci, 2016,20(16):3344-3350.
[2] Pfirrmann CW, Metzdorf A, Zanetti M, et al. Magnetic resonance classification of lumbar intervertebral disc degeneration[J]. Spine, 2001,26(17):1873-1878.
Figures