1329
Comparison of Single-Component and Multi-Component T2 Parameters and Mechanical Parameters of Human Patellar Cartilage at 3.0T1Mechanical Engineering, University of Wisconsin-Madison, Madison, WI, United States, 2Radiology, University of Wisconsin-Madison, Madison, WI, United States, 3Radiology, University of California-San Diego, San Diego, CA, United States
Synopsis
Multi-component Driven Equilibrium Single Pulse Observation of T1 and T2 (mcDESPOT) was used to measure single-component T2 relaxation time (T2Single) and the fraction of the fast relaxing macromolecular bound water component (FF) of 24 human patellar cartilage samples at 3.0T. The cartilage samples underwent unconfined compression testing to measure linear modulus and energy dissipation at 0.01Hz and 10Hz. There were low and marginally statistically significant (p=0.052-0.084) negative correlations between T2Single and linear modulus and energy dissipation. There were moderate and statistically significant (p<0.002) positive correlations between FF and linear modulus and energy dissipation.
Introduction
Multi-component Driven Equilibrium Single Pulse Observation of T1 and T2 (mcDESPOT) can be used to measure single component T2 relaxation time (T2Single) and multi-component T2 parameters of cartilage including the T2 relaxation time of the fast relaxing macromolecular bound water component (T2F) and the slow relaxing bulk water component (T2S) and the fraction of the fast relaxing macromolecular bound water component (FF).1-3 Previous studies have shown that FF is the multi-component T2 parameter with the highest sensitivity for detecting cartilage degeneration within the human knee joint.2 This study was performed to determine whether T2Single and FF could provide information regarding the mechanical properties of human patellar cartilage at 3.0T.Methods
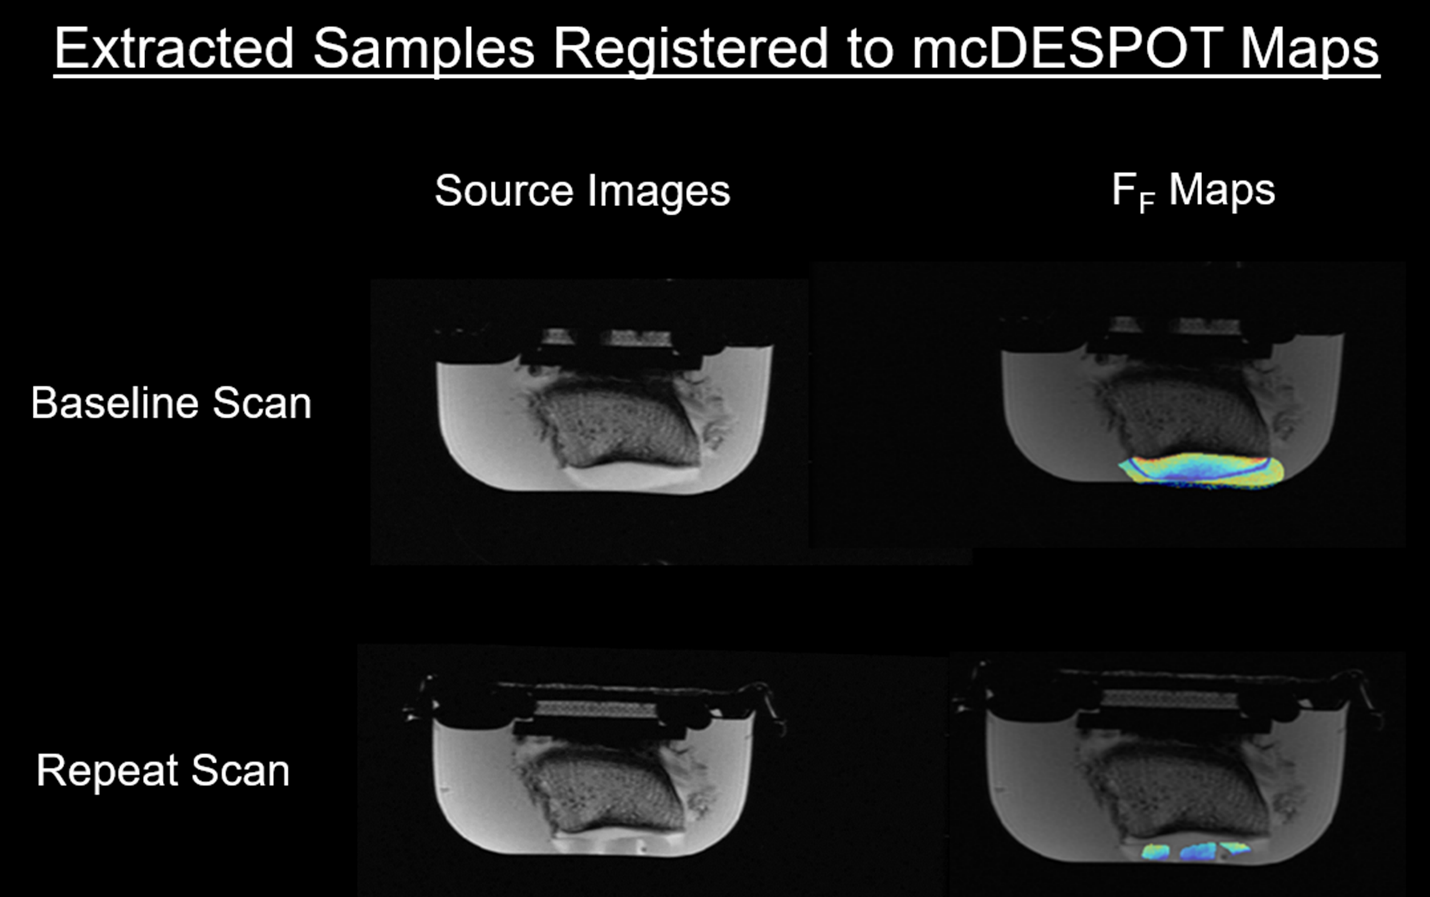
Five patellar specimens were harvested from fresh frozen human cadaveric knees. The specimens were placed in a container filled with phosphate-buffered saline and protease inhibitors and imaged on a 3.0T scanner (Discovery MR750, GE Healthcare; Waukesha, WI) using a single-channel wrist coil (Mayo Clinic, Rochester, MN). Spoiled gradient echo (SPGR) scans were acquired with TR/TE=7.2/2.9ms over a range of flip angles (α =3, 4, 5, 6, 7, 9, 13, 18°). Two fully-balanced steady-state free precession (bSSFP) scans with radiofrequency phase cycling on and off were acquired with TR/TE=6.6/3.2ms over a range of flip angles (α=2, 5, 10, 15, 20, 30, 40, 50°). An inversion recovery IR-SPGR scan with TR/TE=7.2/2.9ms, TI=450ms, and α=5° was also acquired. All scans were performed in the sagittal plane covering the entire patellar specimen using a 14cm field of view, 700 x 240 matrix, 2mm slice thickness, one excitation, and a total scan time of 40 minutes. T2Single and FF maps of patellar cartilage were reconstructed in MATLAB (MathWorks, Natick, MA) using the mcDESPOT model.1, 2 Twenty-four cartilage samples were extracted from the patellar specimens. Mean cartilage T2Single and FF were measured in the exact same locations on the patellar specimens where the cartilage samples were extracted (Figure 1). Cartilage samples were loaded in unconfined compression on a table-top test machine (3230-AT, TA Instruments, Eden Prairie, MN). Samples underwent a 3g tare load, followed by ten cycles to 10% strain at 0.01Hz and 10Hz. Linear modulus was fit to the loading portion of the stress-strain curve. Energy dissipation was calculated as the area between the loading and unloading stress-strain curves by trapezoidal integration. Pearson correlation coefficients were used to compare T2Single and FF and linear modulus and energy dissipation of the cartilage samples at 0.01Hz and 10Hz.Results
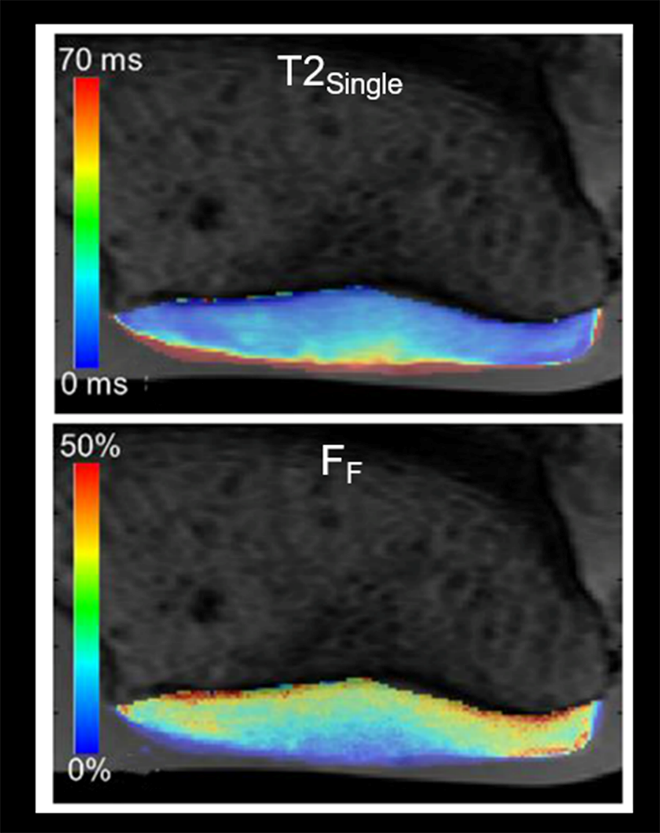
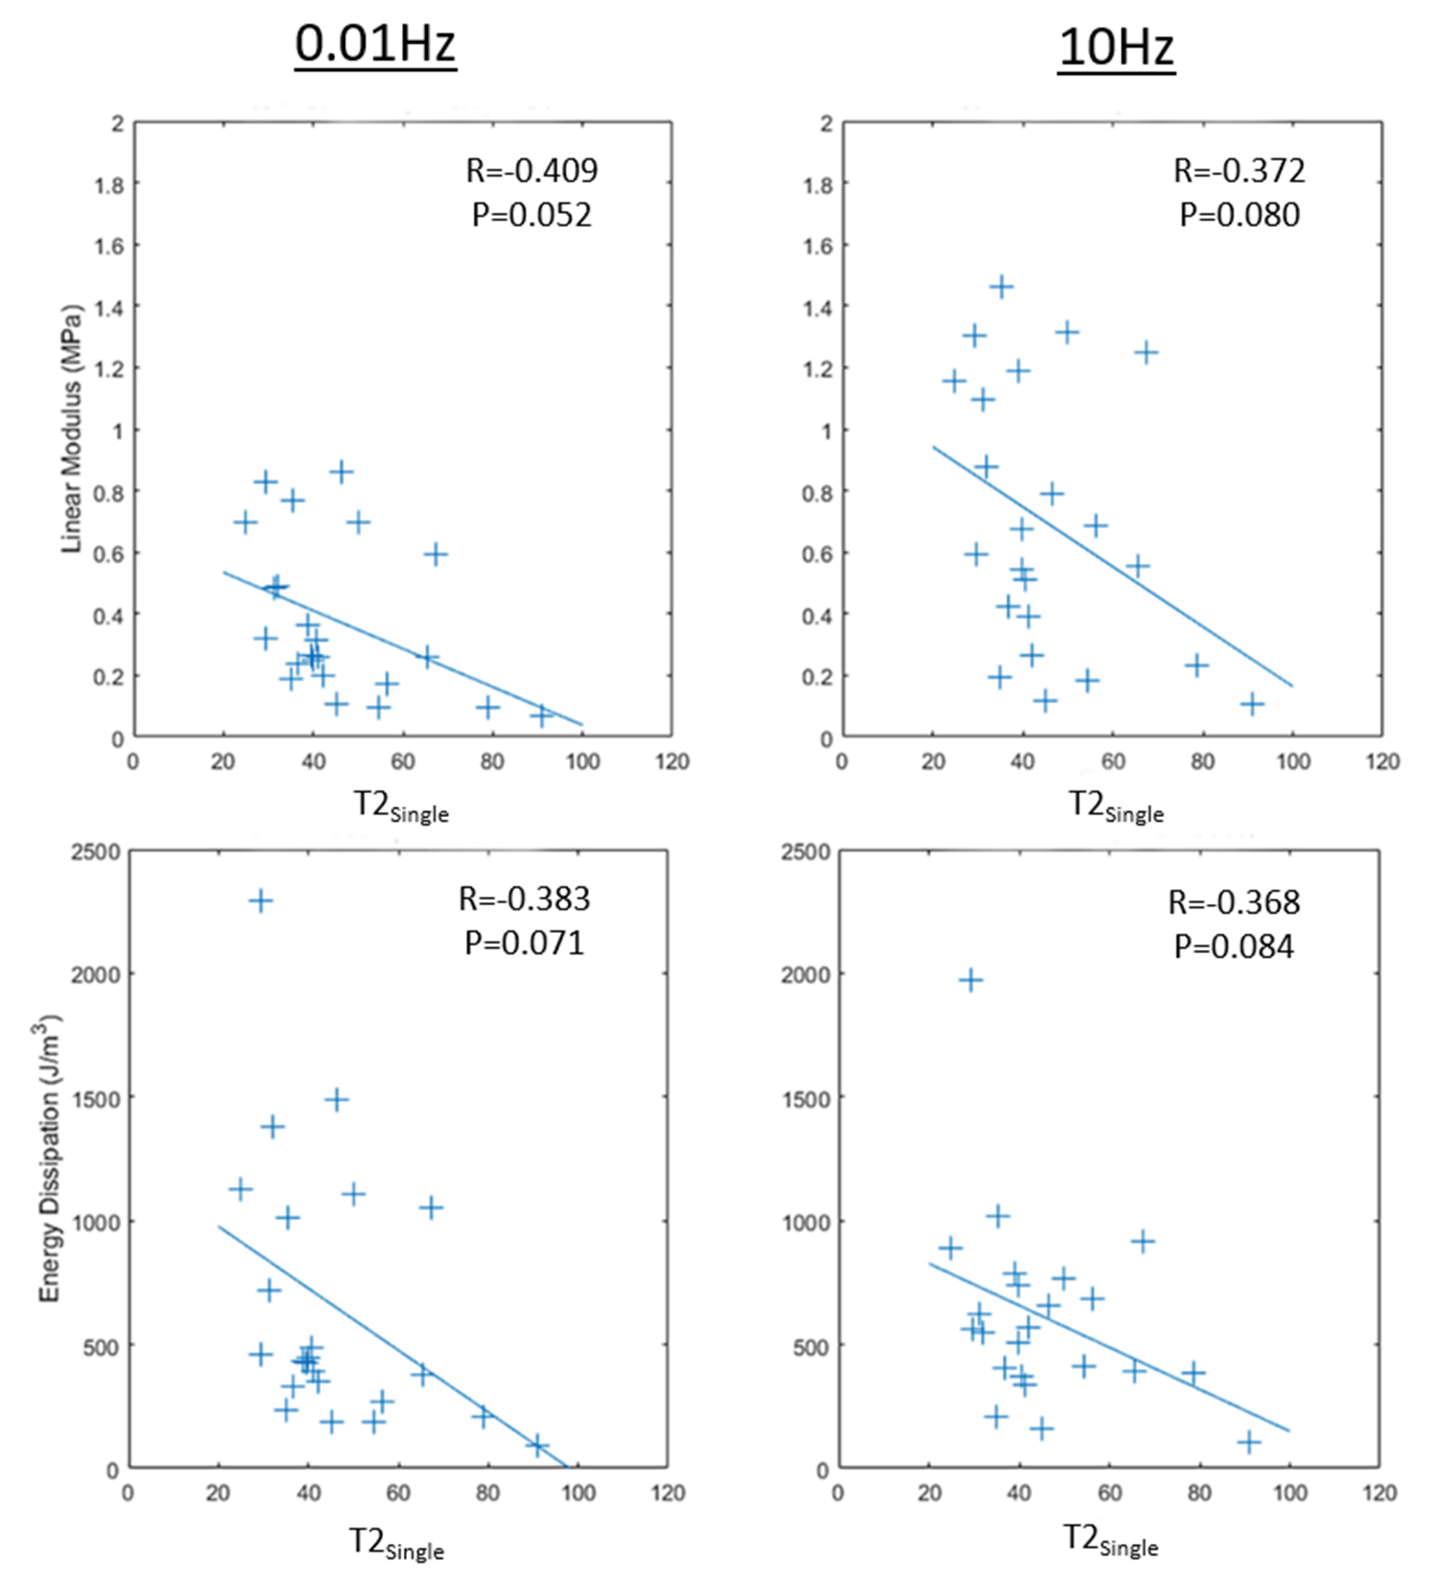
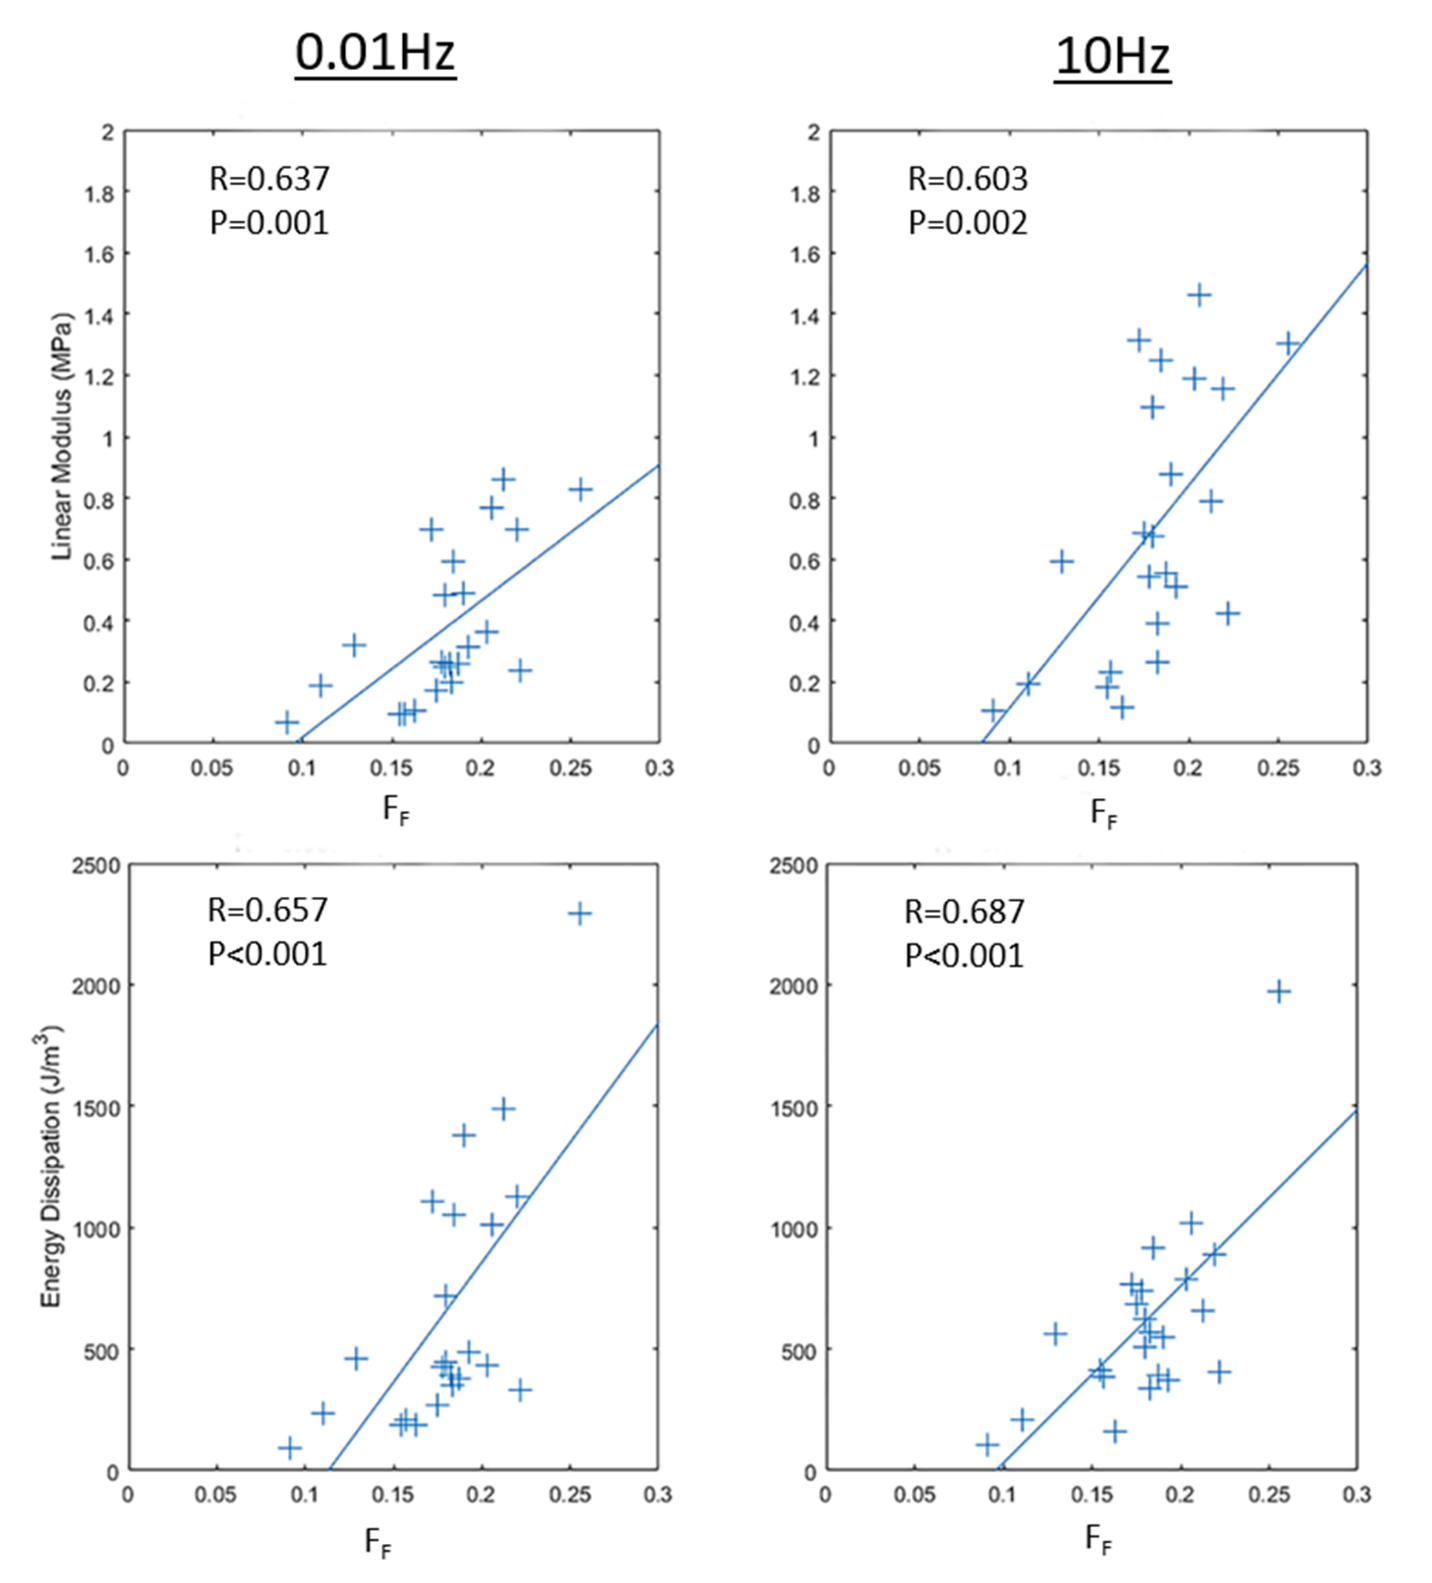
mcDESPOT acquired high-resolution cartilage T2Single and FF maps of the patellar specimen (Figure 2). There were low and marginally statistically significant (p=0.052-0.084) negative correlations between T2Single and linear modulus and energy dissipation of the cartilage samples at 0.01Hz and 10Hz (Figure 3). There were moderate and statistically significant (p<0.002) positive correlations between FF and linear modulus and energy dissipation of the cartilage samples at 0.01Hz and 10Hz (Figure 4).Discussion
The negative correlations between T2Single and linear modulus and energy dissipation in our study were of lower magnitude than some of the negative correlations reported in previous studies.4,5 However, the negative correlations between T2Single and the mechanical properties of human patellar cartilage in previous studies were found to be regional dependent, and thus our lower negative correlations were likely the result of analyzing cartilage samples from all locations on the patella. Our study found a much stronger moderate positive correlation between FF and linear modulus and energy dissipation at both loading frequencies. Slow loading of cartilage at 0.01Hz allows fluid to exude from the tissue with mechanical properties primarily influenced by the proteoglycan component of cartilage. Previous studies have shown that FF is strongly influenced by the proteoglycan content of cartilage.6,7 Thus, the higher FF in cartilage with higher linear modulus and energy dissipation at 0.01Hz is likely due to an increased proteoglycan content. However, there was a similar moderate positive correlation between FF and linear modulus and energy dissipation at the fast loading frequency of 10Hz, where mechanical properties are also influenced by the tensile strength provided by the collagen fiber network. However, the collagen component of cartilage cannot be directly assessed using mcDESPOT as its first echo is not short enough to capture signal from the extremely rapidly relaxing collagen bound water.6 Thus, our results indicate the importance of the non-collagenous extracellular matrix on the mechanical properties of cartilage measured at fast loading frequency.Conclusion
FF provided more information regarding the mechanical properties of human patellar cartilage at 3.0T than T2Single likely due to its ability to assess the individual water components of cartilage.Acknowledgements
Research support provided by GE Healthcare, University of Wisconsin Institute of Clinical and Translational Research, and NIAMS grant R01-AR068373.References
(1) Liu F, et al. Rapid multicomponent T2 analysis of the articular cartilage of the human knee joint at 3.0T. Journal of Magnetic Resonance Imaging. 39: 1191-1197, 2014.
(2) Liu F, et al. Articular cartilage of the human knee joint: In vivo multi-component T2 analysis at 3.0 T. Radiology. 277:477-488, 2015.
(3) Bouhara M, et al. Clinical high-resolution mapping of the proteoglycan-bound water fraction in articular cartilage of the human knee joint. Magnetic Resonance Imaging. 43:1-5, 2017.
(4) Kurkijarvi, J, et al. Delayed gadolinium-enhanced MRI of cartilage (DGEMRIC) and T2 characteristics of human knee articular cartilage: topographical variation and relationships to mechanical properties. Magnetic Resonance in Medicine. 52:41-46, 2004.
(5) Lamnentausta E, et al. T2 relaxation time and delayed gadolinium-enhanced MRI of cartilage (dGEMRIC) of human patellar cartilage at 1.5 T and 9.4 T: Relationships with tissue mechanical properties. Journal of Orthopedic Research. 24:366-374, 2006.
(6) Reiter D, et al. Multi-component T2 relaxation analysis in cartilage. Magnetic Resonance in Medicine. 61:803-809, 2009.
(7) Reiter D, et al. Mapping proteoglycan-bound water in cartilage: Improved specificity of matrix assessment using multi-exponential transverse relaxation analysis. Magnetic Resonance in Medicine. 65:377-384, 2011.
Figures