1327
Localization of the bright ultra-short echo time MRI signal at the osteochondral interface1Department of Applied Physics, University of Eastern Finland, Kuopio, Finland, 2Research Unit of Medical Imaging, Physics and Technology, University of Oulu, Oulu, Finland, 3Department of Diagnostic Radiology, Oulu University Hospital, Oulu, Finland
Synopsis
In this study, we investigated the bright signal feature that has been observed at the bone-cartilage interface using ultrashort echo time imaging sequences. We used micro-CT imaging of the same specimens to locate the origin of the signal in SWIFT-MRI images. The results indicated that the bright signal originates from the deep non-calcified cartilage region instead of the calcified cartilage, which has been previously hypothesized to be part of the signal location. The physiological origin of this signal as well as its role in the diagnosis of osteoarthritis remains to be evaluated.
Introduction
In this study, we investigated the bright signal that has been observed at the osteochondral interface, i.e. the interface between articular cartilage and subchondral bone, when imaging specimens with ultra-short echo time sequences (1,2). To investigate the origins of this signal feature, we obtained high-resolution ultra-short echo time SWIFT (3) scans of human osteochondral samples at 9.4T and compared the resulting 3-D MRI data with native high-resolution 3-D micro-CT data as well as with histologic images of the same samples.Methods
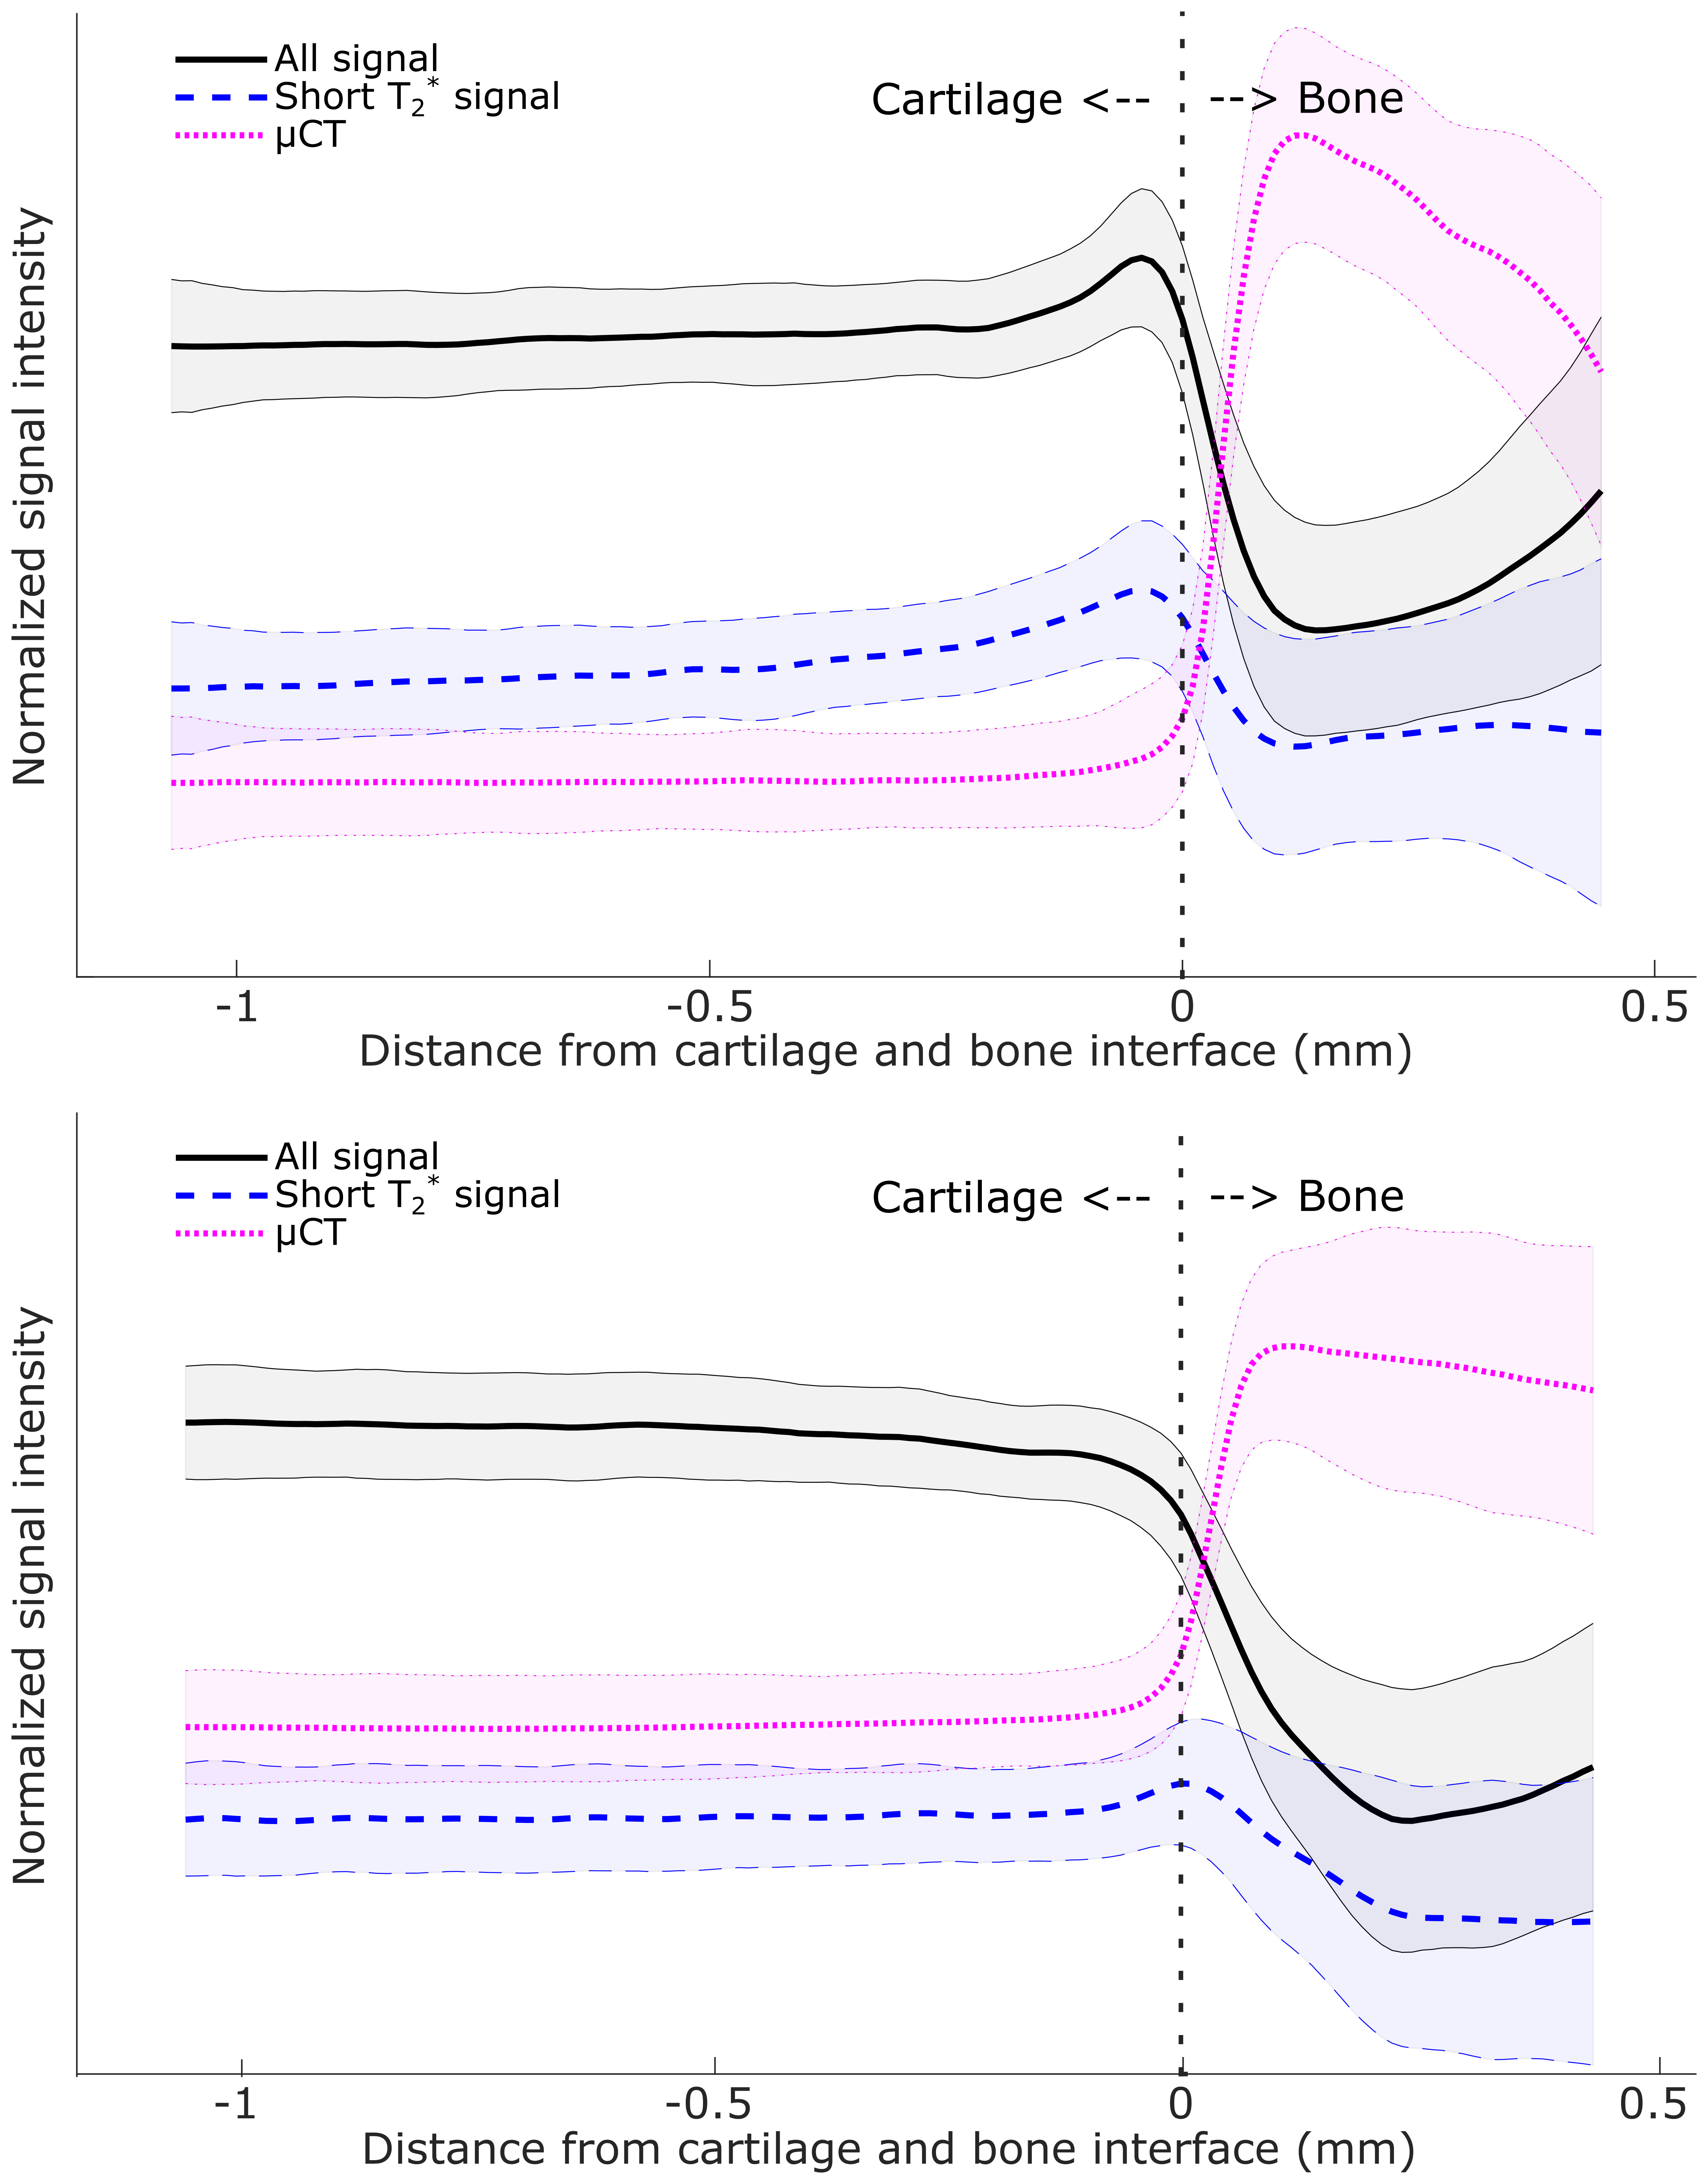
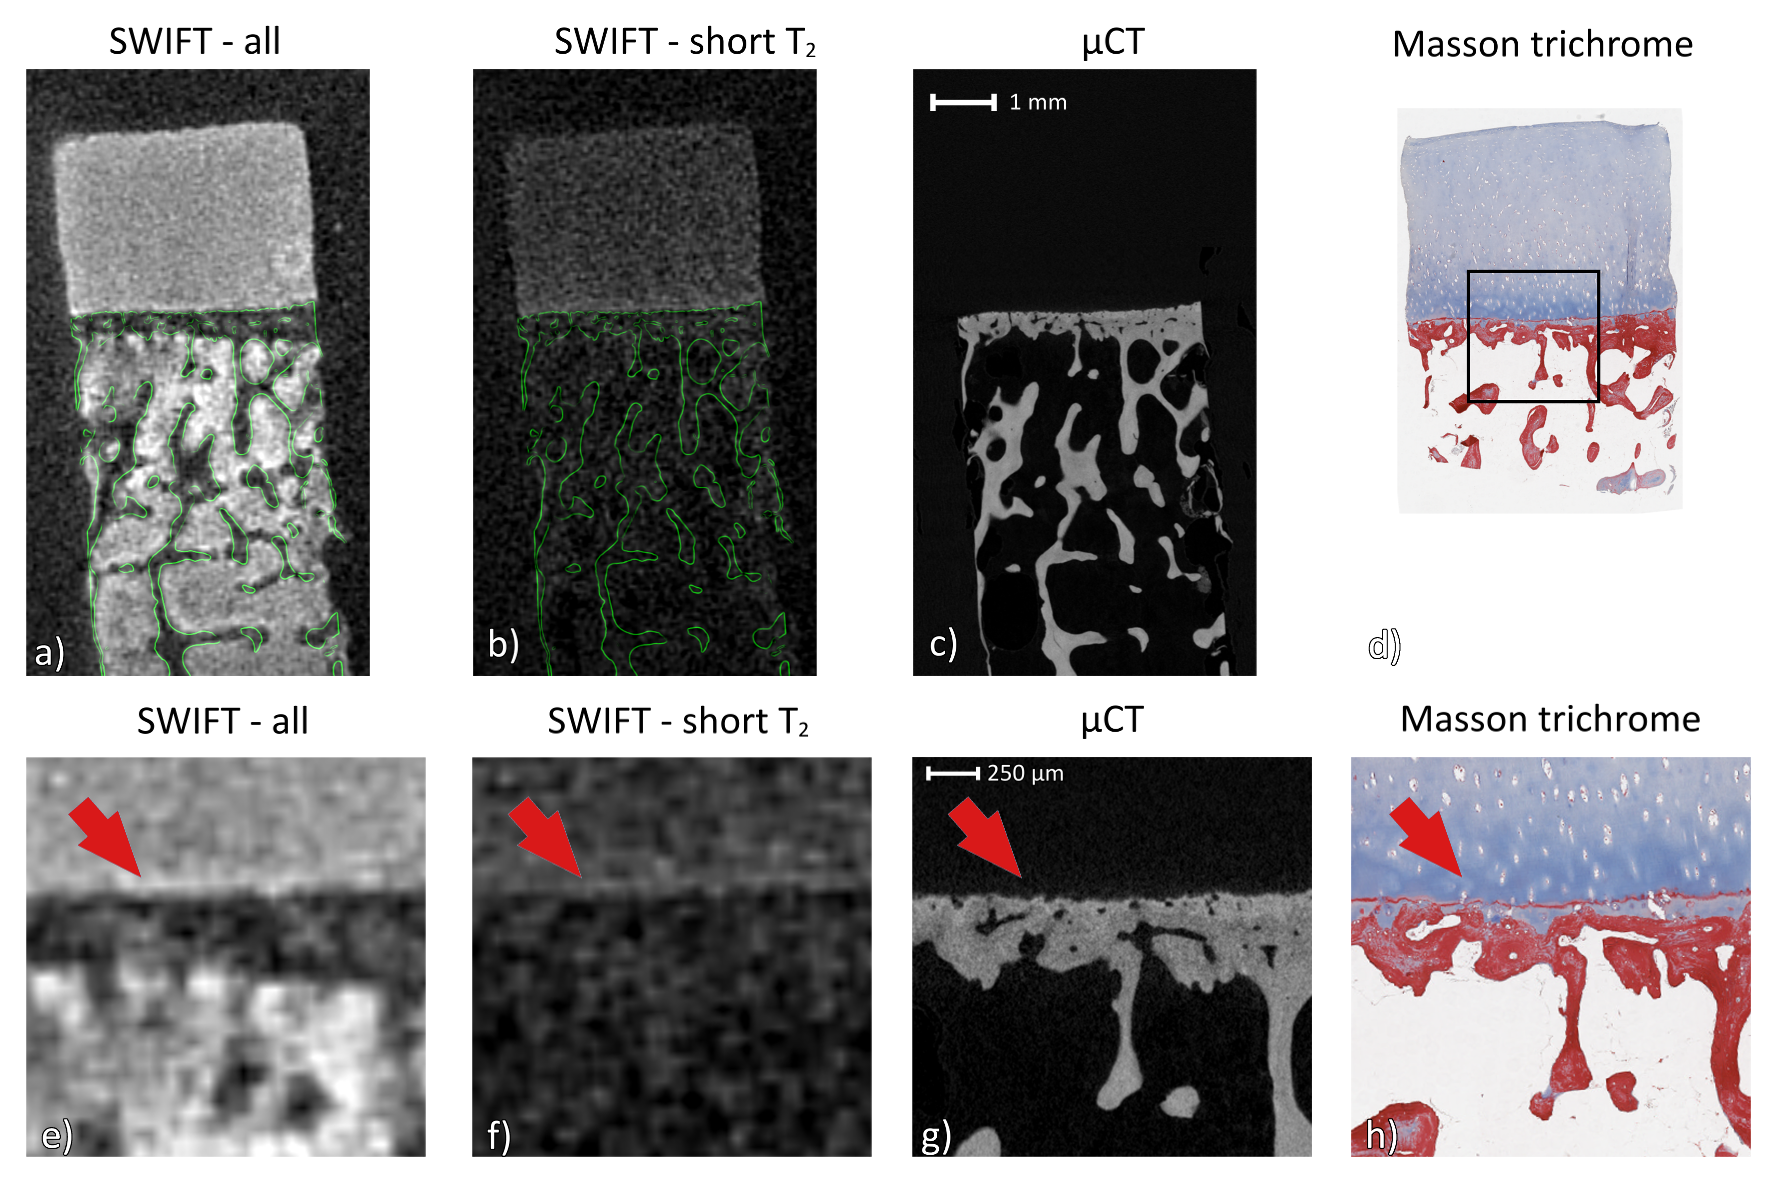
Cylindrical (dia. = 4 mm) osteochondral samples (n=8) were obtained from human cadaver tibia under existing ethical permissions. MRI was performed at 9.4 T Varian/Agilent scanner using a 10-mm-diameter quadrature RF volume transceiver (Rapid Biomedical GmbH, Rimpar Germany). The samples were immersed in 1HMRI-signal-free perfluoropolyether inside a plastic test tube. Samples were oriented in such a way that the surface of the cartilage was approximately perpendicular to the main magnetic field of the scanner. SWIFT data were acquired using a bandwidth of 62.5 kHz and a field of view of 3 cm and image dimensions of 384x384x384 voxels. Number spokes per image was 262144 and the images were reconstructed using re-gridding on a Cartesian grid. SWIFT images were obtained by separately applying fat saturation, water saturations and no saturation. This allowed reconstructing images with both water and fat signal without radial blurring and images of short T2*-spins. After the MRI scans, high-resolution micro-CT images were acquired using Skyscan 1272 device (Bruker microCT, Kontich Belgium) by setting x-ray tube to 50kV and 200 µA and after filtering with 0.5mm aluminium filter 1200 projections with 2200ms exposure time and three times frame averaging were collected. Projections were reconstructed to images with 2.75 µm pixel size with NRecon-software (v.1.6.10.4, Bruker microCT) with beam hardening and ring corrections. The 3-D MRI images were co-registered with the 3-D micro-CT images using Elastix –software (4) to allow precise localization of the bright signal feature in the SWIFT images with respect to the bony features of the specimens. Depth-wise signal intensities through the cartilage and subchondral bone of the co-registered MRI and CT images were calculated in Matlab for further analyses. MRI and micro-CT images were also compared with Masson’s trichrome stained histological slices to further assess the different structural features of the osteochondral samples and to evaluate the sources of the bright signal.Results
Out of the eight samples, six exhibited bright signal at the osteochondral interface and two did not (Fig. 1). All of the 3-D geometries measured by MRI or micro-CT were successfully co-registered as indicated by the visually perfect match of the trabecular features between the 3-D MRI and micro-CT datasets (Fig 2). In all of the six samples that exhibited the bright signal, it was located in the deep articular cartilage, immediately above the layer of calcified cartilage, but not in the calcified cartilage (Fig 2). The layer of calcified cartilage was clearly identified in the histological slices and was faintly detectable also in the micro-CT images. In general, the layer of calcified cartilage was seen as tightly interconnected with the subchondral plate in the micro-CT images (Fig 2).Disscussion and Conclusion
We observed that the bright signal at the osteochondral interface is not located in the calcified cartilage, contrary to what has been previously suggested (1,2). Instead, the bright signal seems to originate from the deep radial layer of articular cartilage. However, the exact source of the bright signal feature remains yet unsolved. Possible causes include signal pileup resulting from the susceptibility difference between the non-calcified cartilage and the subchondral plate (calcified cartilage and subchondral bone), or very short T1 relaxation time within the deep layers of non-calcified cartilage. Regardless, it appeared that even in samples that are spatially close to each other, there are changes in the appearance of this signal and the potential role of the signal in osteoarthritis remains to be evaluated. It is also worth noting that in the samples that did not exhibit the bright signal in deep layer, there was still a detectable increase in short-T2* signal, located exactly at the interface.Acknowledgements
Support from the Academy of Finland (grants #285909, #293970 and #319440) and European Research Council (grant # 336267) are gratefully acknowledged.References
1. Bae WC, Dwek JR, Znamirowski R, Statum SM, Hermida JC, D’Lima DD, Sah RL, Du J, Chung CB. Ultrashort Echo Time MR Imaging of Osteochondral Junction of the Knee at 3 T: Identification of Anatomic Structures Contributing to Signal Intensity. Radiology 2010;254(3):837-845.
2. Bae WC, Biswas R, Chen K, Chang EY, Chung CB. UTE MRI of the Osteochondral Junction. Curr Radiol Rep 2014;2(2):35. doi: 10.1007/s40134-013-0035-7.
3. Idiyatullin D, Corum C, Park JY, Garwood M. Fast and quiet MRI using a swept radiofrequency. J Magn Reson 2006;181(2):342-349. doi: 10.1016/j.jmr.2006.05.014.
4. Klein S, Staring M, Murphy K, Viergever MA, Pluim JP. Elastix: a toolbox for intensity-based medical image registration. IEEE Transactions on Medical Imaging 2010;29(1):196-205.
Figures