1325
Toward an orientation-independent MR relaxation metric from $$$R_{1ρ}$$$ dispersion in articular cartilage1Department of Radiology, University of Michigan, Ann Arbor, MI, United States
Synopsis
Residual dipolar interaction is the dominant mechanism for $$$R_2$$$ relaxation in cartilage, leading to the well-known "magic angle effect" observed in clinical MR imaging that makes reliable diagnostics challenging. Here, we show that the orientation-dependent factor in $$$R_2$$$ could be eliminated by a correlation time $$$τ_b$$$ derived from $$$R_{1ρ}$$$ dispersion in terms of order parameter. This predication was tested on orientated bovine patellar cartilage specimens at 9.4T and on one live human knee at 3T. The preliminary data showed that the derived anisotropic $$$R_2$$$ and $$$τ_b$$$ had respectively significantly high and moderate positive correlations in good agreement with the predication.
INTRODUCTION
Residual dipolar interaction is the dominant mechanism for water proton $$$R_2$$$ relaxation in cartilage1-2, leading to the well-known “magic angle effect” observed in clinical MR imaging that has complicated diagnostics3. In this work, we show that the orientation-dependent factor in $$$R_2$$$ could be decoupled by a correlation time $$$τ_b$$$ derived from $$$R_{1ρ}$$$ dispersion on both orientated bovine patellar cartilage specimens at 9.4T and human knee articular cartilages from one volunteer at 3T.METHODS
$$$R_2$$$ could be written as a weighted average of an isotropic $$$R_2^i$$$ and an anisotropic $$$R_2^a(θ)$$$ term4, with the latter dispersed in $$$R_{1ρ}$$$ measurements depending on an applied spin-lock RF strength $$$(ω_1/2π)$$$, i.e. $$$R_1ρ=R_2^i+R_2^a/(1+4ω_1^2 τ_b^2 )$$$ , with $$$τ_b$$$ an effective correlation time5,6 and $$$R_2^a = 1.5KS^2τ_b$$$, with $$$K$$$ a constant of 1.056*1010 (rad2/s2) and $$$S$$$ an order parameter - a measure of water molecular reorientation anisotropy7. If collagen fibers in a particular sample are orientated differently relative to the external magnetic field $$$B_0$$$, $$$R_2^a(θ)=R_2^a((1-3cos^2θ)⁄2)^2,$$$ $$$τ_b$$$ should follow the same orientation dependence as the intrinsic water reorientation should not be changed, i.e. $$$R_2^a(θ)/τ_b(θ)=1.5KS^2$$$. The order parameter is thus calculated as $$$S=\sqrt{(R_2^a(θ)/τ_b(θ))(1/1.5K)}$$$. Publicly available8 $$$R_{1ρ}$$$ depth-profiles from four bovine patellar cartilage-bone samples were analyzed as a function of $$$ω_1/2π$$$ = 0, 250, 500, 1000, 2000 (Hz) at 9.4T. The average $$$R_2^a(θ)$$$ and effective $$$τ_b(θ)$$$ in the deep zone (40-80% depth) were derived for different sample orientations. One human knee was studied with $$$R_{1ρ}$$$ imaging in sagittal plane using a 16-ch T/R Knee coil on a Philips 3T MR scanner. T1ρ-weighed 3D images with different TSL (1, 10, 20, 30 and 40 ms) were acquired with a spin-lock (125, 250, 500, 750, 1000 Hz) prepared T1-enhanced 3D TFE pulse sequence. The acquired voxel size was 0.40*0.40*3.00 mm3 and the total scan duration was about 44 minutes. After human knee image co-registrations, $$$R_{1ρ}$$$ pixel maps with different $$$ω_1/2π$$$ were created by curve-fittings based on a 2-parameter exponential decay model. Localized segmentation was performed on the femoral, tibial and patellar cartilages, and ROI-based $$$R_2^a(θ)$$$ and $$$τ_b$$$ were fitted for the segmented deep zones. All image and data analysis was performed with an in-house software developed in IDL 8.5 (Exelis Visual Information Solutions, Boulder, CO).RESULTS and DISCUSSION
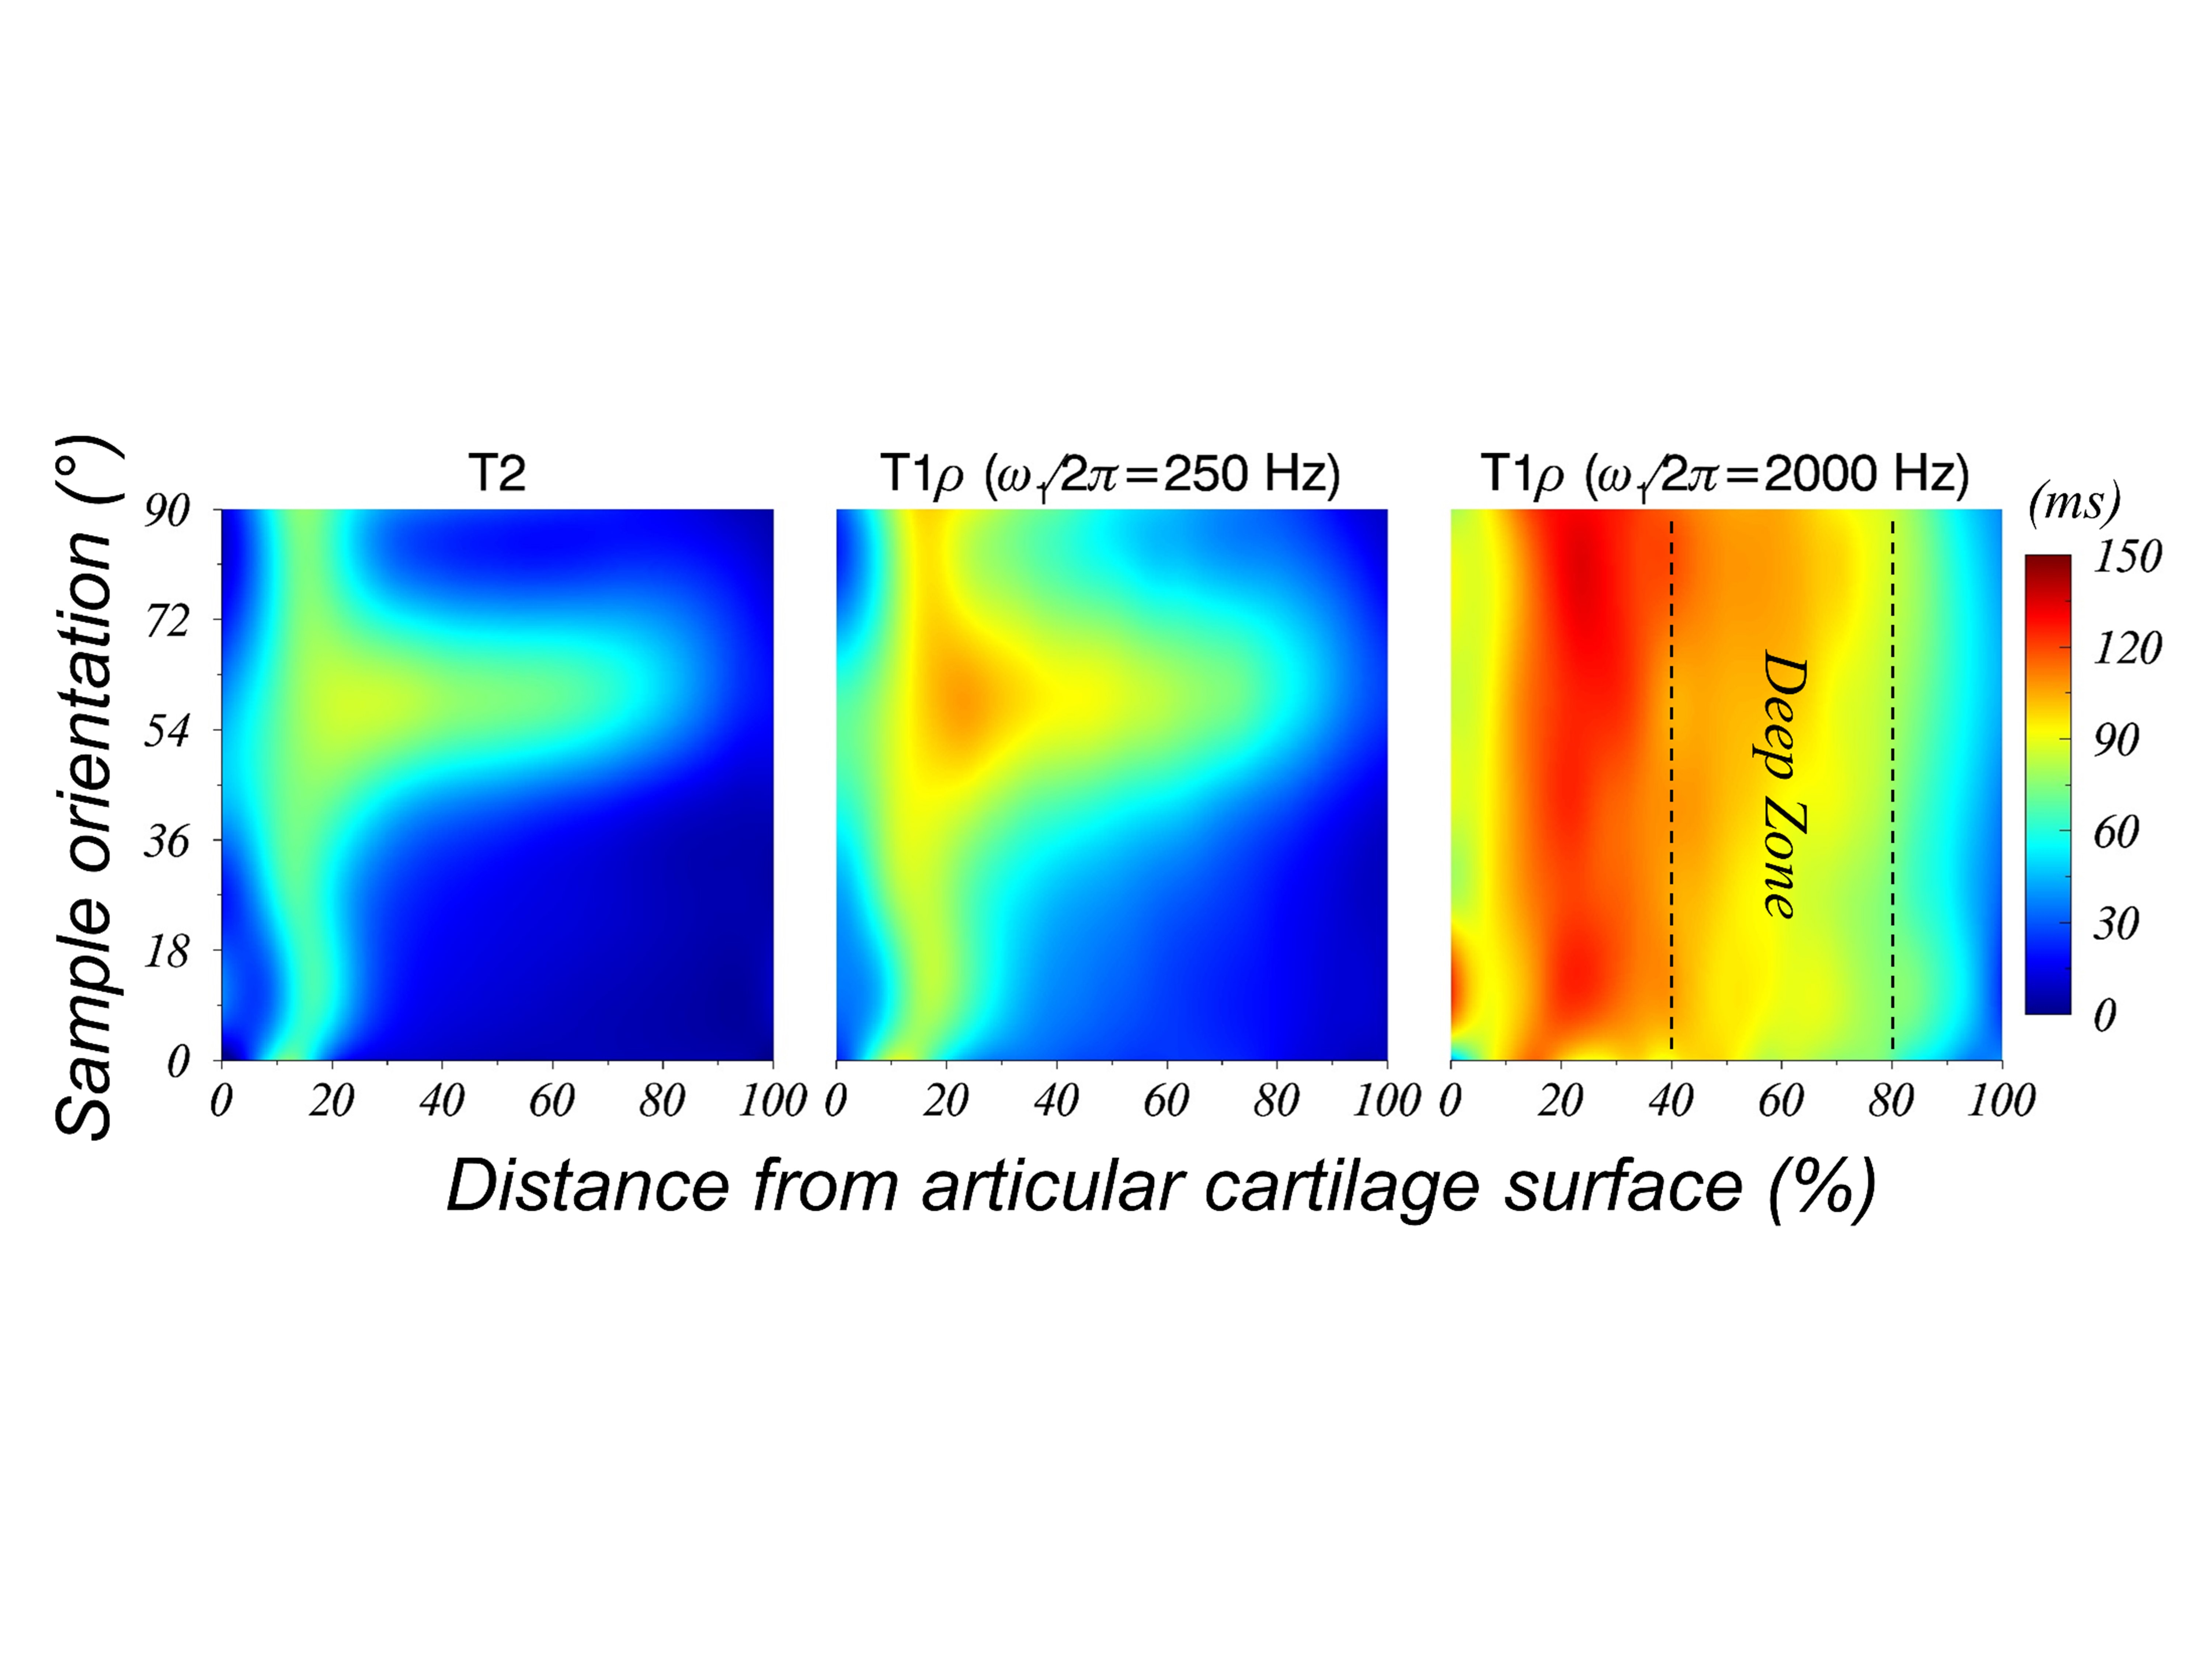
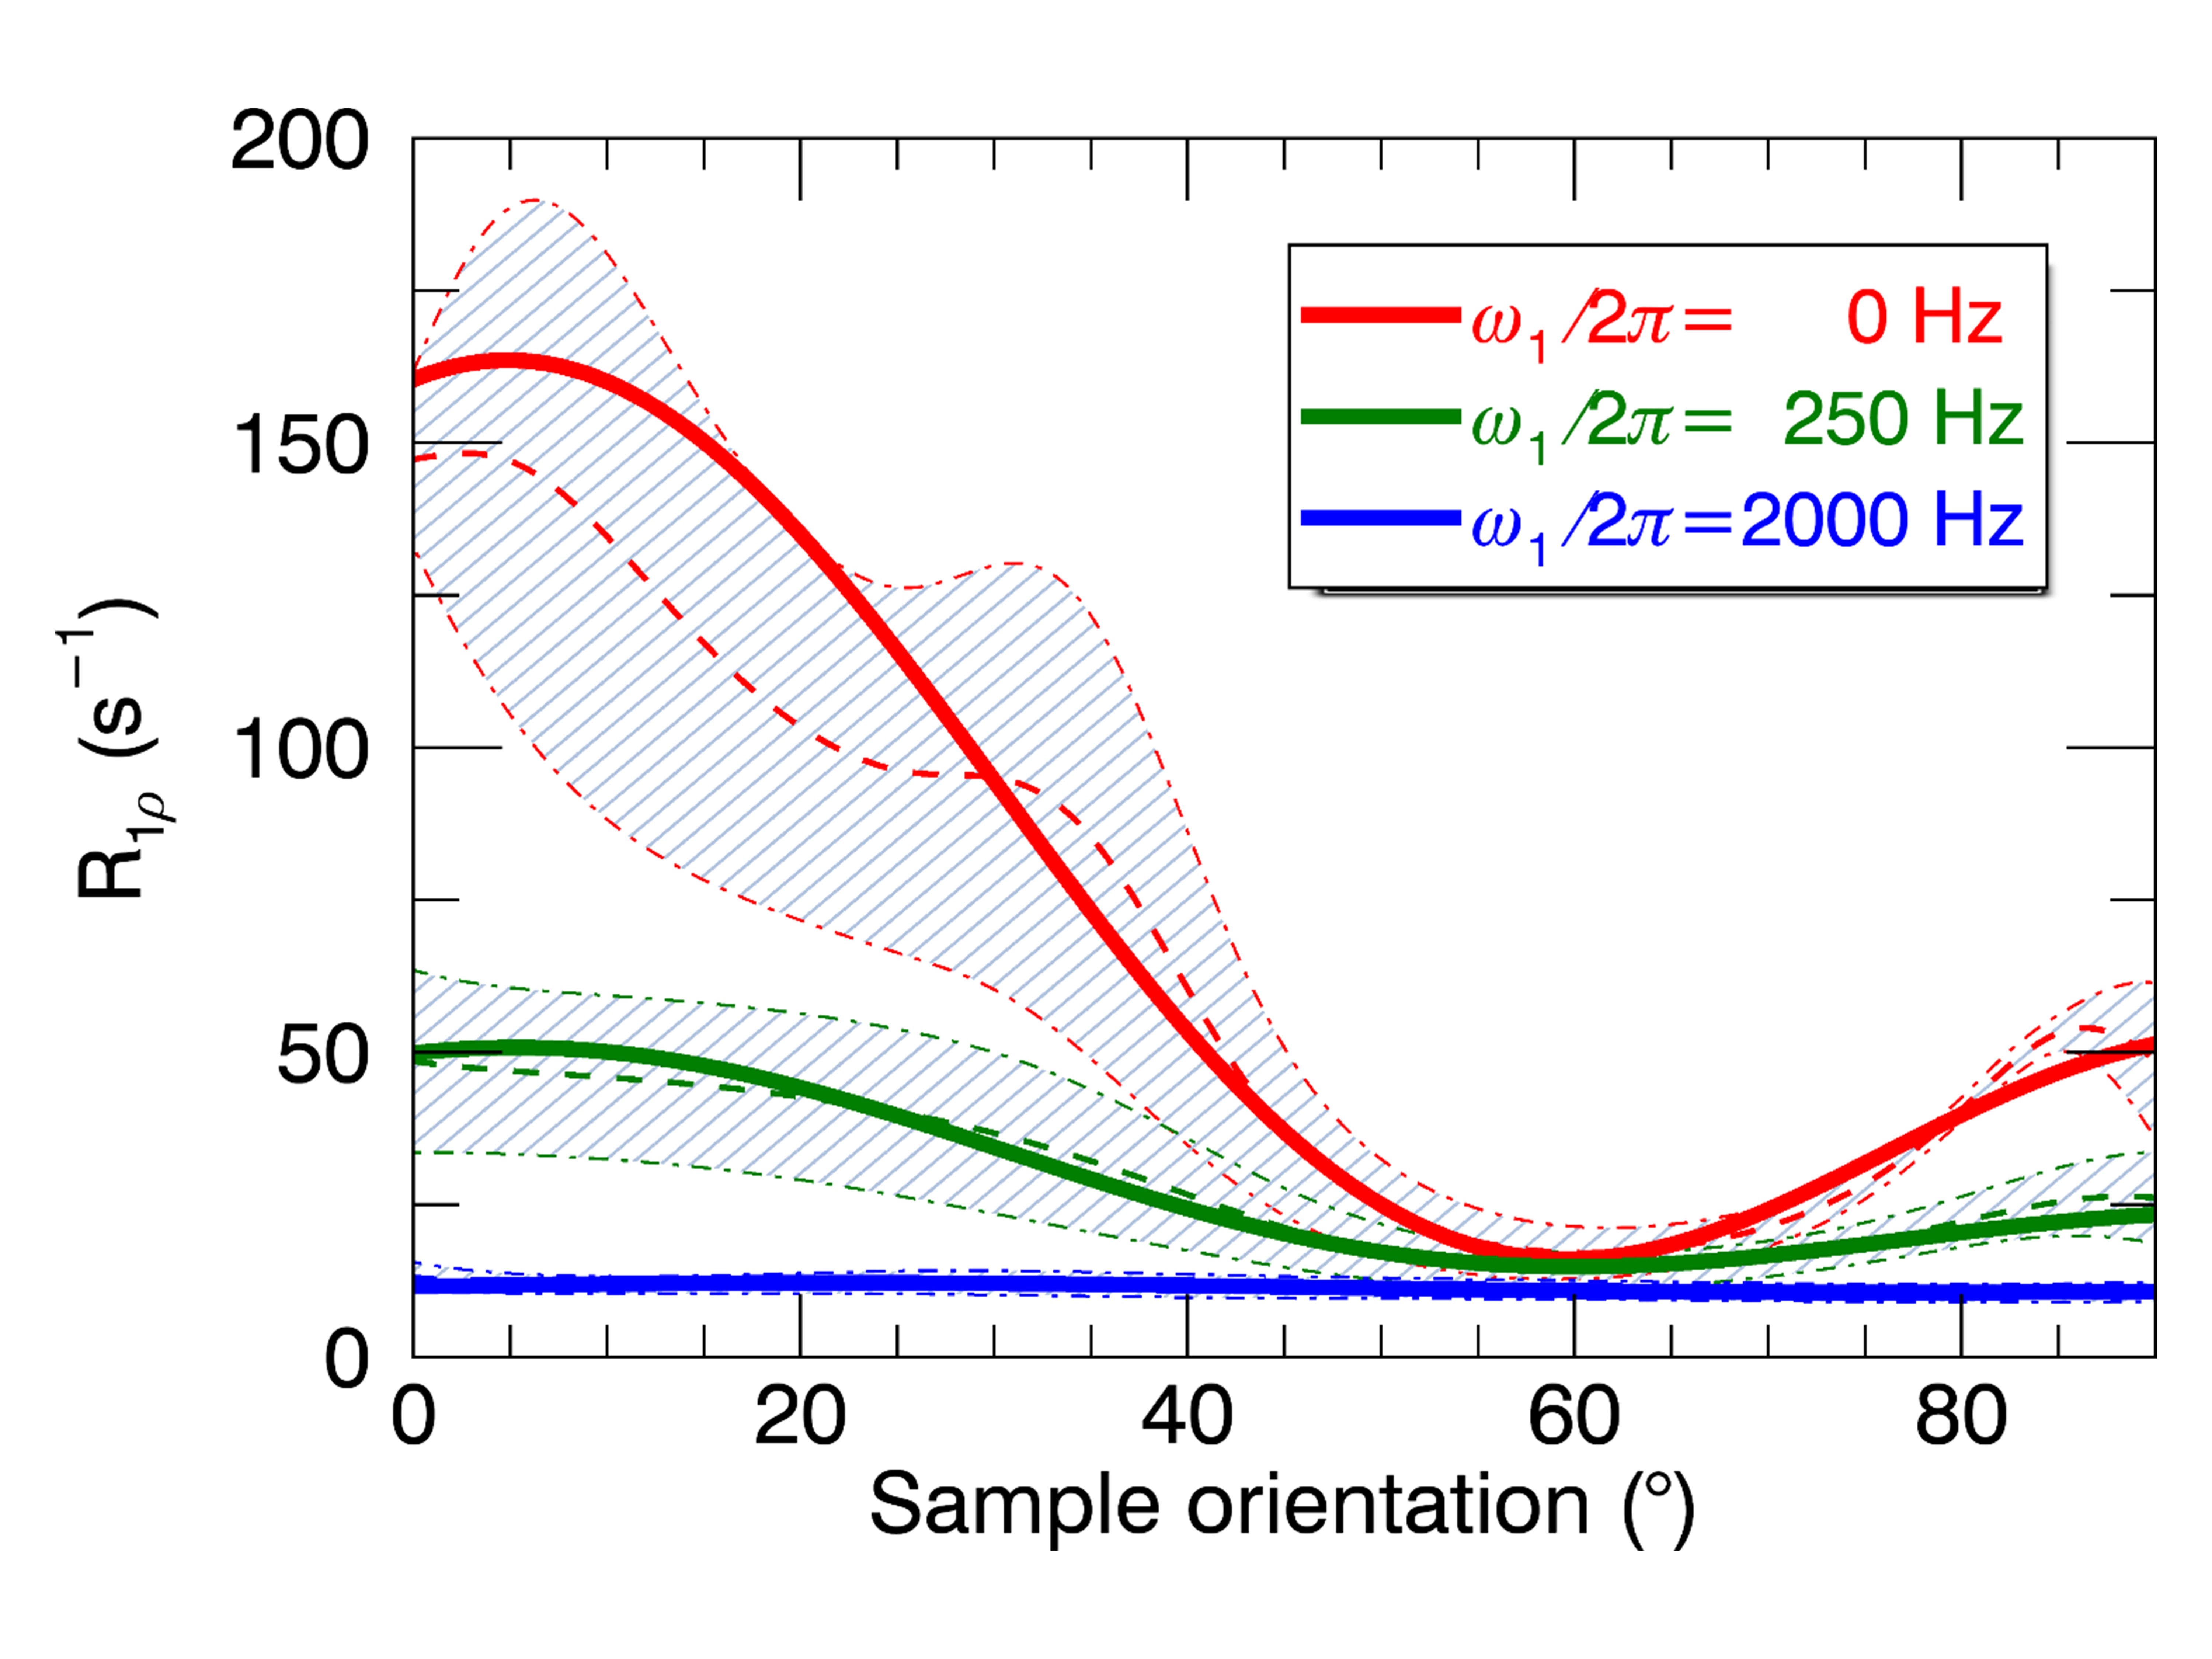
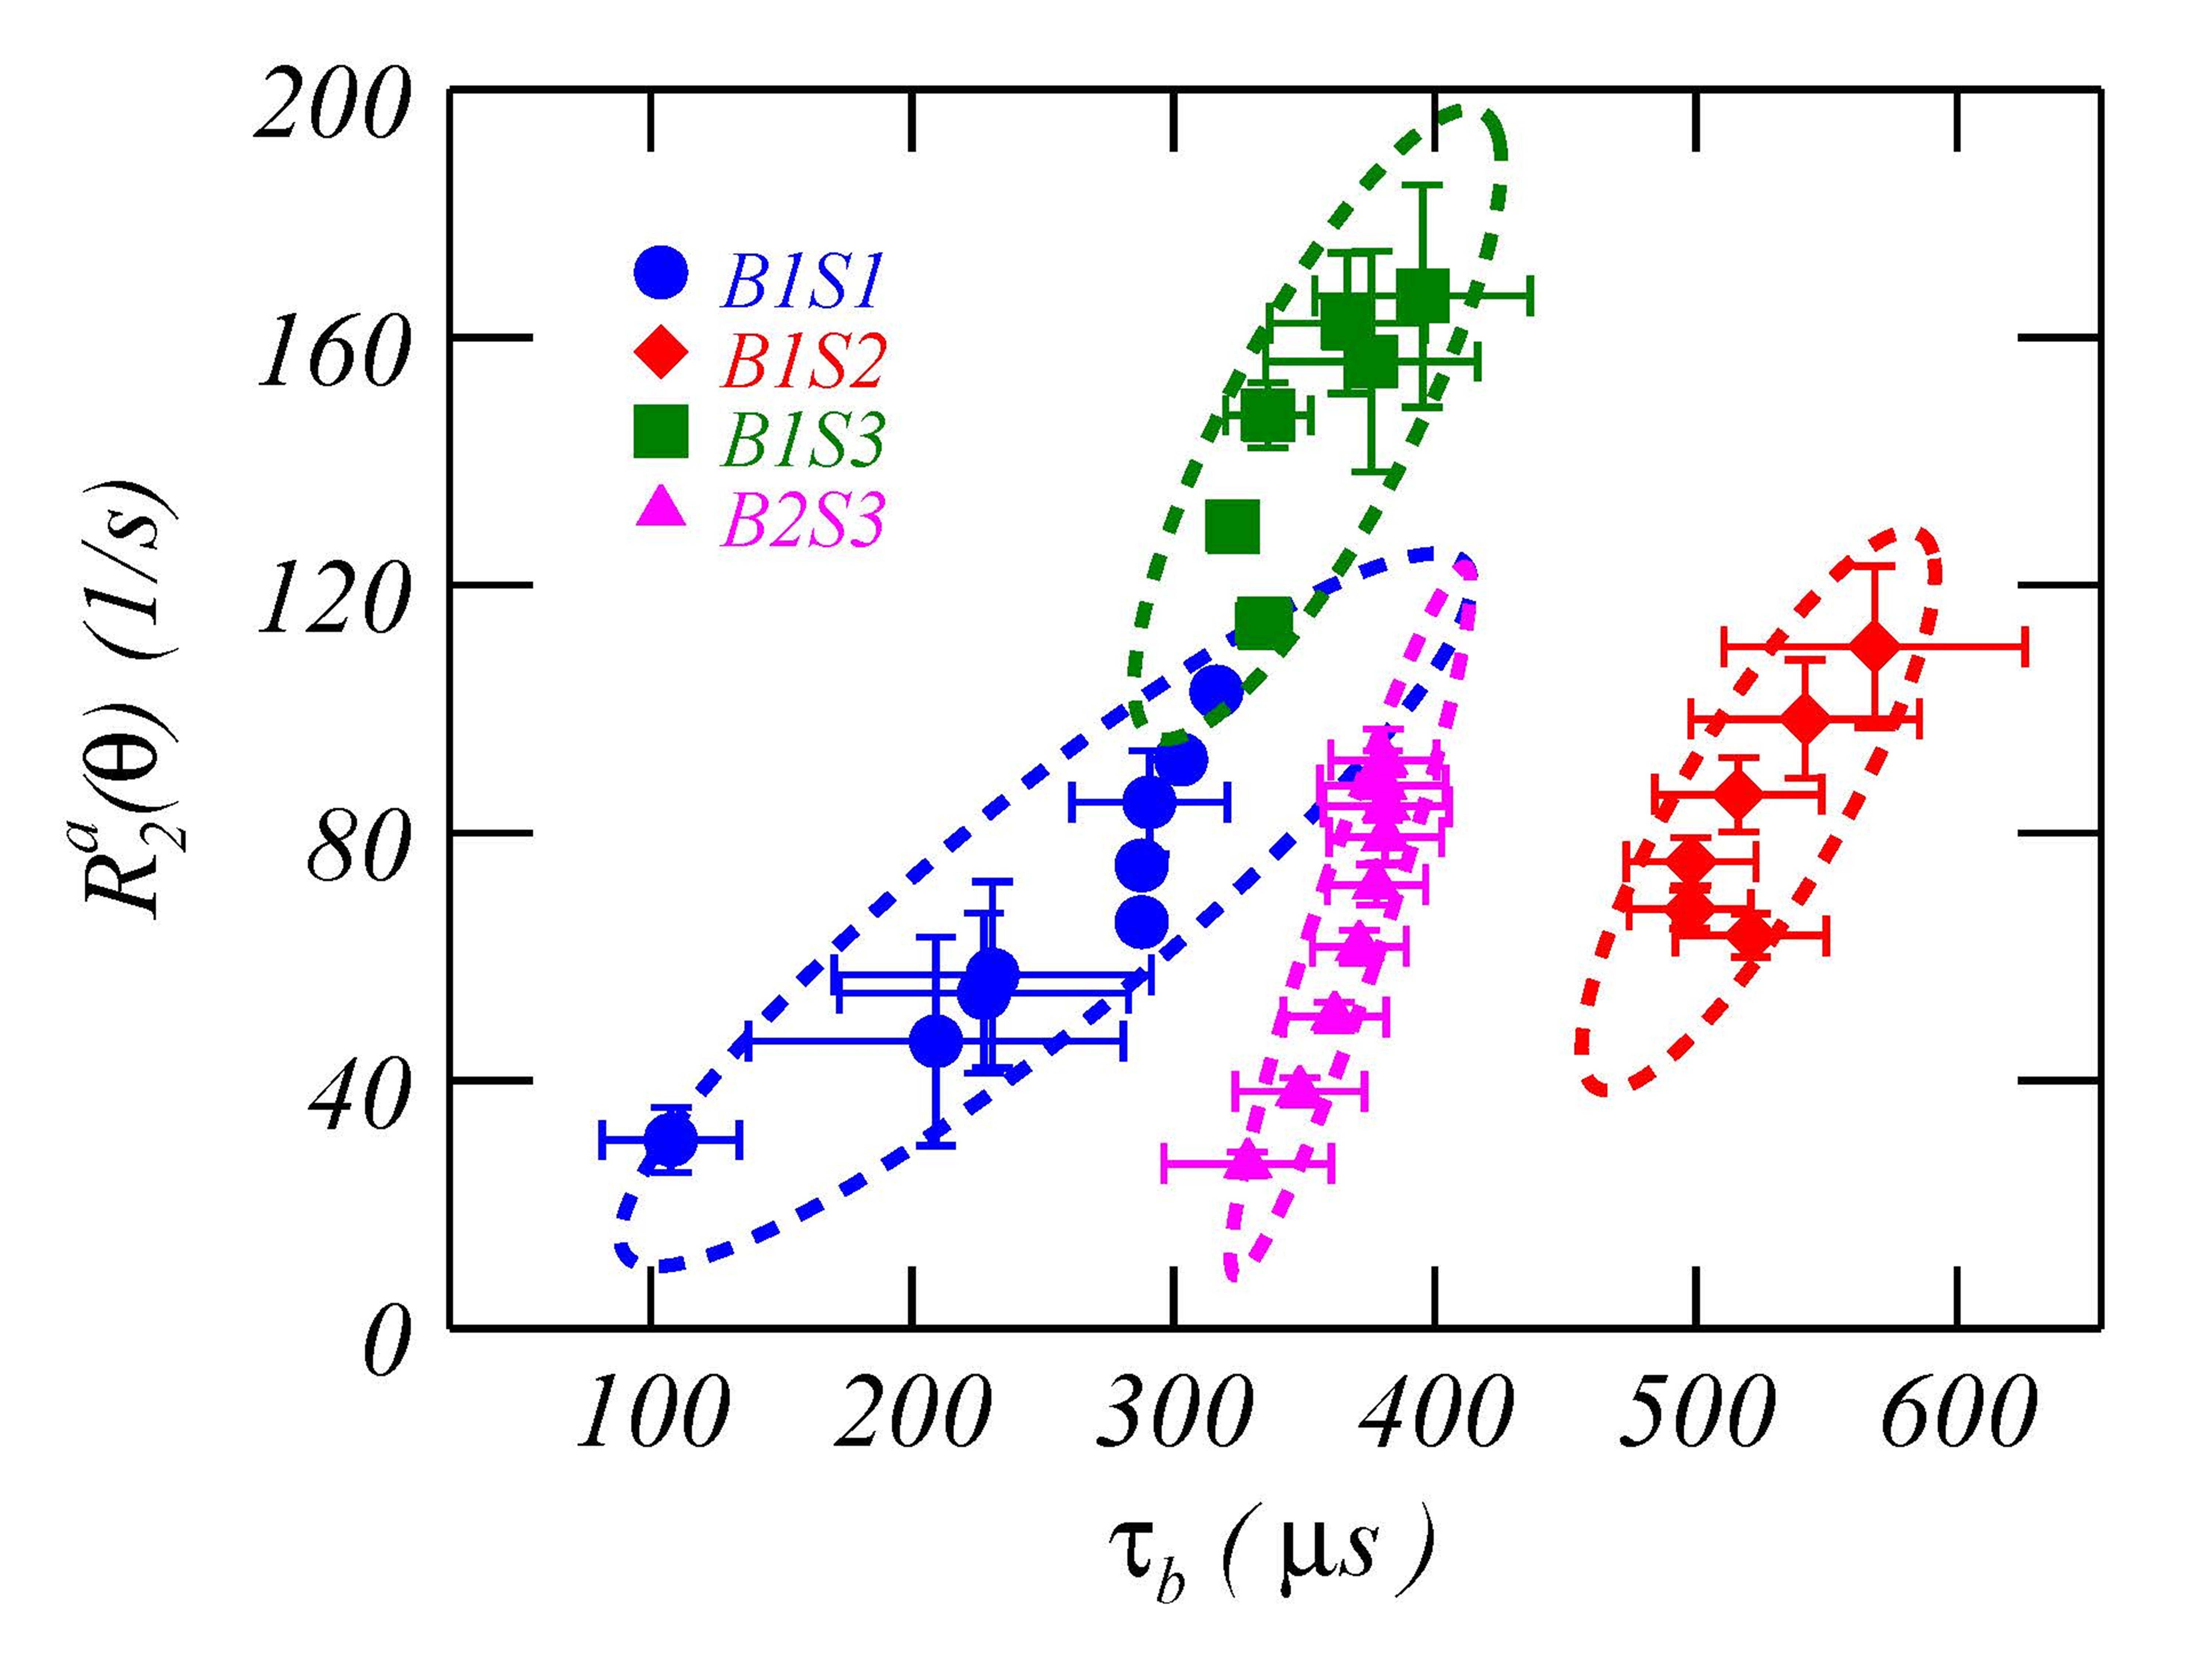
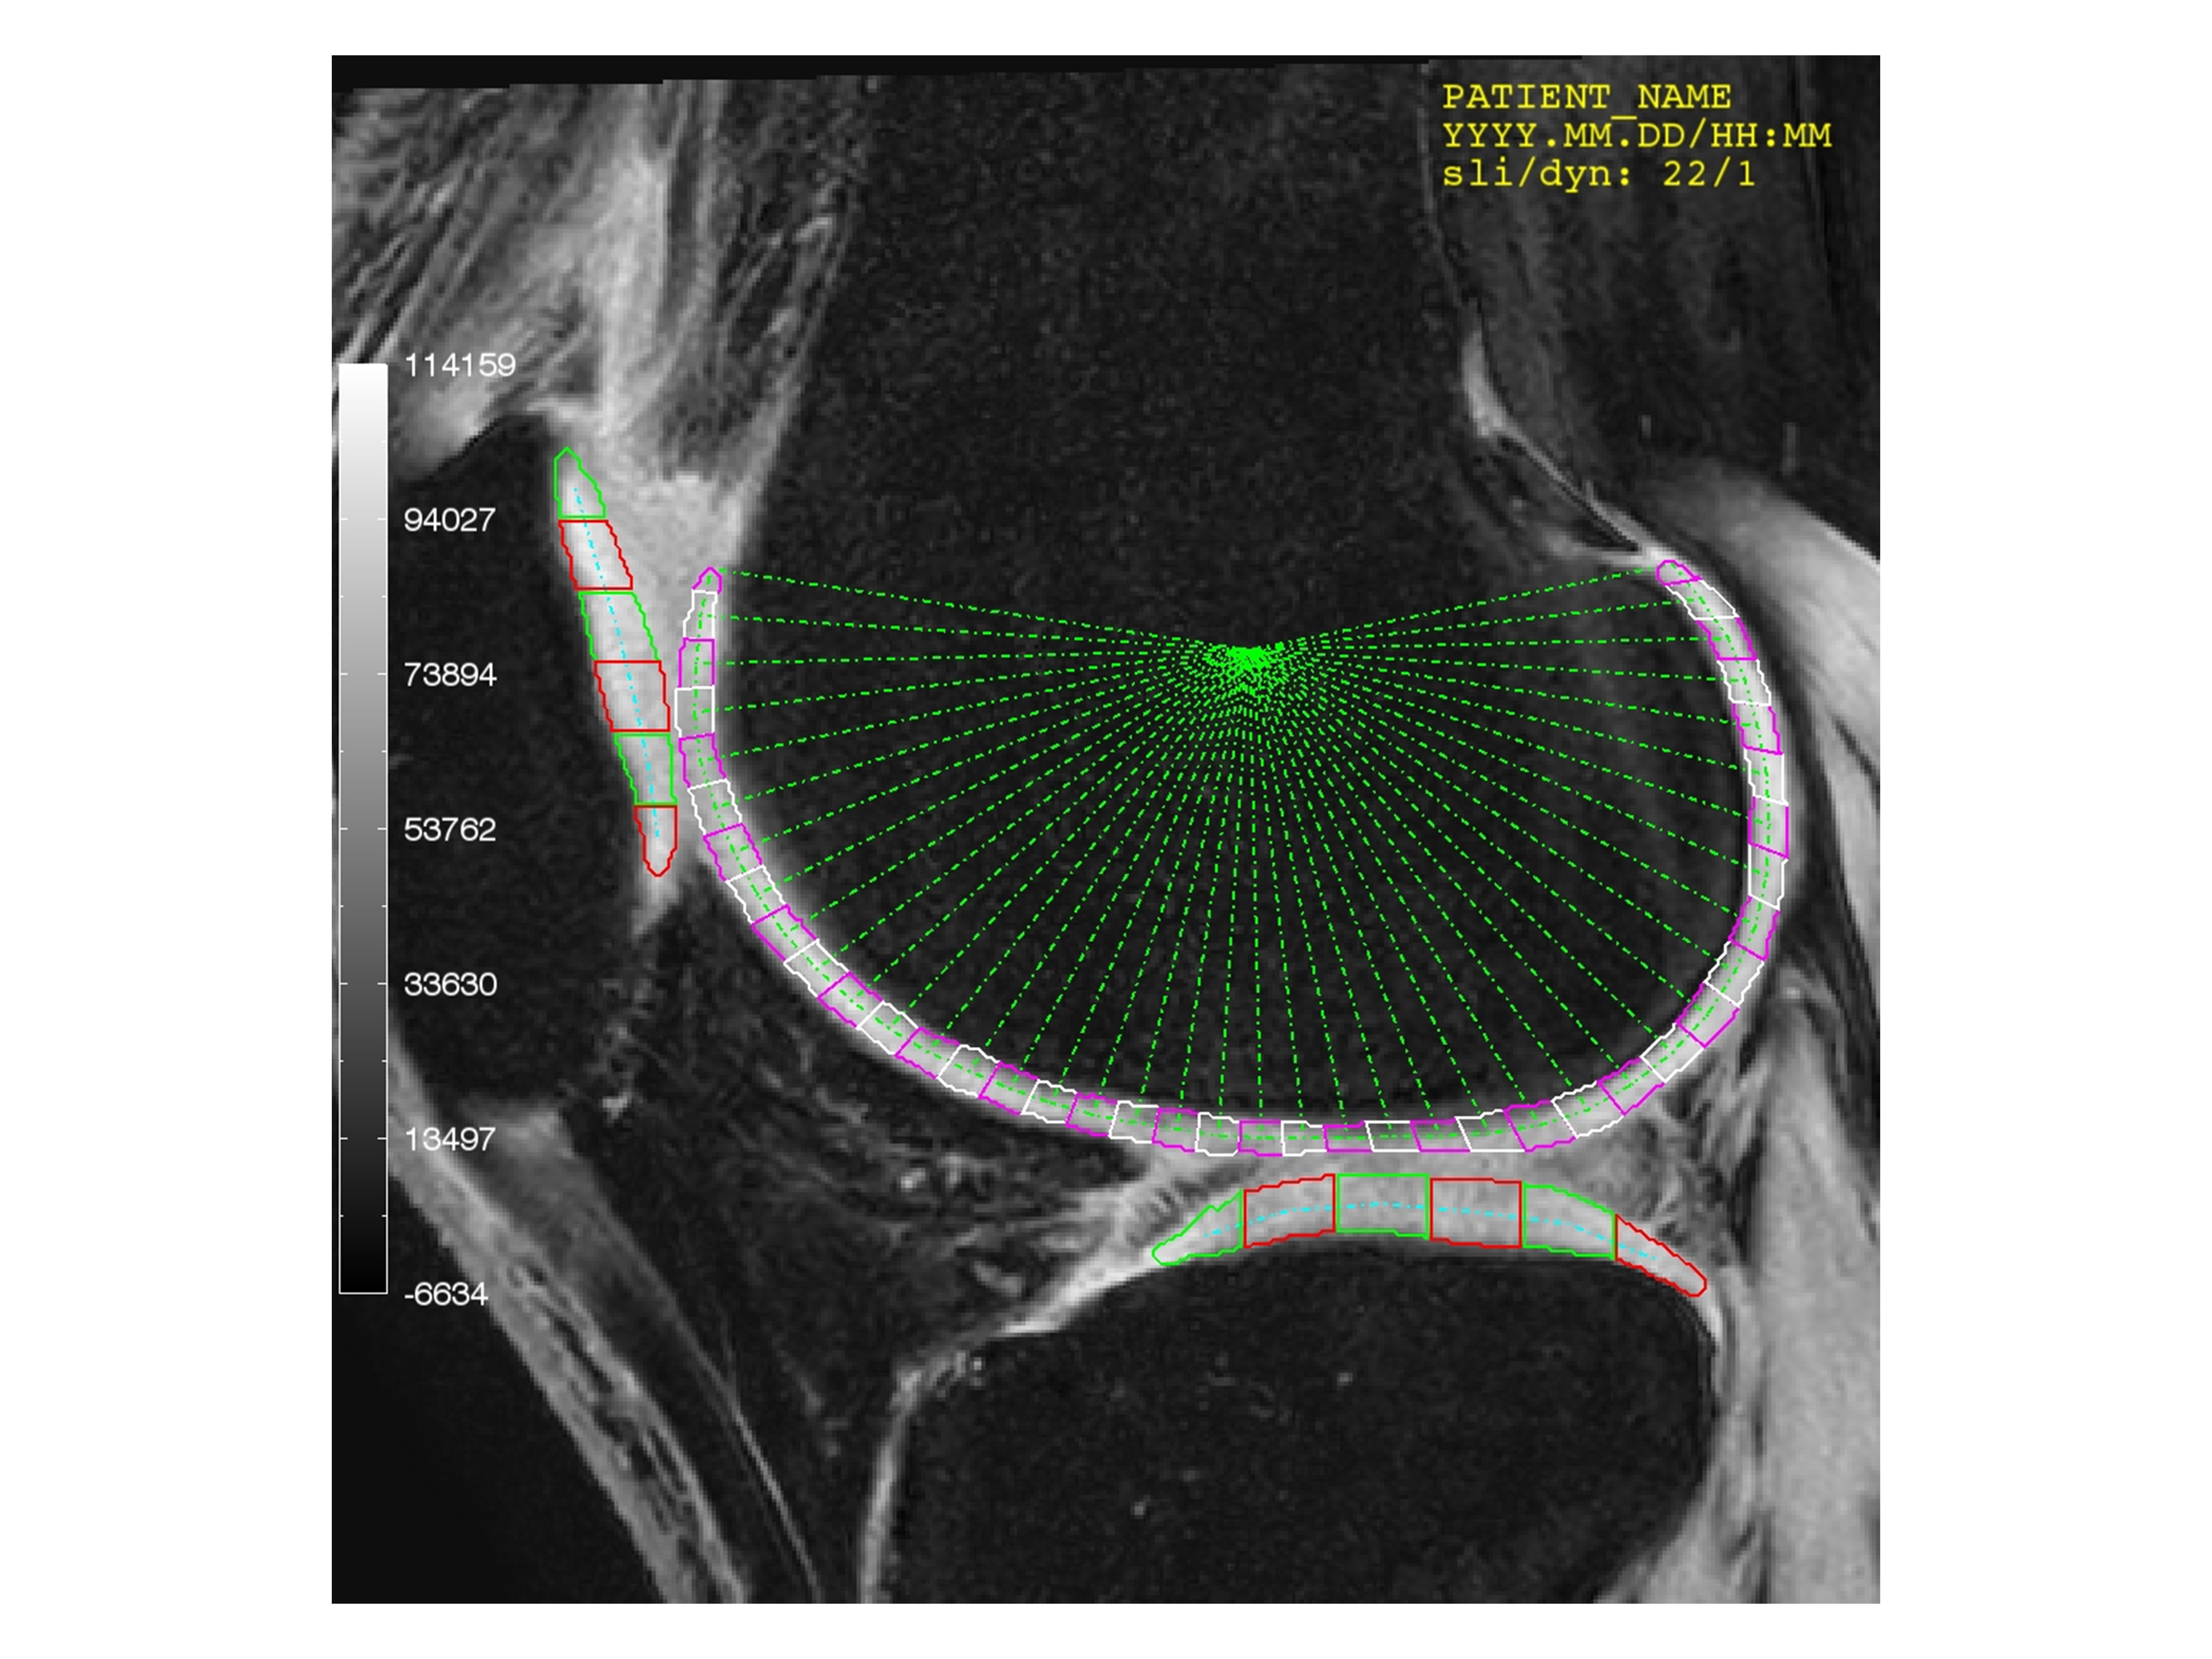
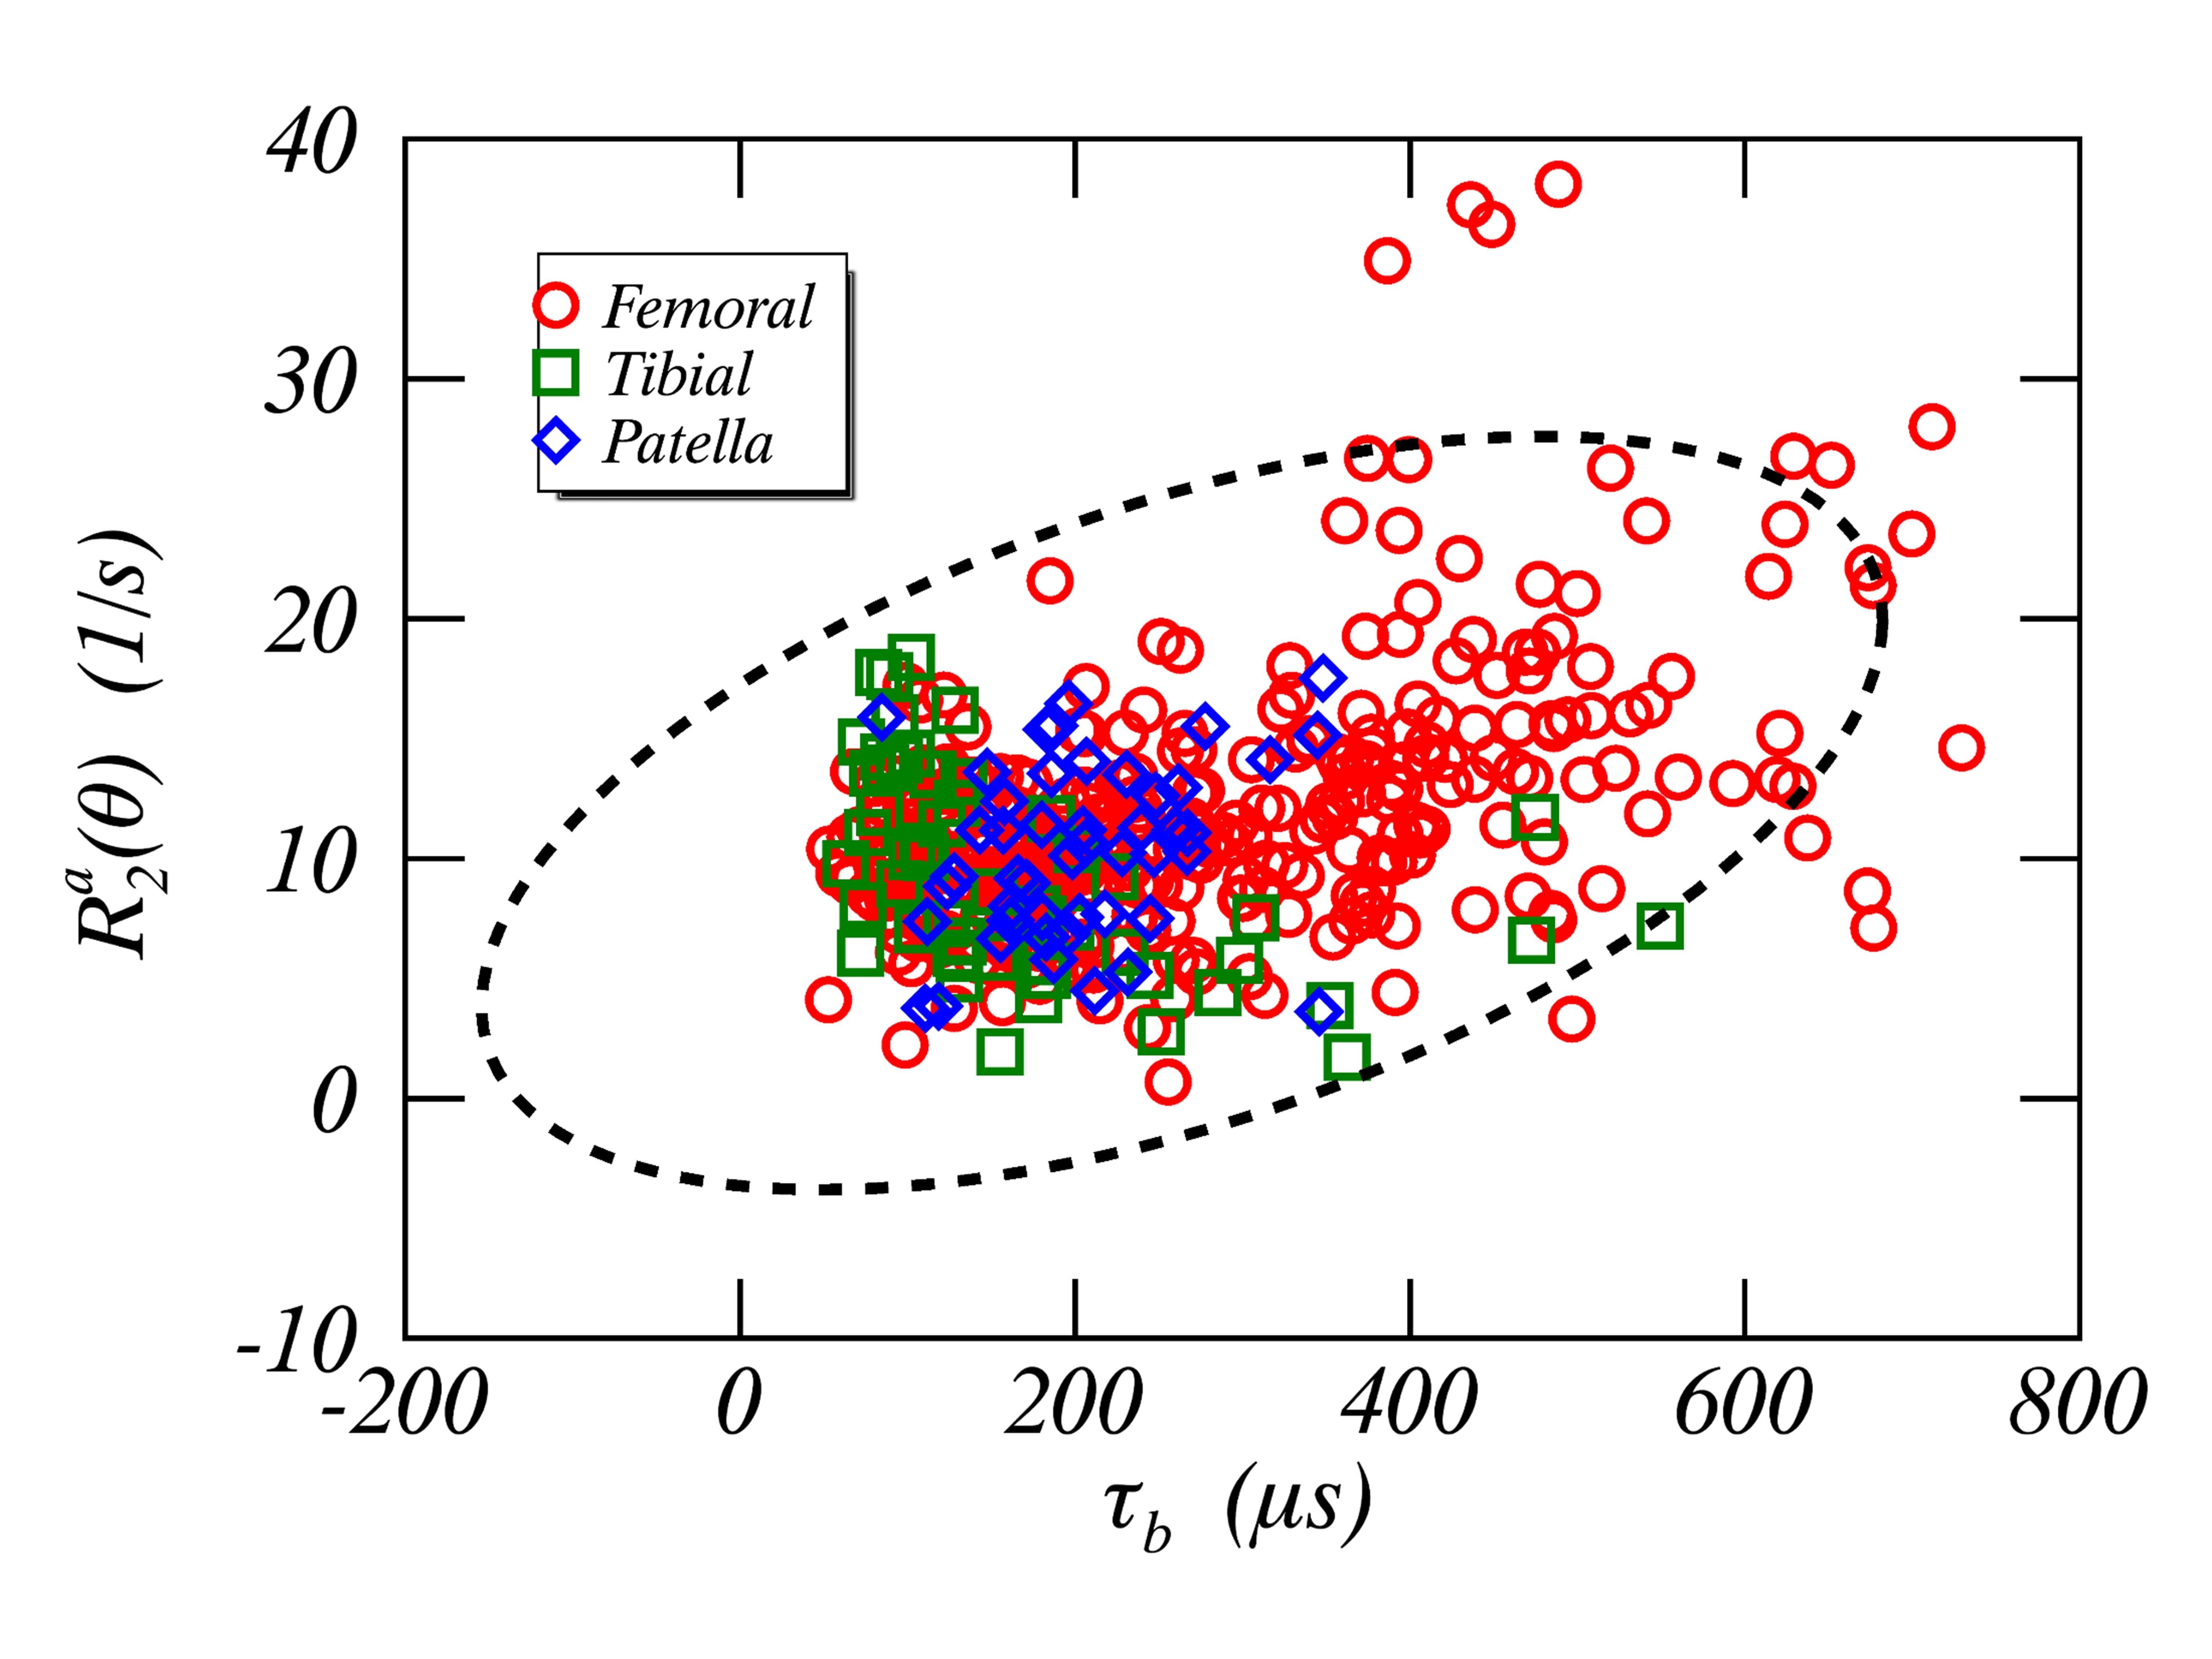
Fig. 1 presents the orientation-dependent $$$T_2$$$ (left) and $$$T_{1ρ}$$$ relaxation depth-profiles with spin-lock RF strengths of 250 (middle) and 2000 Hz (right panel) for one bovine patellar sample (B1S2). Clearly, the magic angle effect in $$$T_2$$$ can be easily recognized in the deep zone when the sample orientated at around 60° relative to $$$B_0$$$. Averaged in the deep cartilage, the orientation-dependence of $$$R_{1ρ}(1/T_{1ρ})$$$ were modeled (solid lines) as a function of $$$R_2^a(θ)$$$ and are plotted in Fig. 2 for $$$ω_1/2π$$$ of 0, 250 and 2000 Hz. Fig. 3 presents a scatter-plot between the orientation-dependent $$$R_2^a(θ)$$$ and the corresponding $$$τ_b$$$ derived from four samples when each being orientated below either 35° or 50° for robust curve-fittings, which demonstrated a significantly high average correlation (r = 0.89±0.05, P < 0.05) but with varying regression slopes as indicated by the different orientations of 95% confidence-level ellipses. Based on the fitted elliptical centroids, the order parameters $$$S$$$ for four samples were calculated as 4.12, 3.17, 5.09 and 3.36 (*10-3), respectively. An exemplary human knee $$$T_{1ρ}$$$ image slice ($$$ω_1/2π$$$=125 Hz, TSL=1 ms) was presented in Fig. 4 superimposed with the localized segmentation, and the derived $$$R_2^a(θ)$$$ in the deep zones for the three cartilages were correlated with $$$τ_b(θ)$$$ in Fig. 5, showing a moderate positive (r = 0.51, P < 0.01) correlation. Relative to those measured in the femoral cartilage, the derived parameters from the tibial and patellar cartilages were clustered into smaller areas. Based on the average $$$R_2^a(θ)$$$ and $$$τ_b(θ)$$$, the order parameters $$$S$$$ for the three cartilages were respectively estimated to 1.66 (femoral), 1.86 (tibial) and 1.79(*10-3) (patellar). The observed varying levels of water bonding to collagen fibers, in terms of $$$S$$$, had revealed different cartilage biomechanical properties. The observed moderate correlation between $$$R_2^a(θ)$$$ and $$$τ_b(θ)$$$ in human knee was anticipated as the bound water may adopt different alignments along collagen fibers at different spatial locations. Previously, $$$τ_b(θ)$$$ was proposed as a new biomarker for cartilage degenerative changes5, which could face the same challenges in clinical applications as found for an anisotropic $$$R_2^a(θ)$$$ relaxation metric6. The order parameter could be an alternative to characterize the integrity of collagen fibers independent of orientations.CONCLUSION
An orientation-independent MRI metric can be derived from $$$R_{1ρ}$$$ dispersion in articular cartilage, which could become a potential indicator for the integrity of collagen fibers in articular cartilage in clinical applications.Acknowledgements
The author is very grateful to Drs. Mikko J. Nissi and Nina Hänninen for making publicly available the orientation-dependent bovine patellar cartilage relaxation data used in this study, and to Dr. Thomas L. Chenevert for his encouragements and supports.References
- Zheng S, Xia Y. Multi-components of T2 relaxation in ex vivo cartilage and tendon. J Magn Reson 2009;198(2):188-196.
- Mlynarik V, Szomolanyi P, Toffanin R, et al. Transverse relaxation mechanisms in articular cartilage. J Magn Reson 2004;169(2):300-307.
- Bydder M, Rahal A, Fullerton GD, et al. The magic angle effect: a source of artifact, determinant of image contrast, and technique for imaging. J Magn Reson Imaging 2007;25(2):290-300.
- Momot KI, Pope JM, Wellard RM. Anisotropy of spin relaxation of water protons in cartilage and tendon. NMR Biomed 2010;23(3):313-324.
- Kajabi AW, Nissi MJ, Ketola J, et al. Correlation time mapping of articular cartilage degeneration in equine model. In: Proceedings of the 25th Annual Metting of ISMRM, Honolulu, HI, USA, 2017. (abstract 1541).
- Pang Y, Palmieri-Smith RM, Chenevert TL. A composite metric R2-R1ρ measures an incomplete anisotropic R2 of human femoral cartilage at 3T. In: Proceedings of the 26th Annual Meeting of ISMRM, Paris, France, 2018. (abstract 3104).
- Fechete R, Demco DE, Blumich B, et al. Anisotropy of collagen fiber orientation in sheep tendon by 1H double-quantum-filtered NMR signals. J Magn Reson 2003;162(1):166-175.
- Hanninen N, Rautiainen J, Rieppo L, et al. Orientation anisotropy of quantitative MRI relaxation parameters in ordered tissue. Sci Rep 2017;7(1):9606.
Figures