1323
T1ρ Relaxation of Human Articular Cartilage Using Time-fractional Order Model1Paul C. Lauterbur Research Center for Biomedical Imaging, Shenzhen Institutes of Advanced Technology, Chinese Academy of Sciences, Shenzhen, China, 2Shenzhen College of Advanced Technology, University of Chinese Academy of Sciences, Shenzhen, China, 3Department of Imaging and Interventional Radiology, The Chinese University of Hong Kong, HongKong, China, 4Research Center for Medical AI, Shenzhen Institutes of Advanced Technology, Chinese Academy of Sciences, Shenzhen, China
Synopsis
T1ρ imaging is a promising non-invasive
diagnostic tool for early detection of articular cartilage degeneration. A mono-exponential
model is normally used to describe the T1ρ relaxation process. However, mono-exponentials
may not adequately to describe NMR relaxation in complex, heterogeneous, and
anisotropic materials, such as articular cartilage. Fractional-order models
have been successfully used to describe complex relaxation phenomena in the
laboratory frame in cartilage matrix components. In this work, we develop a
time-fractional order (T-FACT) model to analyze T1ρ relaxation in human articular
cartilage. The results show the proposed method can better represent the T1ρ
relaxation in human articular cartilage.
Introduction
T1ρ imaging1 provides a promising quantitative technology for noninvasive tissue characterization and has demonstrated its potential in characterizing the earliest changes in articular cartilage degeneration. T1ρ relaxation is a spin-lattice relaxation decay in the rotating frame during the application of spin-locking pulse (TSL). A mono-exponential model is normally used to describe the T1ρ relaxation process. However, mono- or sums of exponentials may not adequately to describe NMR relaxation in complex, heterogeneous, and anisotropic materials, such as biological tissue2-4. Fractional-order models have been successfully used to describe complex relaxation phenomena in the laboratory frame in cartilage matrix components and native cartilage3. Thus, it is reasonable to consider such models for T1ρ relaxation in articular cartilage. In this work, we aim to develop a time-fractional order (T-FACT) model to analyze T1ρ relaxation in human articular cartilage.Theory and Methods
Fractional calculus aims to improve the power of clinical diagnosis through improved modeling. It has been successfully used to extend the classical Bloch equations and has been proposed to fit the experimental bovine cartilage data with an accuracy that is not achievable with the classical mono-exponential model in the laboratory frame2-4. Similar to T1 and T2 relaxation, the process of spin-lattice relaxation in the rotating frame can be described as time-fractional order relaxation. Here, we adopt time-fractional order (T-FACT) model developed by Magin et al2, 4 to express the process of T1ρ relaxation. Thus, the T-FACT model used to fit voxel-wise image intensities with different TSLs can be described as $$S_n=S_0 \cdot E_{\alpha}(\frac{-TSL_n^{ \alpha}}{T_{1\rho}^{'}}),$$ where $$$E_{\alpha}(t)$$$ is the single-parameter Mittag-Leffler function2-4, $$$T_{1\rho}^{'}=\tau^{\alpha-1}T_{1\rho}$$$, $$$\tau$$$ is fractional time constant to maintain a consistent set of units on both sides of Bloch equation, and α is the fractional-order in time. In the case of α=1, the Mittag-Leffler function degrades to the conventional mono-exponential relaxation process.
Data sets were acquired from a Philips Achieva 3.0TX scanner (Philips Healthcare, Best, the Netherlands) with an eight channel T/R knee coil (Invivo Corp, Gainesville, USA). Sagittal knee scan of one subject was conducted under the approval of the Institutional Review. A T1ρ-prepared fast spin echo with fat suppression was used for 39 slices data scanning. The acquisition parameters include: resolution 1 x 1 x 3 mm3, TR/TE 2200/23 ms, spin-lock frequency 500Hz, and 4 time-of-spinlock (TSL) [0 10 25 50] ms.
The data sets were fitted to the mono-exponential (MONO) model and the T-FACT model, respectively. $$$RMSE_{Model}=\sqrt{\sum_{n}(S_{Model}(TSL_{n})- S_{Acquired}(TSL_{n}))^{2}/N}$$$was performed to compare the two relaxation models voxel by voxel, where N the number of TSLs, $$$S_{Model}(TSL_{n})$$$ the intensity of $$$n$$$th TSL from $$$Model$$$ (means MONO or T-FACT model) and $$$S_{ Acquired }(TSL_{n})$$$ the acquired intensity of $$$n$$$th TSL.
Results
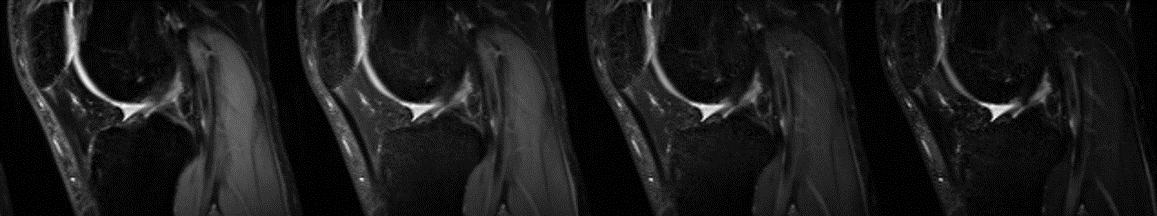
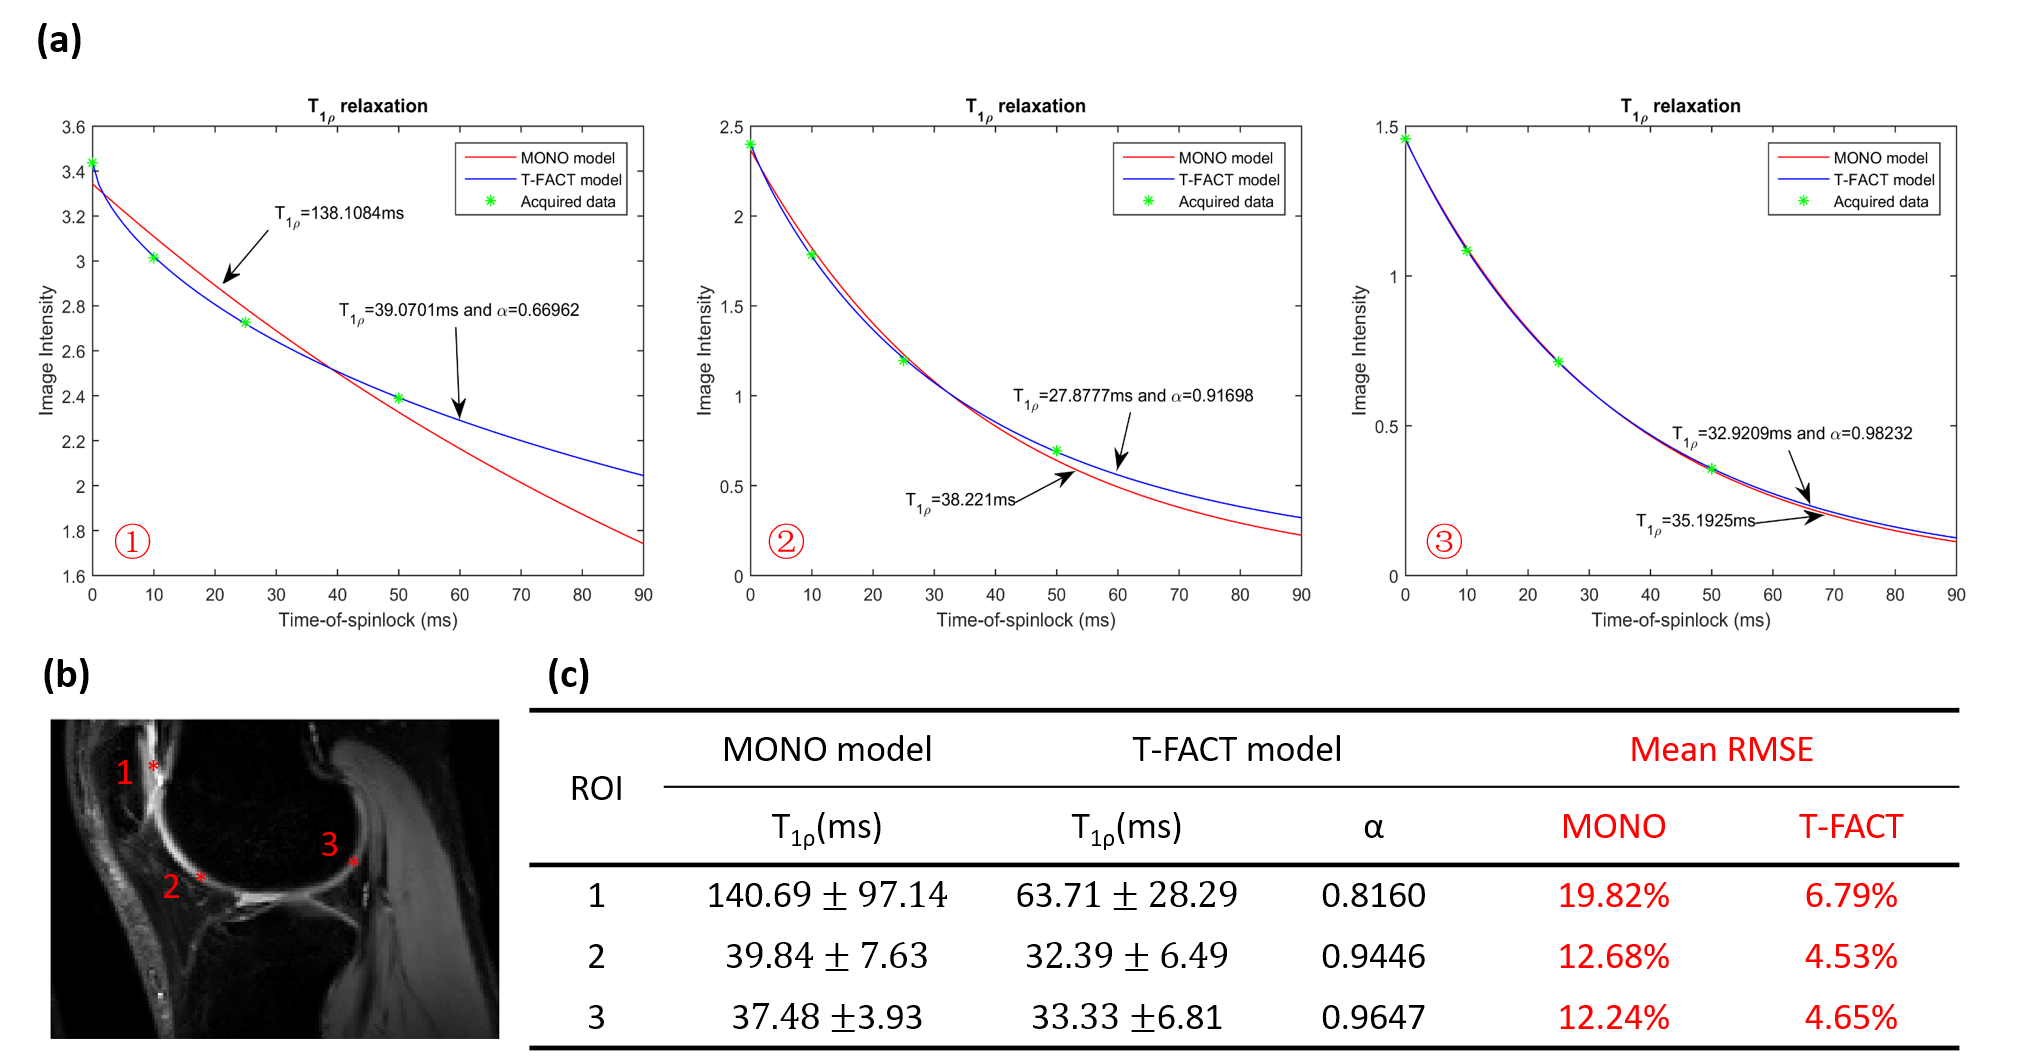
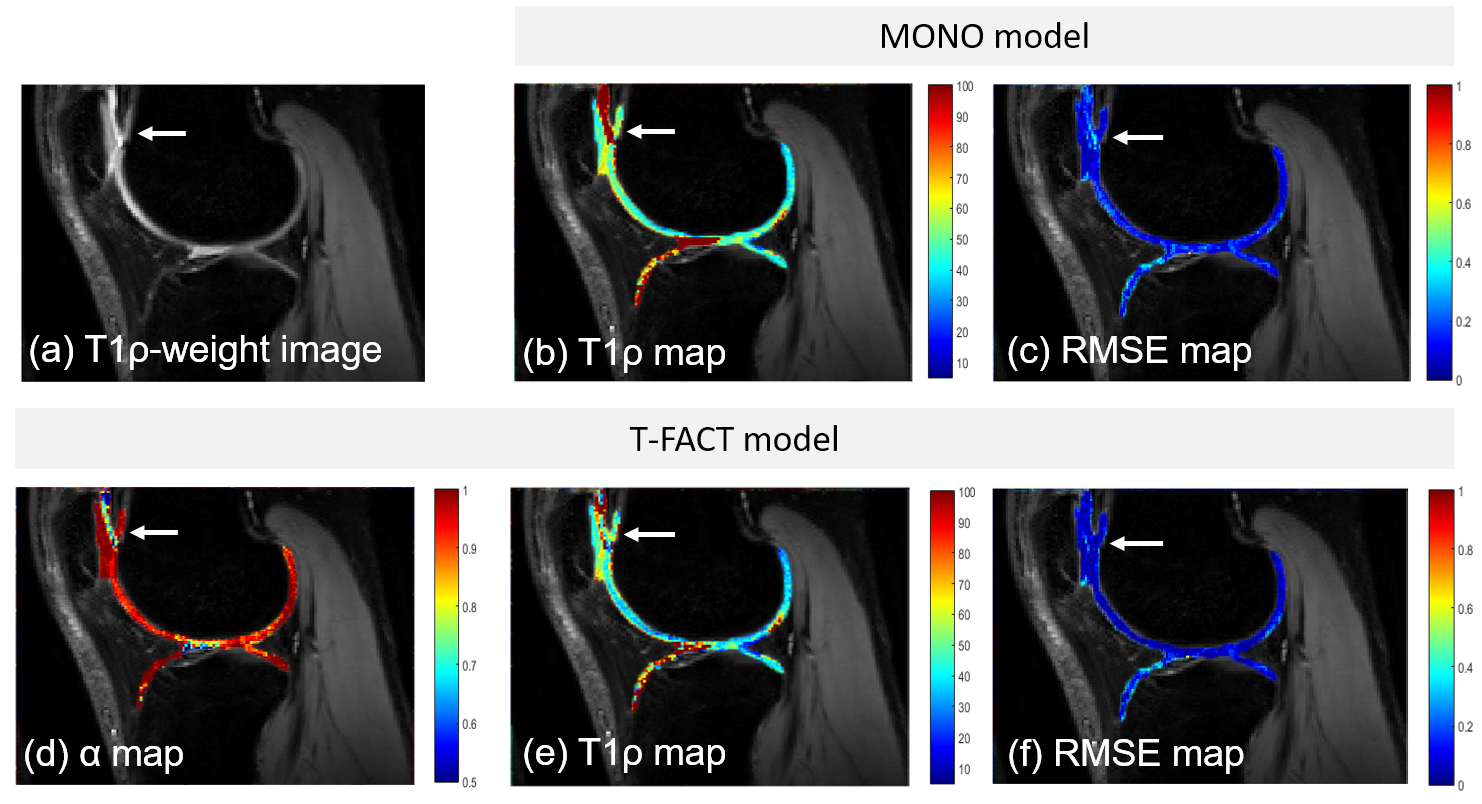
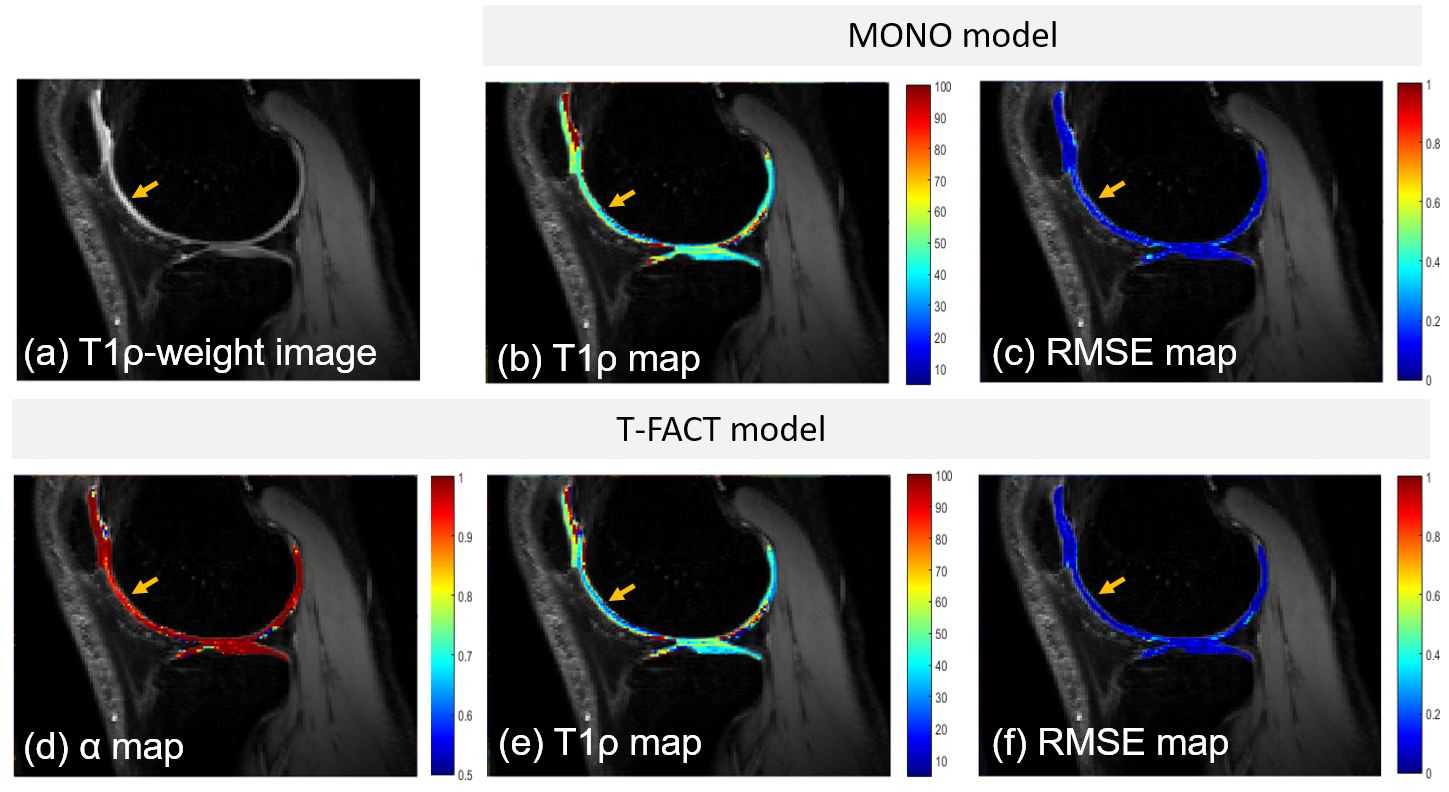
In the all slices of the subject, the T-FACT model shows improved fitting of the acquired data compared to the mono-exponential model. Figure 1 shows typical T1ρ-prepared images on a representative slice in the articular cartilage with different TSLs. Three typical fitting results on three voxels (selected from Figure 2(b)) using two relaxation models are shown on Figure 2(a). Mean RMSEs show that the T-FACT model fit the relaxation much better than the MONO model (Figure 2.c). Figure 3 shows some parameter maps including T1ρ maps, α map, and RMSE maps of the representative slice of the articular cartilage using two fitting models. The complexity of the tissue is depicted in the α map. White arrows (articular cartilage of the patella) show a sharp deviation from the mono-exponential model, but follow T-FACT better. Figure 4 exhibits fitting results using two relaxation models in another slice of the articular cartilage. All results demonstrate that the proposed model is able to fit the experimental data with smaller root mean squared error than the classical mono-exponential relaxation model as shown in Figure 3 and 4.Discussion and Conclusion
Anomalous relaxation illustrated in the first plots on Figure 2(a) leads to the sharp deviation of acquired data from the mono-exponential decay, which results to abnormal T1ρ values as shown on the white arrows (Figure 3). One possible reason could be that articular cartilage is no longer satisfy the theoretical assumptions underlying the classical Bloch equations due to the complex environment including synovial fluid and ligament. The proposed T-FACT model widens the scope of application by extending the classical equations and dispenses with other assumption such as compartmentalized signal hypothesis in bi-exponential model. The fractional order α in T-FACT model may capture information for structural complexity inside or outside the human articular cartilage. Further investigation is needed to understand the contribution of fractional order α and its potential clinical explanation.Acknowledgements
This study is supported by the grant from the National Science Foundation of China (No.81830056, No. 61471350, No. 81729003, No. 61871373), National Key R&D Program of China (2016YFC0100100), and Guangdong Provincial Key Laboratory of Medical Image Processing (No. 2017A050501026, No. 2018A0303130132).References
1. Y. J. Wang, Q. Zhang, X. Li, W. Chen, A. Ahuja, and J. Yuan. “T1ρ magnetic resonance: basic physics principles and applications in knee and intervertebral disc imaging”. Quantitative imaging in medicine and surgery, vol. 5, pp. 858-885, 2015.
2. R. L. Magin, X.Feng, D. Baleanu, “Solving the fractional order Bloch equation,” Concepts Magn. Reson., vol. 34,pp. 16–23, 2009.
3. R. L. Magin, Weiguo Li, M. P. Velasco, J. Trujillo, D. A. Reiter, A. Morgenstern, R. G. Spencer, “Anomalous NMR relaxation in cartilage matrix components and native cartilage: Fractional-order models”, Journal of Magnetic Resonance, vol. 210, pp. 184-191, 2011.
4. S. Qin, F. Liu, I. W. Turner, Q. Yu, Q. Yang, and V. Vegh, “Characterization of anomalous relaxation using the time-fractional Bloch equation and multiple echo T2*-weighted magnetic resonance imaging at 7 T,” Magn. Reson. Med., vol. 77, pp. 1485-1494, 2017.
Figures