1320
Evaluating the Relationship Between gagCEST MRI and Cartilage Biochemical Composition in Juvenile Bovine Articular Cartilage1Bioengineering, Stanford University, Stanford, CA, United States, 2Radiology, Stanford University, Stanford, CA, United States, 3Mechanical Engineering, Stanford University, Stanford, CA, United States
Synopsis
Chemical exchange saturation transfer of glycosaminoglycans (gagCEST) is a quantitative MR technique with potential for detecting early changes in cartilage composition. However, its relationship to tissue glycosaminoglycan (GAG) content has not yet been validated using standard biochemical assays. Here, we examine the relationship between gagCEST at 3T and 7T to cartilage biochemical properties using immature bovine femoral cartilage. Comparison of deep and superficial gagCEST asymmetry maps suggest that while gagCEST reflects the laminar differences in biochemical GAG composition, there is a weak correlation between gagCEST asymmetry and GAG content at 7T and 3T.
Introduction
Osteoarthritis (OA) is a progressive and debilitating disease. In early OA, enzymatic degradation of cartilage has been shown to induce glycosaminoglycan (GAG) depletion1. Many MR imaging strategies have been developed to detect early OA changes in cartilage composition. Chemical exchange saturation transfer of GAG (gagCEST) uses chemical exchange of specifically saturated exchangeable protons on the hydroxyl groups of GAG molecules and bulk water protons to provide contrast and monitor cartilage GAG content in vivo2. Early work on gagCEST imaging found strong correlations between gagCEST and sodium MR in healthy and surgically repaired cartilage at 7T3. Prior work suggests that gagCEST can distinguish laminar differences in bovine cartilage at both 3T and 7T with good dynamic range4. While these studies show the potential of gagCEST in detecting changes in cartilage composition, its relationship to tissue GAG content has not yet been directly validated using standard biochemical assays. Here, we examine the relationship between gagCEST at 3T and 7T to cartilage biochemical GAG content using immature bovine femoral cartilage.Methods
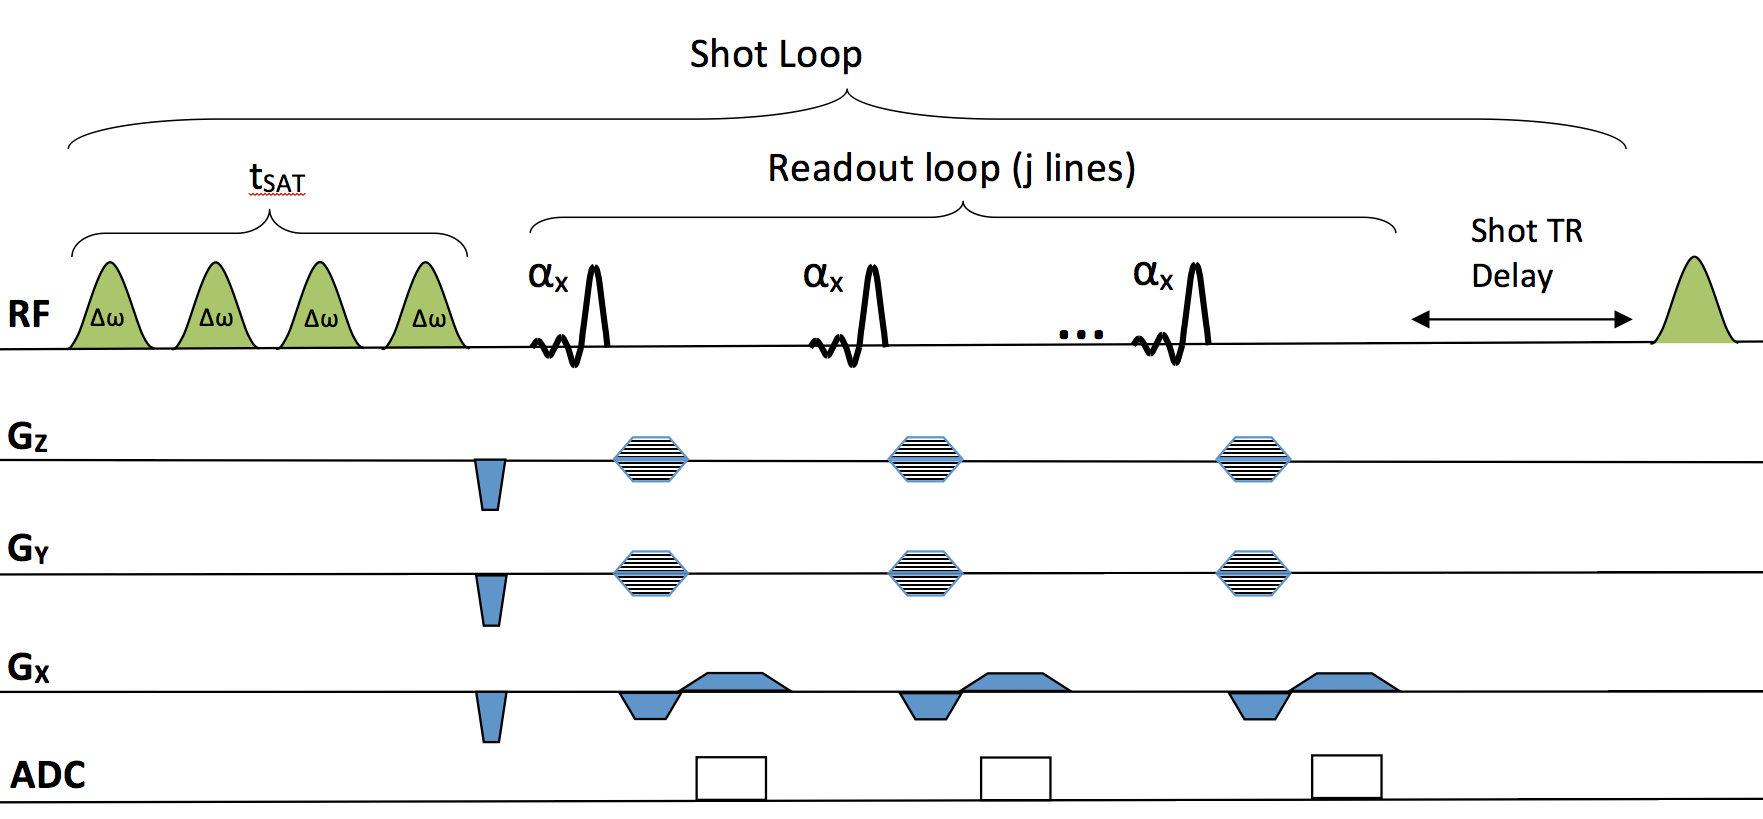
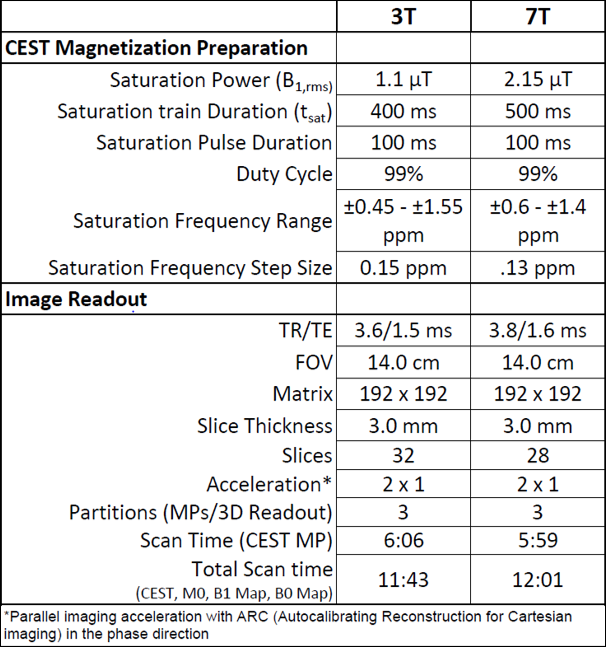
Six intact, immature bovine stifles (San Jose Valley Veal, Santa Clara, CA) were imaged at room temperature on 3T and 7T MR scanners (GE Healthcare) using 16-channel and 32-channel coils, respectively. GagCEST images were acquired using a magnetization prepared 3D spoiled gradient-echo sequence (Figure 1) with parameters shown in Figure 24. CEST analysis was performed using custom MATLAB scripts to correct for B0 and B1 field inhomogeneities as described previously5. CEST asymmetry due to GAG was calculated using the normalized B0 corrected signal intensity at ±1.0 ppm, the chemical shift of GAG hydroxyl protons, using the equation: $gagCEST_asym = S_(-1.0 ppm) - S_(+1.0 ppm)/S_0 $. After imaging, full-thickness cylindrical cartilage explants were harvested from the femoral condyles using a 4mm-diameter biopsy punch. Explants were separated into superficial and deep halves and weighed. GAG and collagen content were assessed using DMMB and OHP biochemical assays, respectively6,7. Explant locations were manually segmented on anatomic images acquired after harvesting and masks were registered to the intact scans using Amira software (Thermo Scientific). A Pearson’s correlation coefficient was used to relate biochemical results to gagCEST asymmetry (%) and Wilcoxon signed rank tests were used to assess statistical significance (α = 0.05).Results
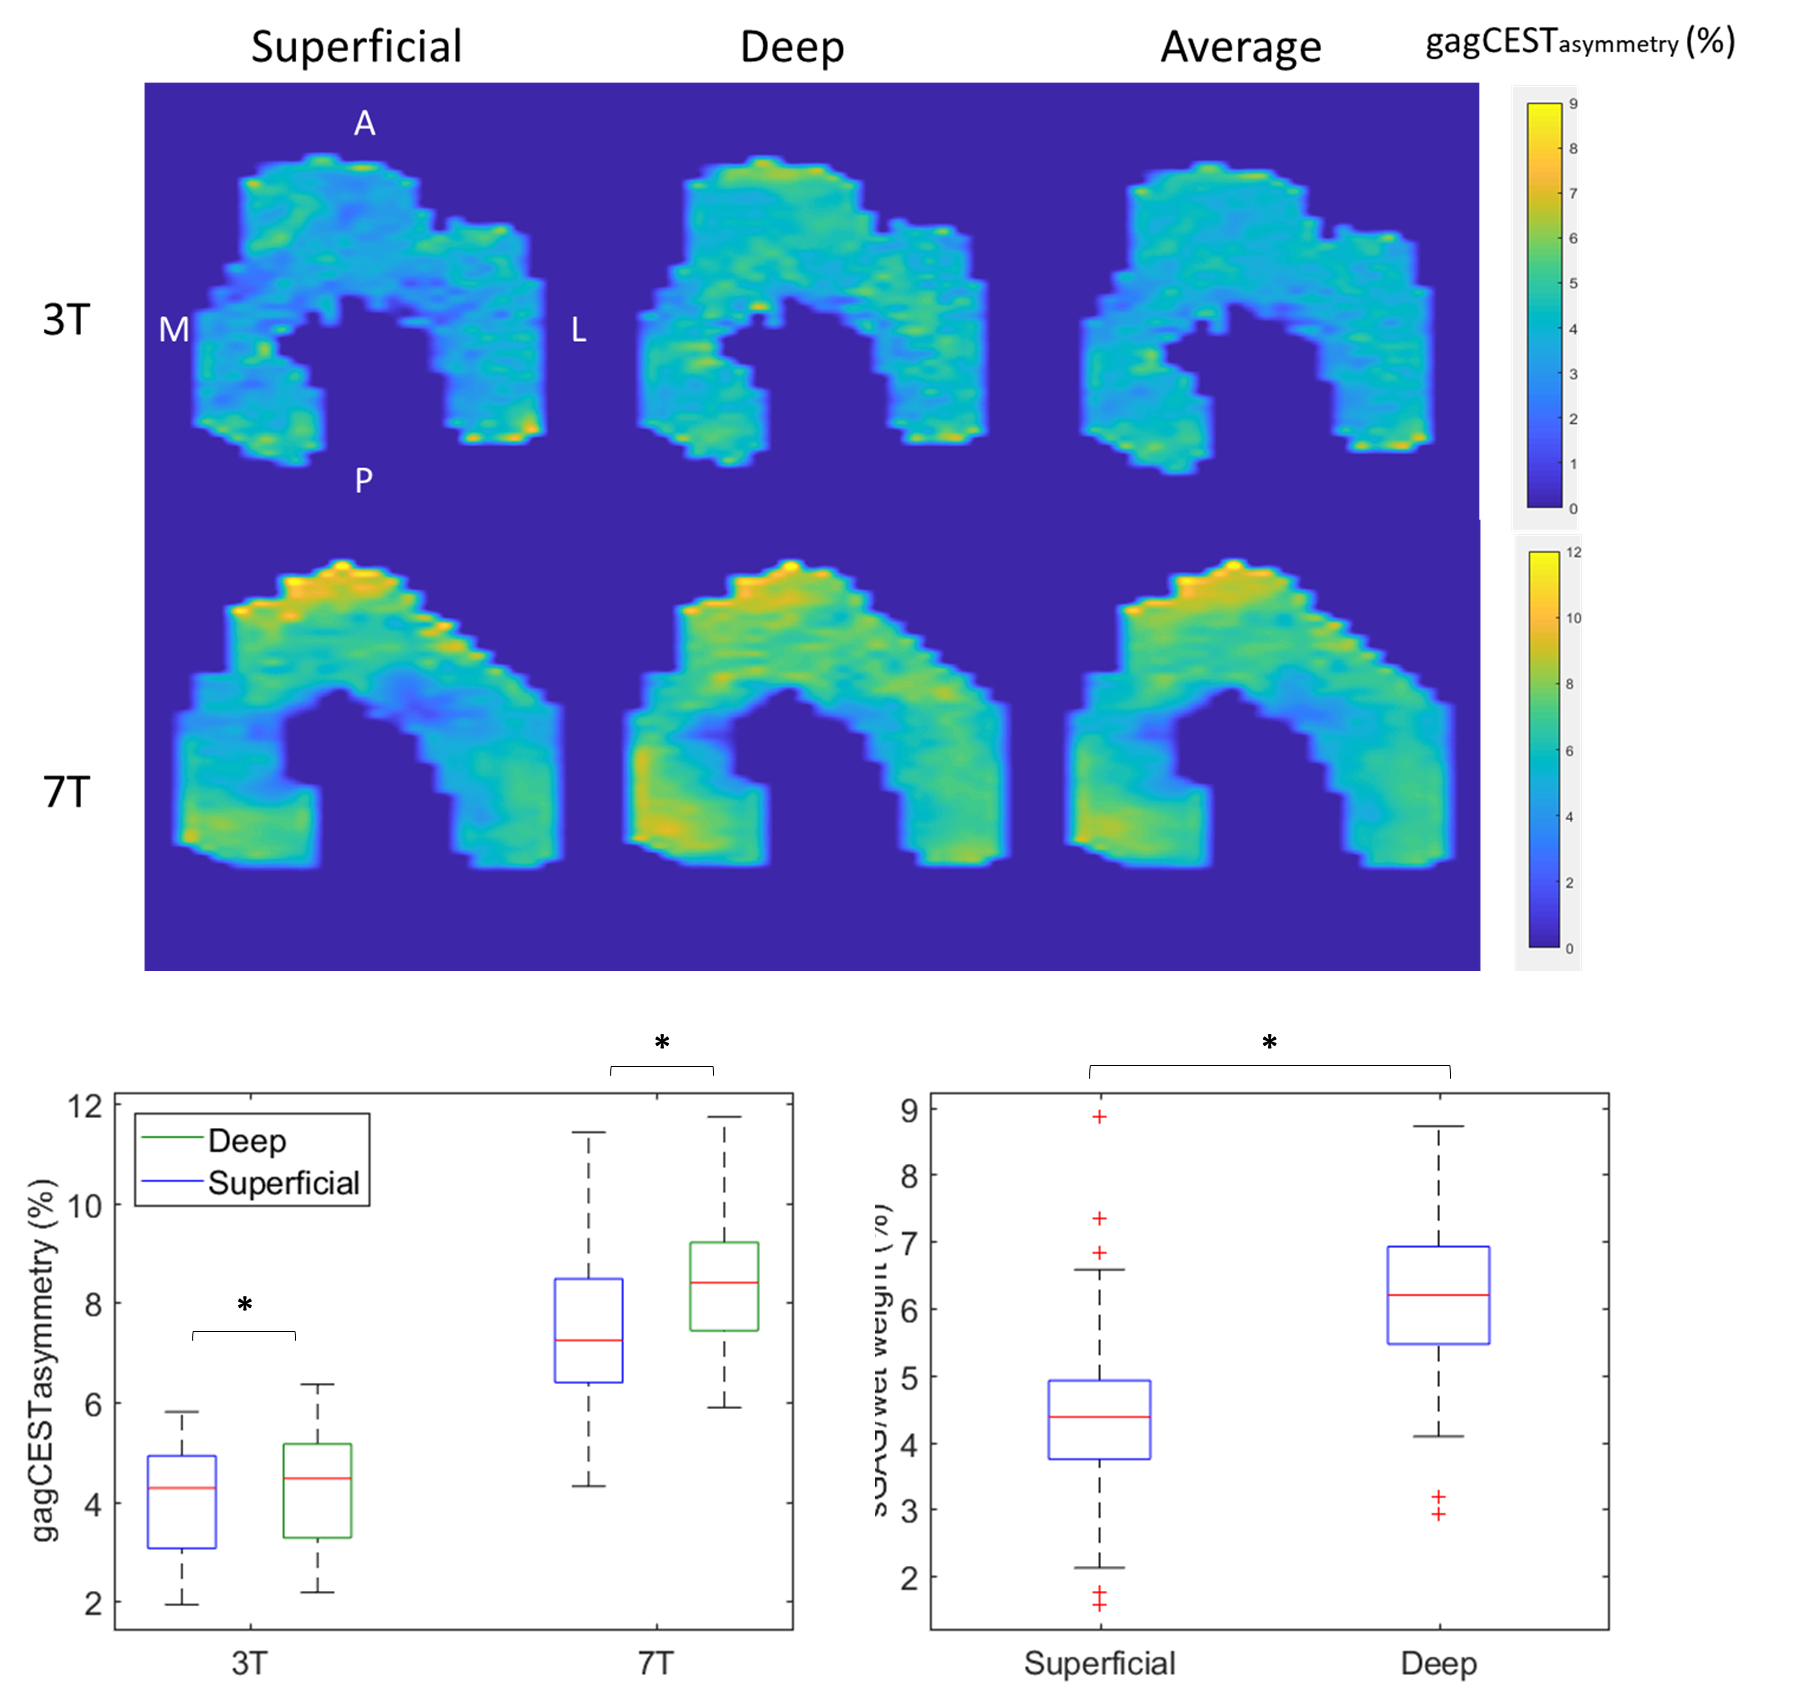
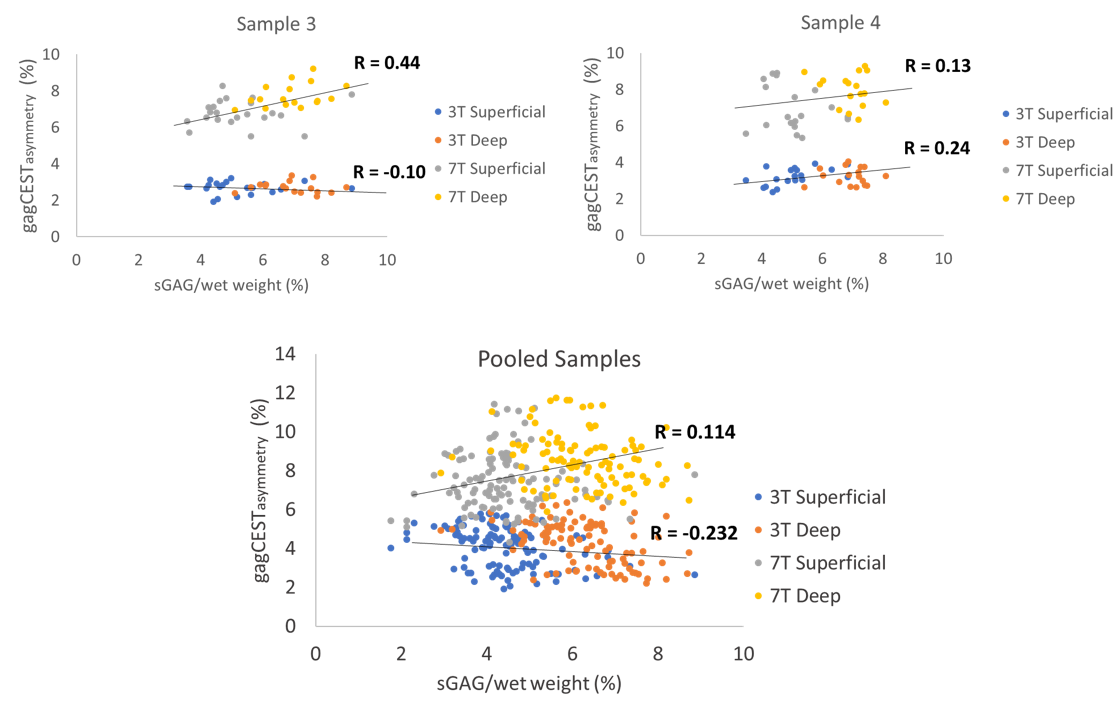
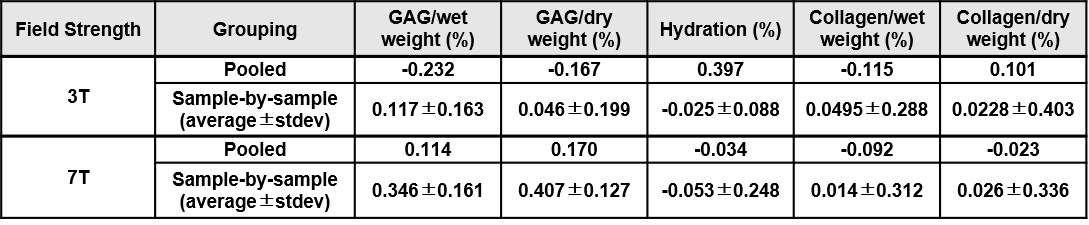
Comparison of deep and superficial gagCEST asymmetry maps obtained at 3T and 7T suggest that gagCEST reflects laminar differences in biochemical GAG composition in femoral cartilage (Figure 3). Average biochemical GAG content (GAG/wet weight (%)) was significantly greater in the deep zone than in the superficial zone (p < 0.001). This pattern was also true for gagCEST asymmetry at both 7T and 3T (p < 0.001). On a sample-by-sample basis, there was a weak positive correlation between gagCEST and GAG content at 7T (R = 0.346±0.161) and at 3T (R = 0.117±0.163) (Figure 4). When all samples were pooled together, there was a weak positive correlation at 7T (R = 0.114, p = 0.09) and a weak significant negative correlation at 3T (R = -0.232, p < 0.001). GagCEST was not correlated with cartilage hydration or collagen content at 7T but was significantly correlated with hydration at 3T (R = 0.397, p < 0.001) (Figure 5).Discussion
GagCEST is a promising imaging technique for detecting changes in cartilage composition, capable of distinguishing between regions of differing cartilage composition in human and bovine subjects3,4. Here, we found that average gagCEST asymmetry follows laminar trends of biochemical GAG distribution. In cartilage explants, there is a weak positive correlation with GAG content at 7T and no correlation with hydration or collagen content. At 3T, gagCEST had the strongest correlation with cartilage hydration compared to GAG or collagen content. Weak correlations suggest that factors other than biochemical content contribute to observed differences in gagCEST asymmetry in cartilage. Other exchange events arising from nuclear overhauser and magnetization transfer effects might result in asymmetric contributions to the z-spectra that are not accounted for in calculating gagCEST asymmetry. Further work will be done to identify such factors. Additionally, at 3T, a lower saturation power is used because of high direct water saturation and magnetization transfer effects that diminish SNR, leading to reduced saturation efficiency and sensitivity to GAG. It is also important to note that we studied bovine samples at room temperature, which likely resulted in different exchange conditions compared to in vivo human knees.Conclusion
This work suggests that within juvenile bovine cartilage, gagCEST reflects laminar differences in biochemical GAG composition. However, weak correlation between gagCEST and GAG content in cartilage explants suggests that factors other than biochemical content may contribute to these differences.Acknowledgements
This work was funded by the William K. Bowes Jr. Stanford Graduate Fellowship, GE Healthcare, and the National Institutes of Health (NIH) grants K99 EB022634, RO1 EB002524, and K24 AR062068.References
1. Malemud CJ. Changes in proteoglycans in osteoarthritis: biochemistry, ultrastructure and biosynthetic processing. Journal of Rheumatology Supplement, 1991;27:60-62.
2. Ling W, Regatte RR, Navon G, Jerschow A. Assessment of glycosaminoglycan concentration in vivo by chemical exchange-dependent saturation transfer (gagCEST). Proceedings of the National Academy of Science, 2008;105(7):2266-2270.
3. Schmitt B, Zbyn S, Stelzeneder D, Jellus V, Paul D, Lauer L, Bachert P, Trattnig S. Cartilage quality assessment by using glycosaminoglycan chemical exchange saturation transfer and (23)Na MR imaging at 7T. Radiology, 2011;260(1):257–264.
4. Watkins L, Black M, Kogan F, Levenston M, Gold G. (2018). “Quantitative gagCEST MRI in juvenile bovine articular cartilage exhibit correlations between 3T and 7T”. Proceedings of the ISMRM, Paris, France.
5. Kogan F, Hargreaves B, Gold G. Volumetric multislice gagCEST imaging of articular cartilage: optimization and comparison with T1rho. Magnetic Resonance in Medicine, 2017;77(3):1134-1141.
6. Farndale RW, Buttle DJ, Barrett AJ. Improved quantitation and discrimination of sulphated glycosaminoglycans by use of dimethylmethylene blue. Biochimica et Biophysica Acta, 1986;883(2):173-177.
7. Reddy GK, Enwemeka CS. A simplified method for the analysis of hydroxyproline in biological tissues. Clinical Biochemistry, 1996;29(3):225-229.
Figures