1319
Multiple-echo steady-state (MESS): Simultaneous water-fat separation, $$$T_2$$$, $$$T_2^{'}$$$, and $$$T_2^*$$$ mapping in the knee at 3 tesla1Image Sciences Institute, UMC Utrecht, Utrecht, Netherlands
Synopsis
This study proposes an extension of the double-echo steady-state (DESS) sequence to include multiple readouts. This multiple-echo steady-state (MESS) sequence supports quantification of water, fat, $$$T_2$$$, $$$T_2^{'}$$$, and $$$T_2^*$$$ in a single, efficient acquisition. These parameters may provide additional tissue-specific MRI biomarkers for early detection and grading of osteoarthritis (OA), on top of the $$$T_2$$$ quantification of cartilage provided by the DESS sequence. In vivo results show that parameter quantification using MESS corresponds well with quantification on water-selective DESS images.
Introduction
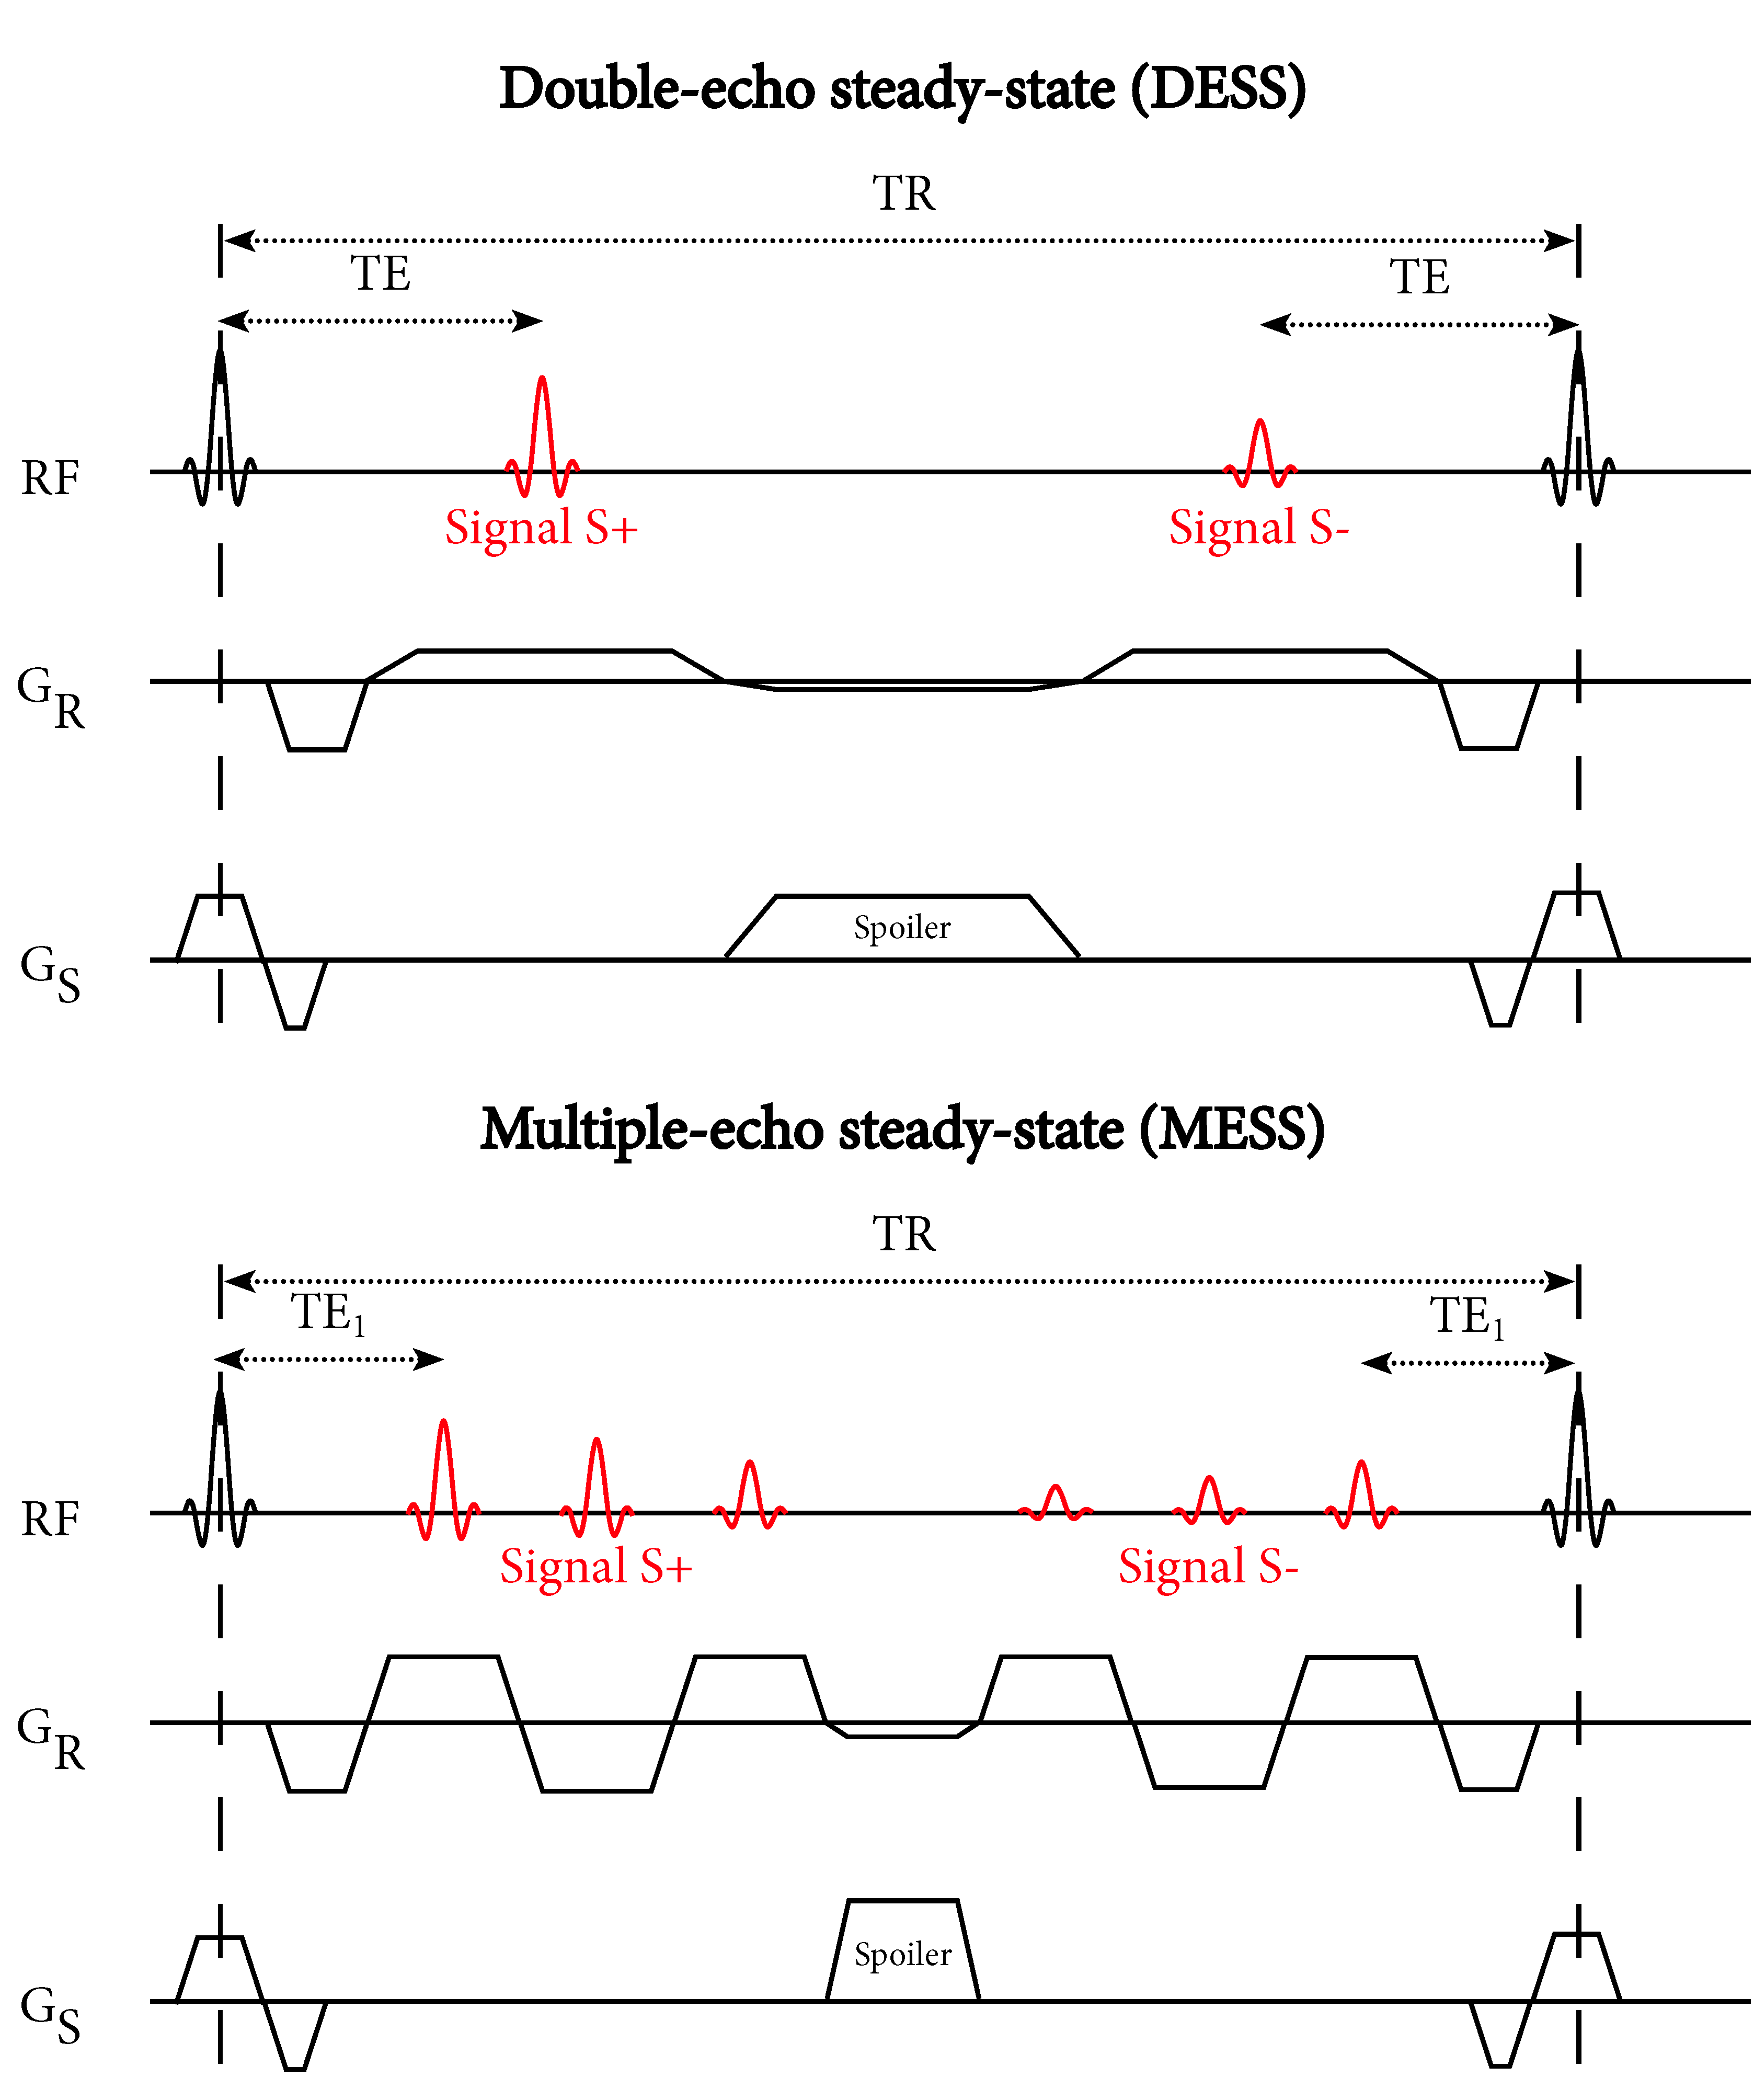
Osteoarthritis (OA) is a degenerative joint disease that causes the cartilage, bone and other structures in joints to break down, causing pain, impaired mobility, and disability. MRI-based biomarkers are promising for early detection of OA and focus primarily on assessing pathology in cartilage1. As osteoarthritis is not just a disease of the cartilage, we propose an extension to the double-echo steady-state (DESS) sequence, which aims to characterize cartilage damage by morphometry and $$$T_2$$$ quantification2. By replacing the two low bandwidth readouts in DESS (Figure 1A) with six shorter, higher bandwidth readouts (Figure 1B), our proposed sequence allows separation of water and fat signal using Dixon reconstruction, as well as quantification of $$$T_2^{'}$$$ and $$$T_2^*$$$ in addition to $$$T_2$$$. These parameters have been proven useful in assessment of bone marrow microstructure3, osteoporosis4, and muscle5, and may efficiently provide additional MRI biomarkers for OA detection and grading, in addition to the cartilage biomarkers provided by DESS.
Methods
Acquisition:
We
implemented the multiple-echo steady-state (MESS) sequence on a 3T scanner (Philips
Ingenia, Best, The Netherlands), and acquired DESS and MESS images of the knee
for one healthy volunteer (male, age 25, no history of knee injury). The
parameters for the DESS sequence were: TE1/TE2/TR 5.8/19.4/25.2, flip angle 20,
resolution $$$0.6 \times 0.6 \times 3.0$$$ mm, FOV $$$154 \times 154 \times
120$$$ mm, bandwidth 155 Hz/pixel, scan duration 202 seconds. The DESS sequence
used water excitation with a 1-2-1 binomial pulse. The parameters for the 6
echo MESS sequence were: TE1/TE2/TE3/TE4/TE5/TE6/TR
2.3/5.7/9.2/16.1/19.5/23.0/25.3, flip angle 20, resolution $$$0.6 \times 0.6
\times 3.0$$$ mm, FOV $$$154 \times 154 \times 132$$$ mm, bandwidth 593
Hz/pixel, scan duration 216 seconds. In both sequences a spoiler gradient was
applied in the slice direction to impose 4 cycles of dephasing per slice.
Parameter mapping:
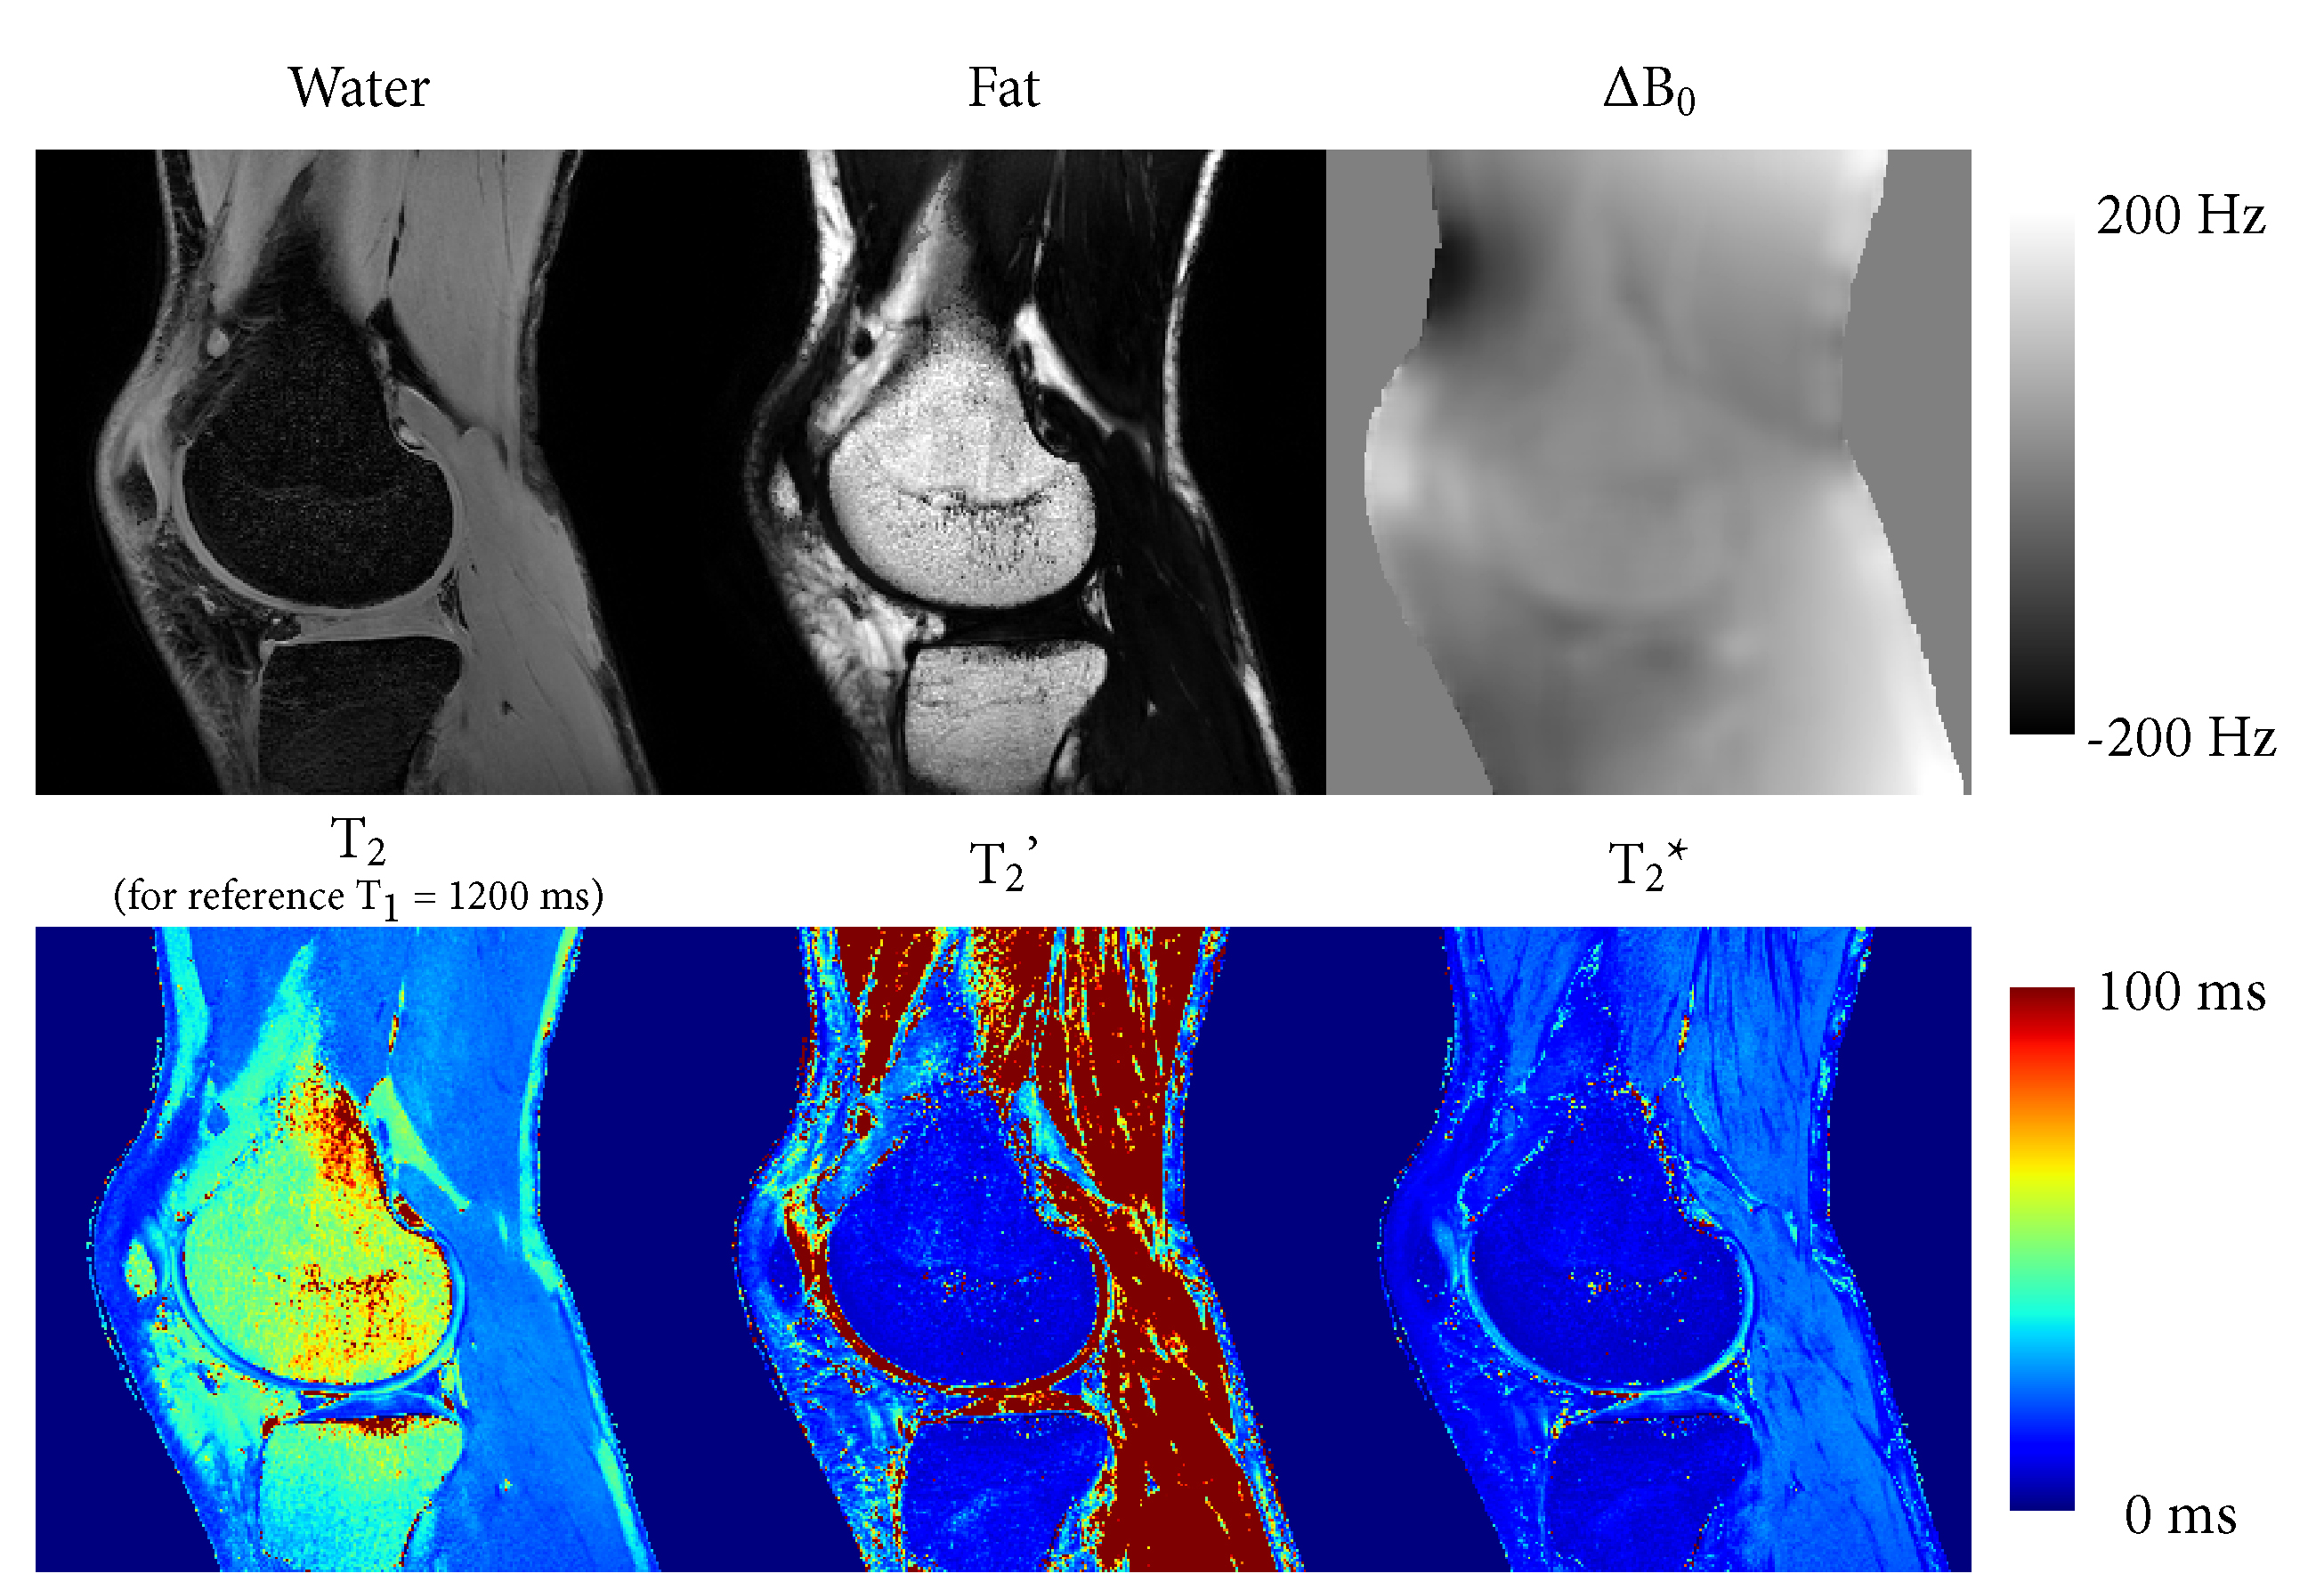
$$$T_2$$$ mapping in the DESS sequence was performed analytically, corrected with the reference $$$T_1$$$ for cartilage of 1200 ms6.
For the MESS sequence we fit water ($$$W$$$) and fat ($$$F$$$) amplitudes, $$$R_2$$$ and $$$R_2^{'}$$$ relaxation constants, field inhomogeneity ($$$\Delta B_0$$$), and two phase constants ($$$c_+$$$ and $$$c_-$$$), according to the following formulas:
$$S_+=(W+F\cdot C(TE))e^{-TE(R_2+R_2^{'})-i2\pi(\Delta B_0TE+c_+})$$
$$S_-=(W+F\cdot C(TE))e^{-(TR+TE)R_2-(TR-TE)R_2^{'}-i2\pi(\Delta B_0(TR-TE)+c_-)}$$
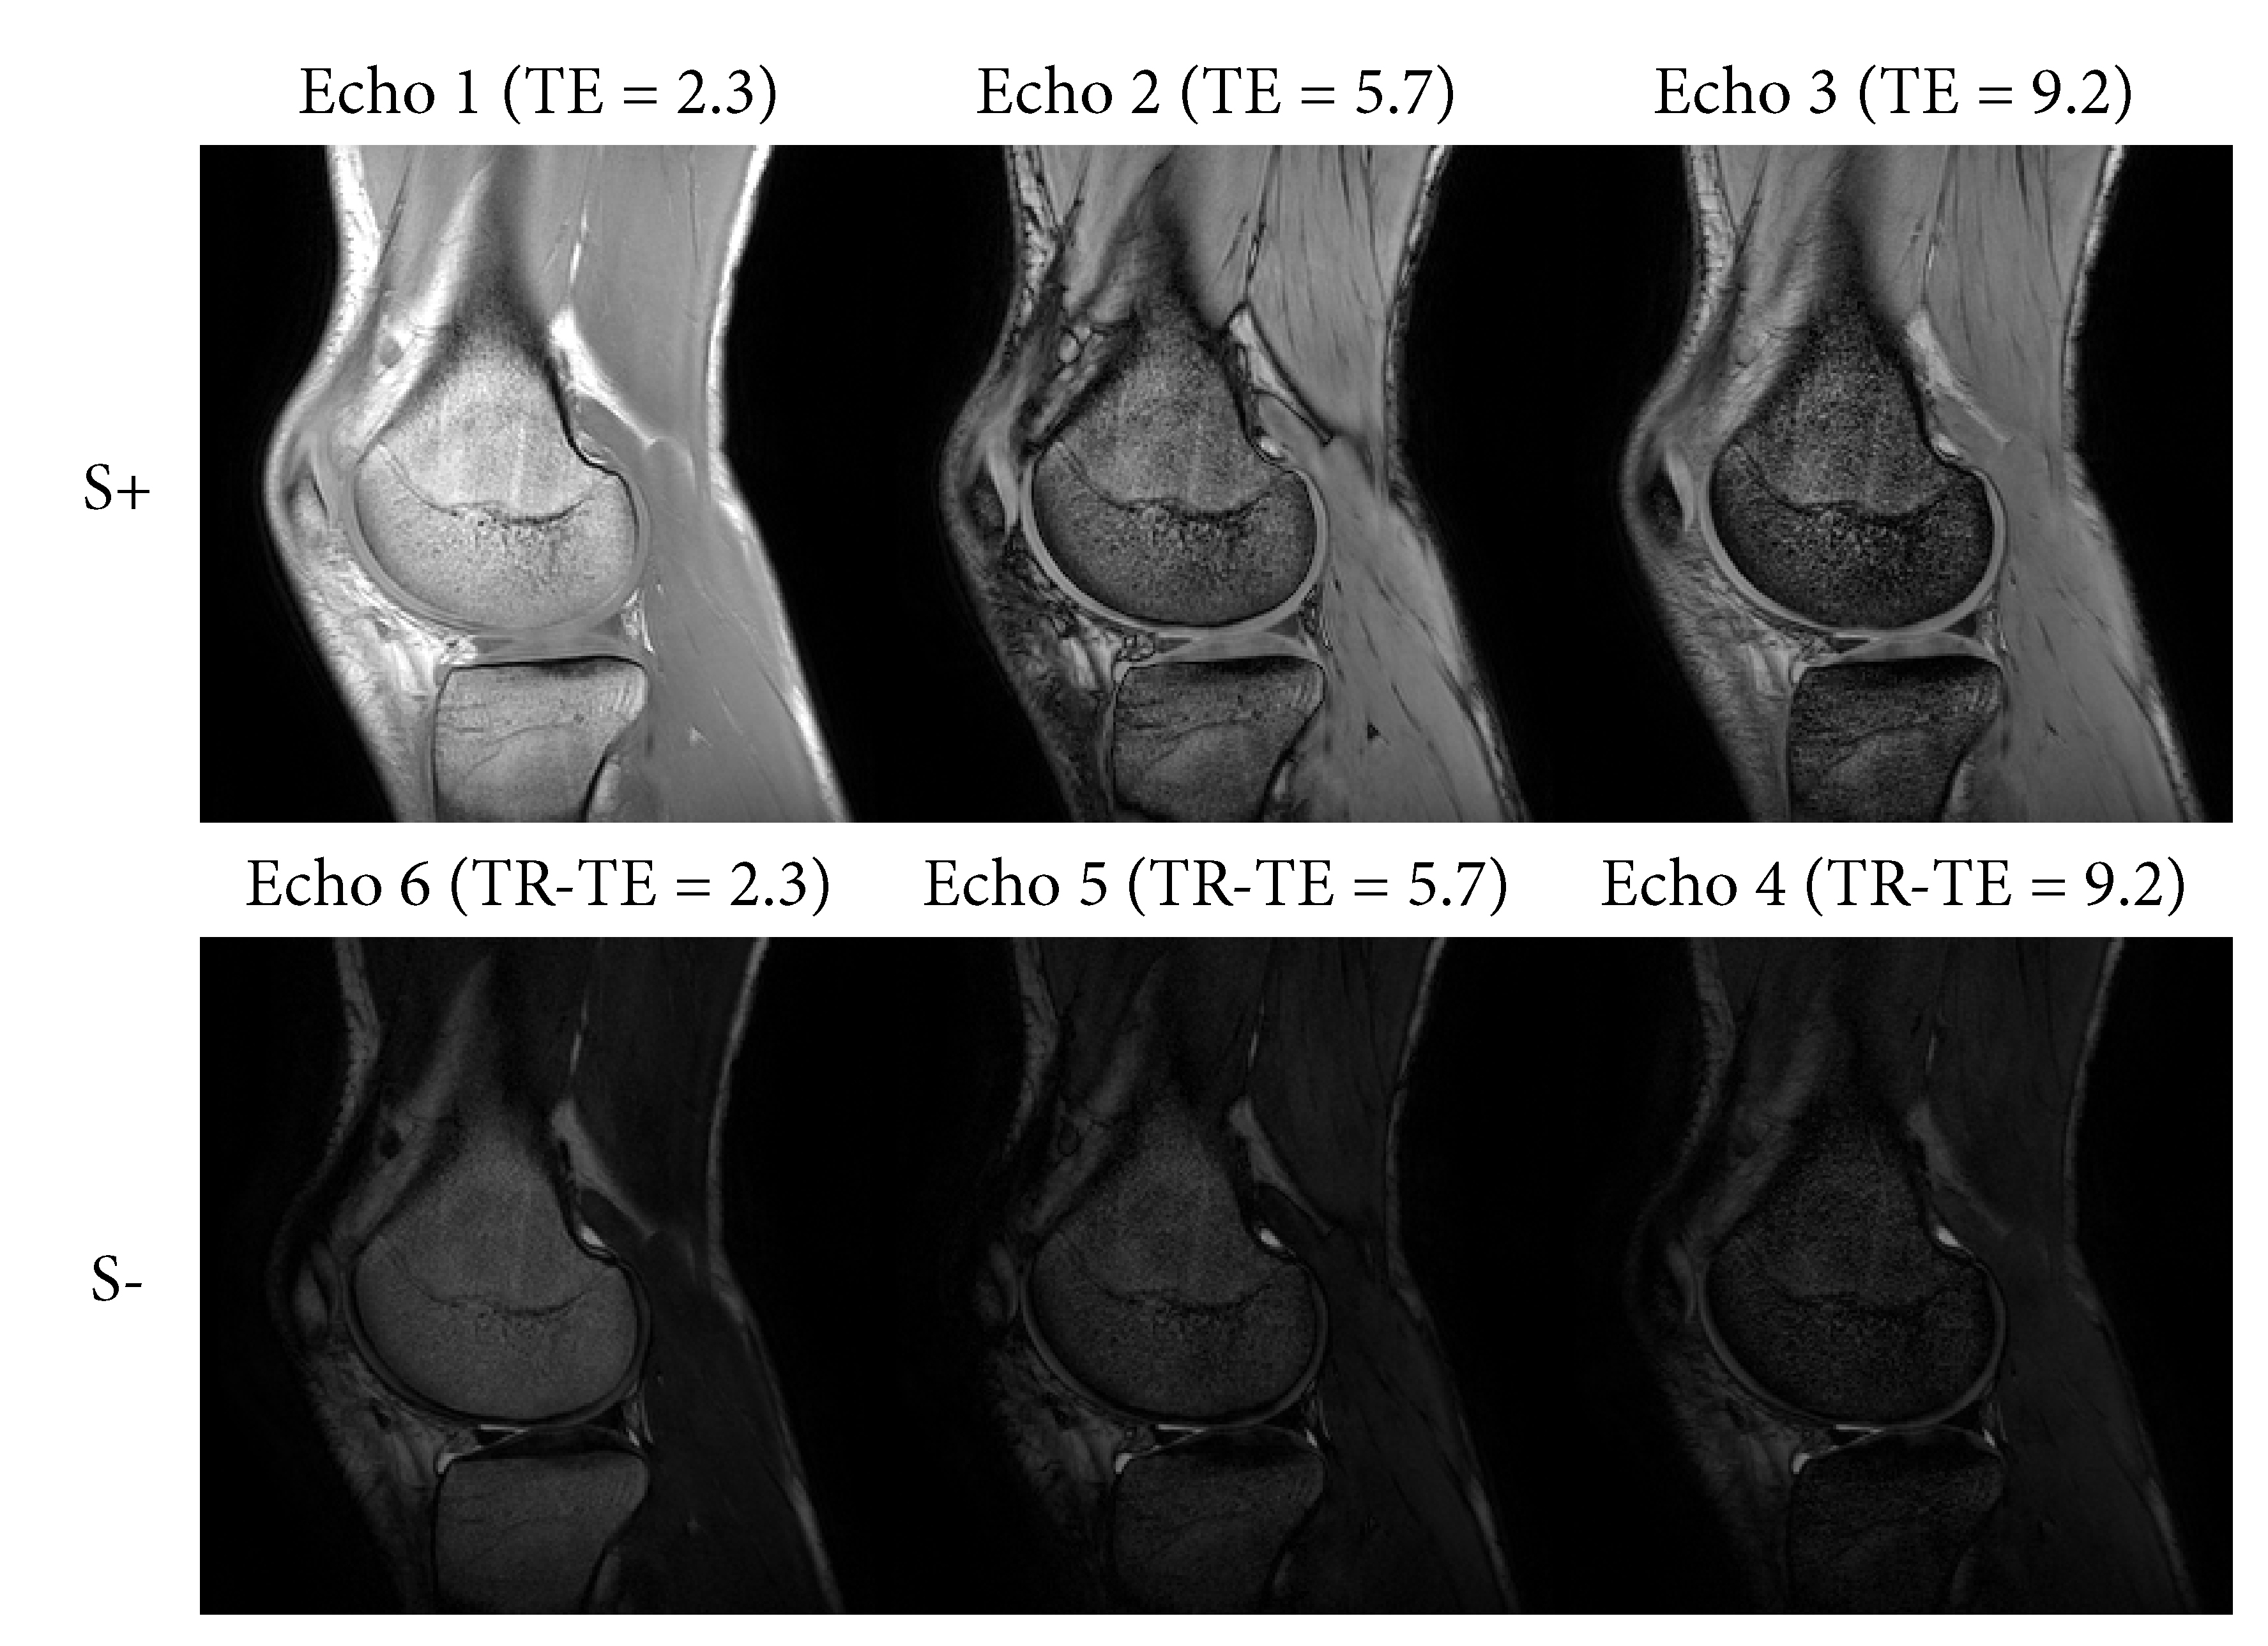
$$C(TE)=\sum_{p=1}^{P}\alpha_p e^{i2\pi f_pTE}$$ Here, $$$S_+$$$ describes the FID-like signal (echoes 1-3) and $$$S_-$$$ describes the spin echo-like signal (echoes 4-6). The function $$$C$$$ describes a multi-peak fat signal with $$$P=6$$$ peaks with amplitude $$$\alpha$$$ and frequency $$$f$$$.
Prior to fitting, a quadratic phase correction was applied, as well as an intensity correction of the $$$S_-$$$ echo to account for intensity differences caused by flip angle, repetition time and $$$T_1$$$=1200 ms. An initial estimate of $$$\Delta B_0$$$ and the phase constants is performed using a linear least-square estimation on the unwrapped phase of all 6 echoes. The parameters are then fit independently by iterating the following steps for 10 iterations:
- $$$R_2$$$ and $$$R_2^{'}$$$ fitting using non-linear conjugate gradient optimization.
- Update $$$W$$$ and $$$F$$$ using linear least-squares estimation (LSQR)
- Update $$$\Delta
B_0$$$, $$$c_+$$$, and $$$c_-$$$ using linear least-squares estimation on the
residual phase error, followed by smoothing of the $$$\Delta B_0$$$ map.
Results
Figure 2 shows the 6 echoes from the MESS acquisition, showing varying $$$T_2$$$ and $$$T_2^*$$$ contrasts and in-phase/out-of-phase effects of water and fat. These contrasts were used to fit the parameter maps shown in Figure 3.
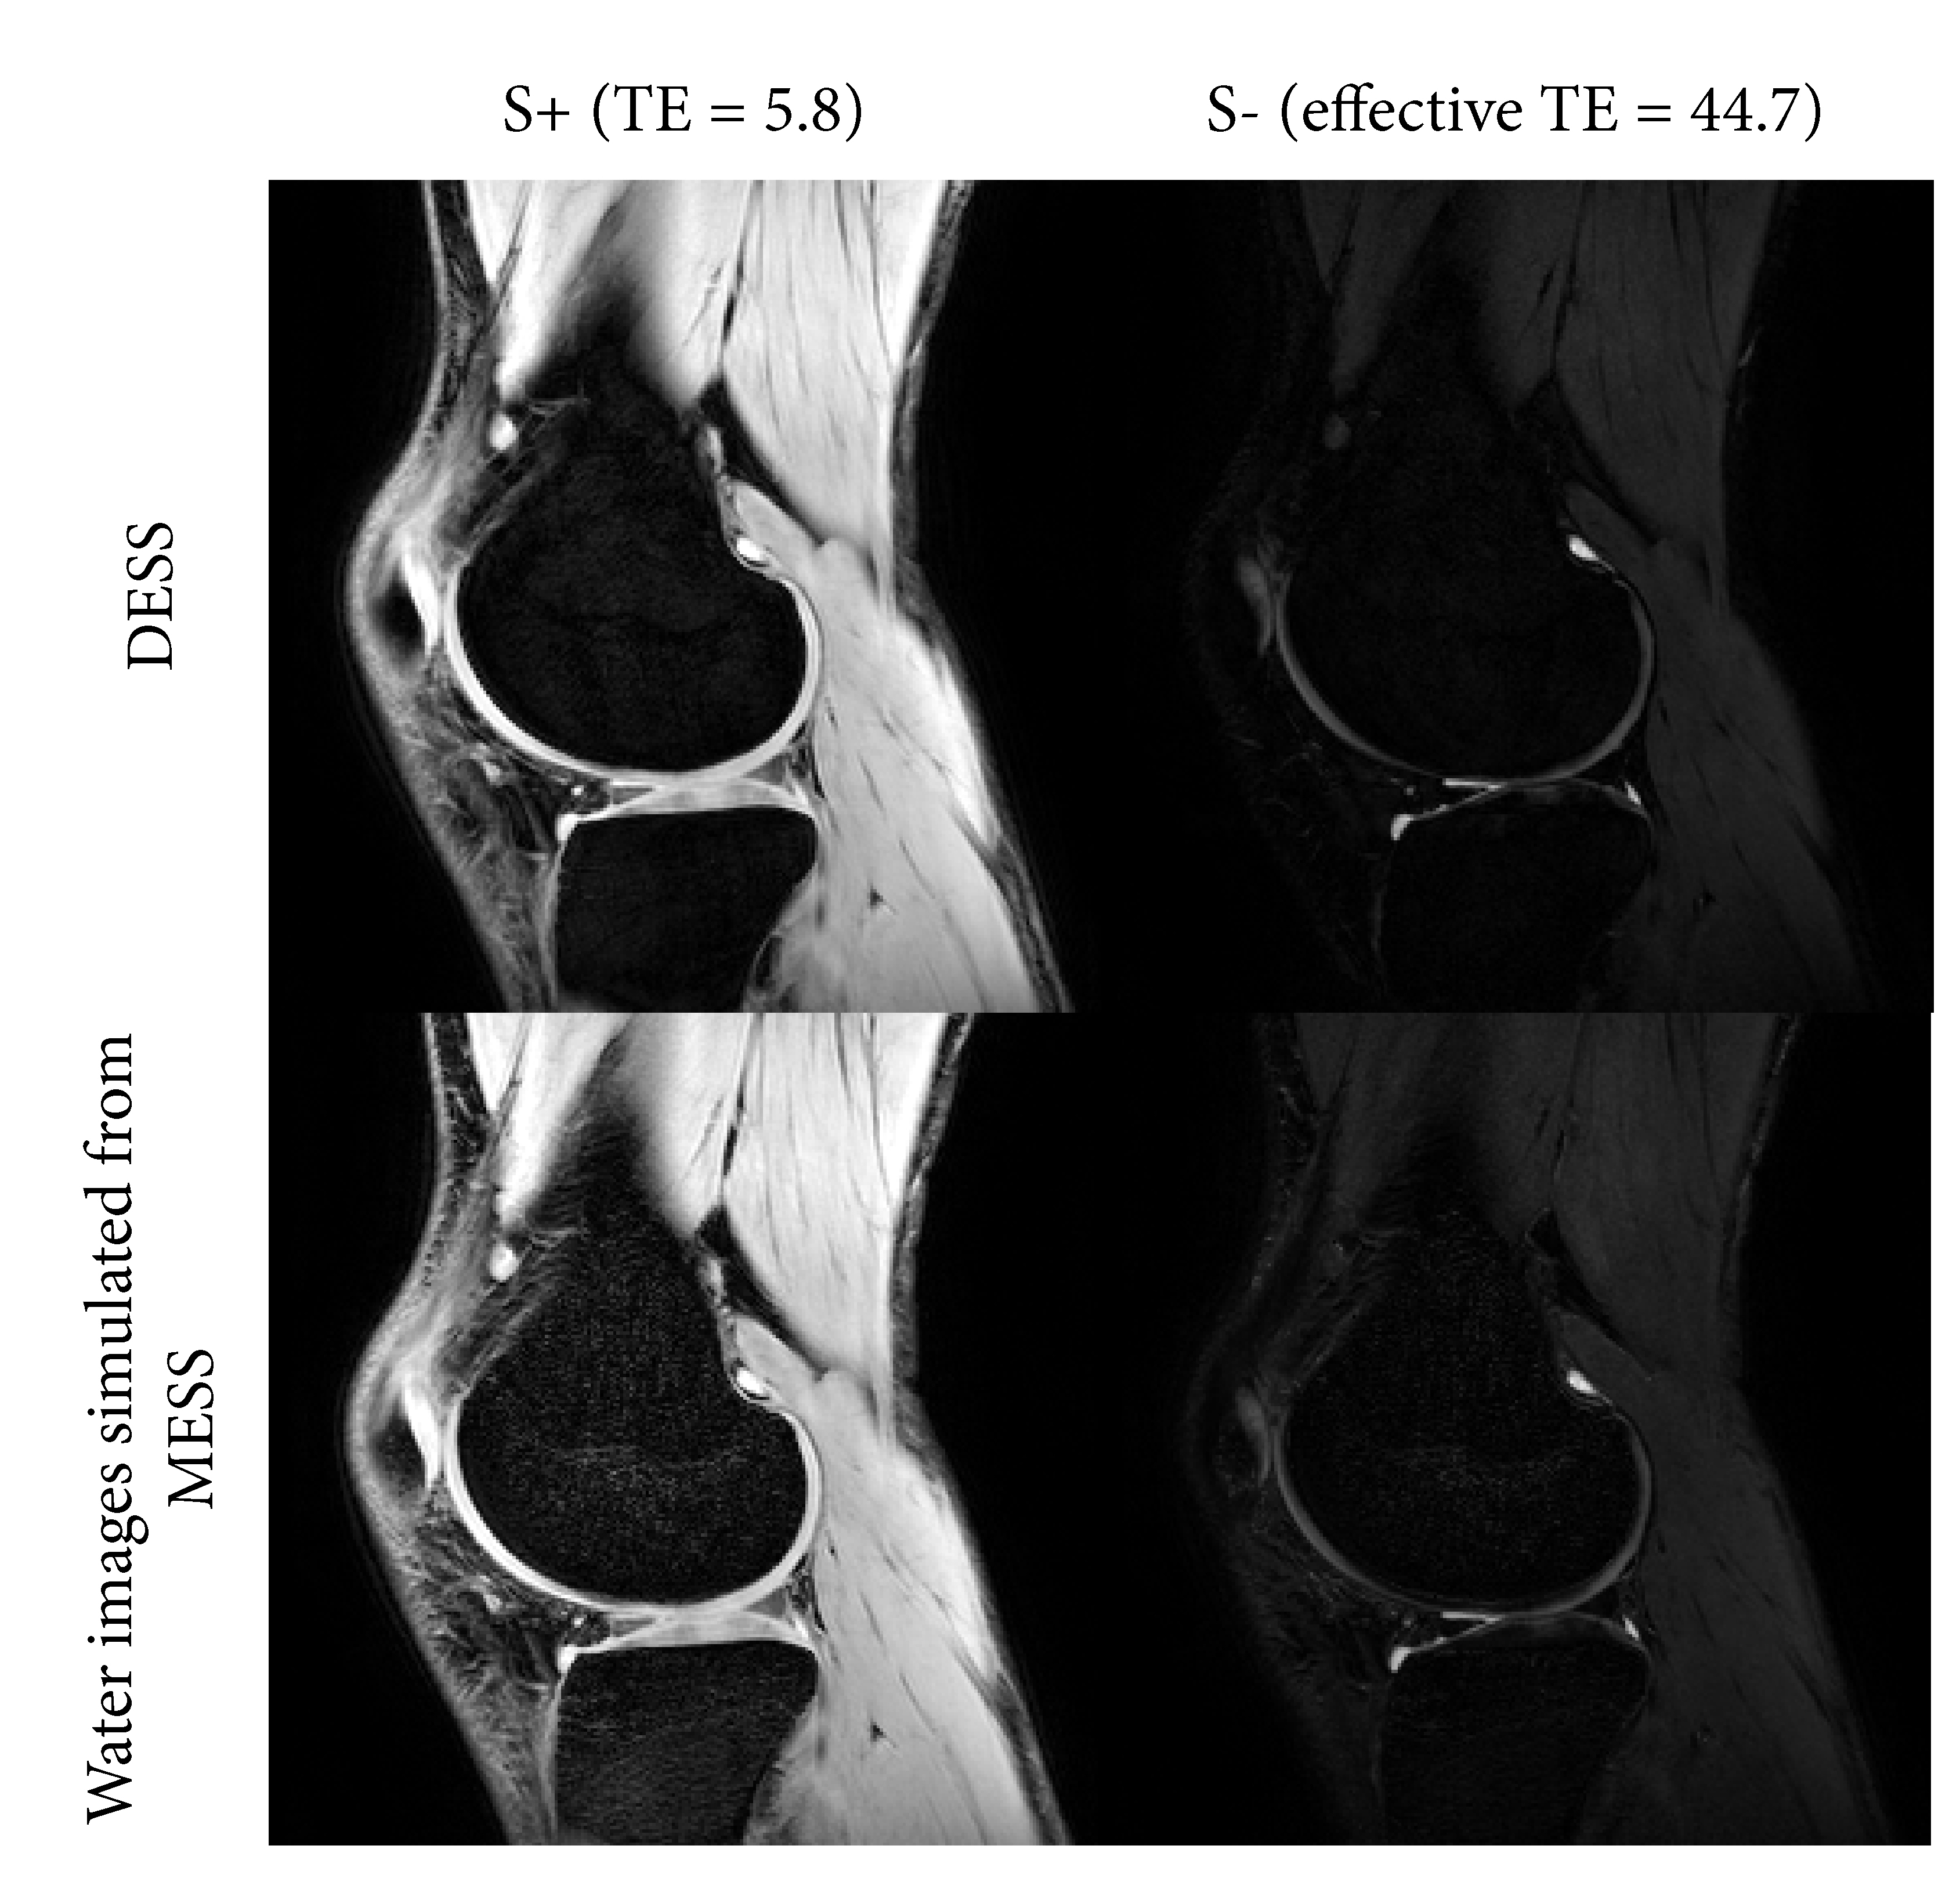
Figure 4 shows a comparison between the DESS images and the water signal from the MESS parameters simulated at the same echo times as the DESS acquisition. Figure 5 shows a comparison between DESS and MESS $$$T_2$$$ quantification. The images and $$$T_2$$$ values showed a good correspondence between DESS and MESS, with some minor differences that may be attributed to partial volume effects and imperfect water fat separation.
Discussion and conclusion
In this study we have demonstrated that the DESS sequence can be modified to read out multiple echoes and provide quantification of water, fat, $$$T_2$$$, $$$T_2^{'}$$$, and $$$T_2^*$$$, without compromising the parameters provided by the original DESS sequence. These additional parameters could provide additional morphological and tissue-specific information over DESS, potentially acting as biomarkers to characterize bone marrow, cortical bone, ligaments, and cartilage in a single acquisition for early detection and grading of OA. An advantage of MESS is that the higher readout bandwidth and non-selective excitation make it less sensitive to $$$B_0$$$-inhomogeneity and susceptibility-based distortion artefacts.
We have shown that the MESS sequence provides an efficient way to obtain quantitative measurements from multiple tissue types in the knee, which could provide valuable information for OA detection and grading. Furthermore, the scan time and efficiency of MESS could make it a valuable tool for quantitative assessment of other joints, such as the shoulder, hip, ankle, and wrist.
Acknowledgements
This work is part of the research programme Applied and Engineering Sciences (TTW) with project number 15479 which is (partly) financed by the Netherlands Organization for Scientific Research (NWO).References
1. Roemer FW, Crema MD, Trattnig S, et al. Advances in Imaging of Osteoarthritis and Cartilage. Radiology. 2011;260(2):332–354.
2. Chaudhari AS, Black MS, Eijgenraam S, et al. Five-minute knee MRI for simultaneous morphometry and T2 relaxometry of cartilage and meniscus and for semiquantitative radiological assessment using double-echo in steady-state at 3T. J. Magn. Reson. Imaging. 2018;47(5):1328–1341.
3. Wehrli FW, Song HK, Saha PK, et al. Quantitative MRI for the assessment of bone structure and function. NMR Biomed. 2006;19(7):731–764.
4. Yeung DKW, Griffith JF, Antonio GE, et al. Osteoporosis is associated with increased marrow fat content and decreased marrow fat unsaturation: A proton MR spectroscopy study. J. Magn. Reson. Imaging. 2005;22(2):279–285.
5. Kumar D, Karampinos DC, MacLeod TD, et al. Quadriceps intramuscular fat fraction rather than muscle size is associated with knee osteoarthritis. Osteoarthritis Cartilage. 2014;22(2):226–234.
6. Sveinsson B, Chaudhari AS, Gold GE, et al. A simple analytic method for estimating T2 in the knee from DESS. Magn. Reson. Imaging. 2017;38:63–70.
Figures