1317
Quantitative hip cartilage MRI of patients with hip dysplasia: Evaluation of dGEMRIC, T1ρ and T2* mapping1Medical Imaging, The Ottawa Hospital, Ottawa, ON, Canada, 2Radiology, University of Ottawa, Ottawa, ON, Canada, 3Division of Orthopaedic Surgery, The Ottawa Hospital, Ottawa, ON, Canada, 4Medicine, University of Ottawa, Ottawa, ON, Canada
Synopsis
Developmental dysplasia of the hip is a common risk factor of early osteoarthritis. Knowledge of the molecular health of cartilage using quantitative MR methods could diagnose and stage the disease and may also allow for treatment stratification. In this study, we evaluated and compared three different biochemical sensitive MR methods (dGEMRIC, T1ρ and T2*) for cartilage imaging on patients with developmental dysplasia of the hip. Quantitative T1ρ as well as T2* mapping of the hip cartilage correlated significantly with the dGEMRIC method and could possibly replace the contrast-based method.
Introduction
Developmental dysplasia of the hip (DDH) is a common risk factor of early osteoarthritis (OA), with insufficient coverage of the femoral head by the acetabulum which leads to excessive cartilage stresses in the hip joint1. Knowledge of the molecular health of cartilage through quantitative MR methods may diagnose and stage chondral disease, but more importantly allows for treatment stratification and prognostication. Delayed gadolinium-enhanced magnetic resonance imaging of cartilage (dGEMRIC) is a validated MRI technique for detecting early loss of proteoglycan (PG)2. However it requires an injection of contrast agent and exercise prior to the MRI scan. Newer MRI techniques such as T1ρ and T2* mapping have also been shown to be sensitive to early biochemical changes in cartilage, but can be performed without any contrast injection3. In this study we evaluate three quantitative MR techniques (dGEMRIC, T1ρ and T2* mapping) in patients with DDH. Our hypothesis is that both T1ρ and T2* correlate with dGEMRIC, and thus may be effective non-contrast based techniques for biochemical cartilage mapping in DDH hips.Methods
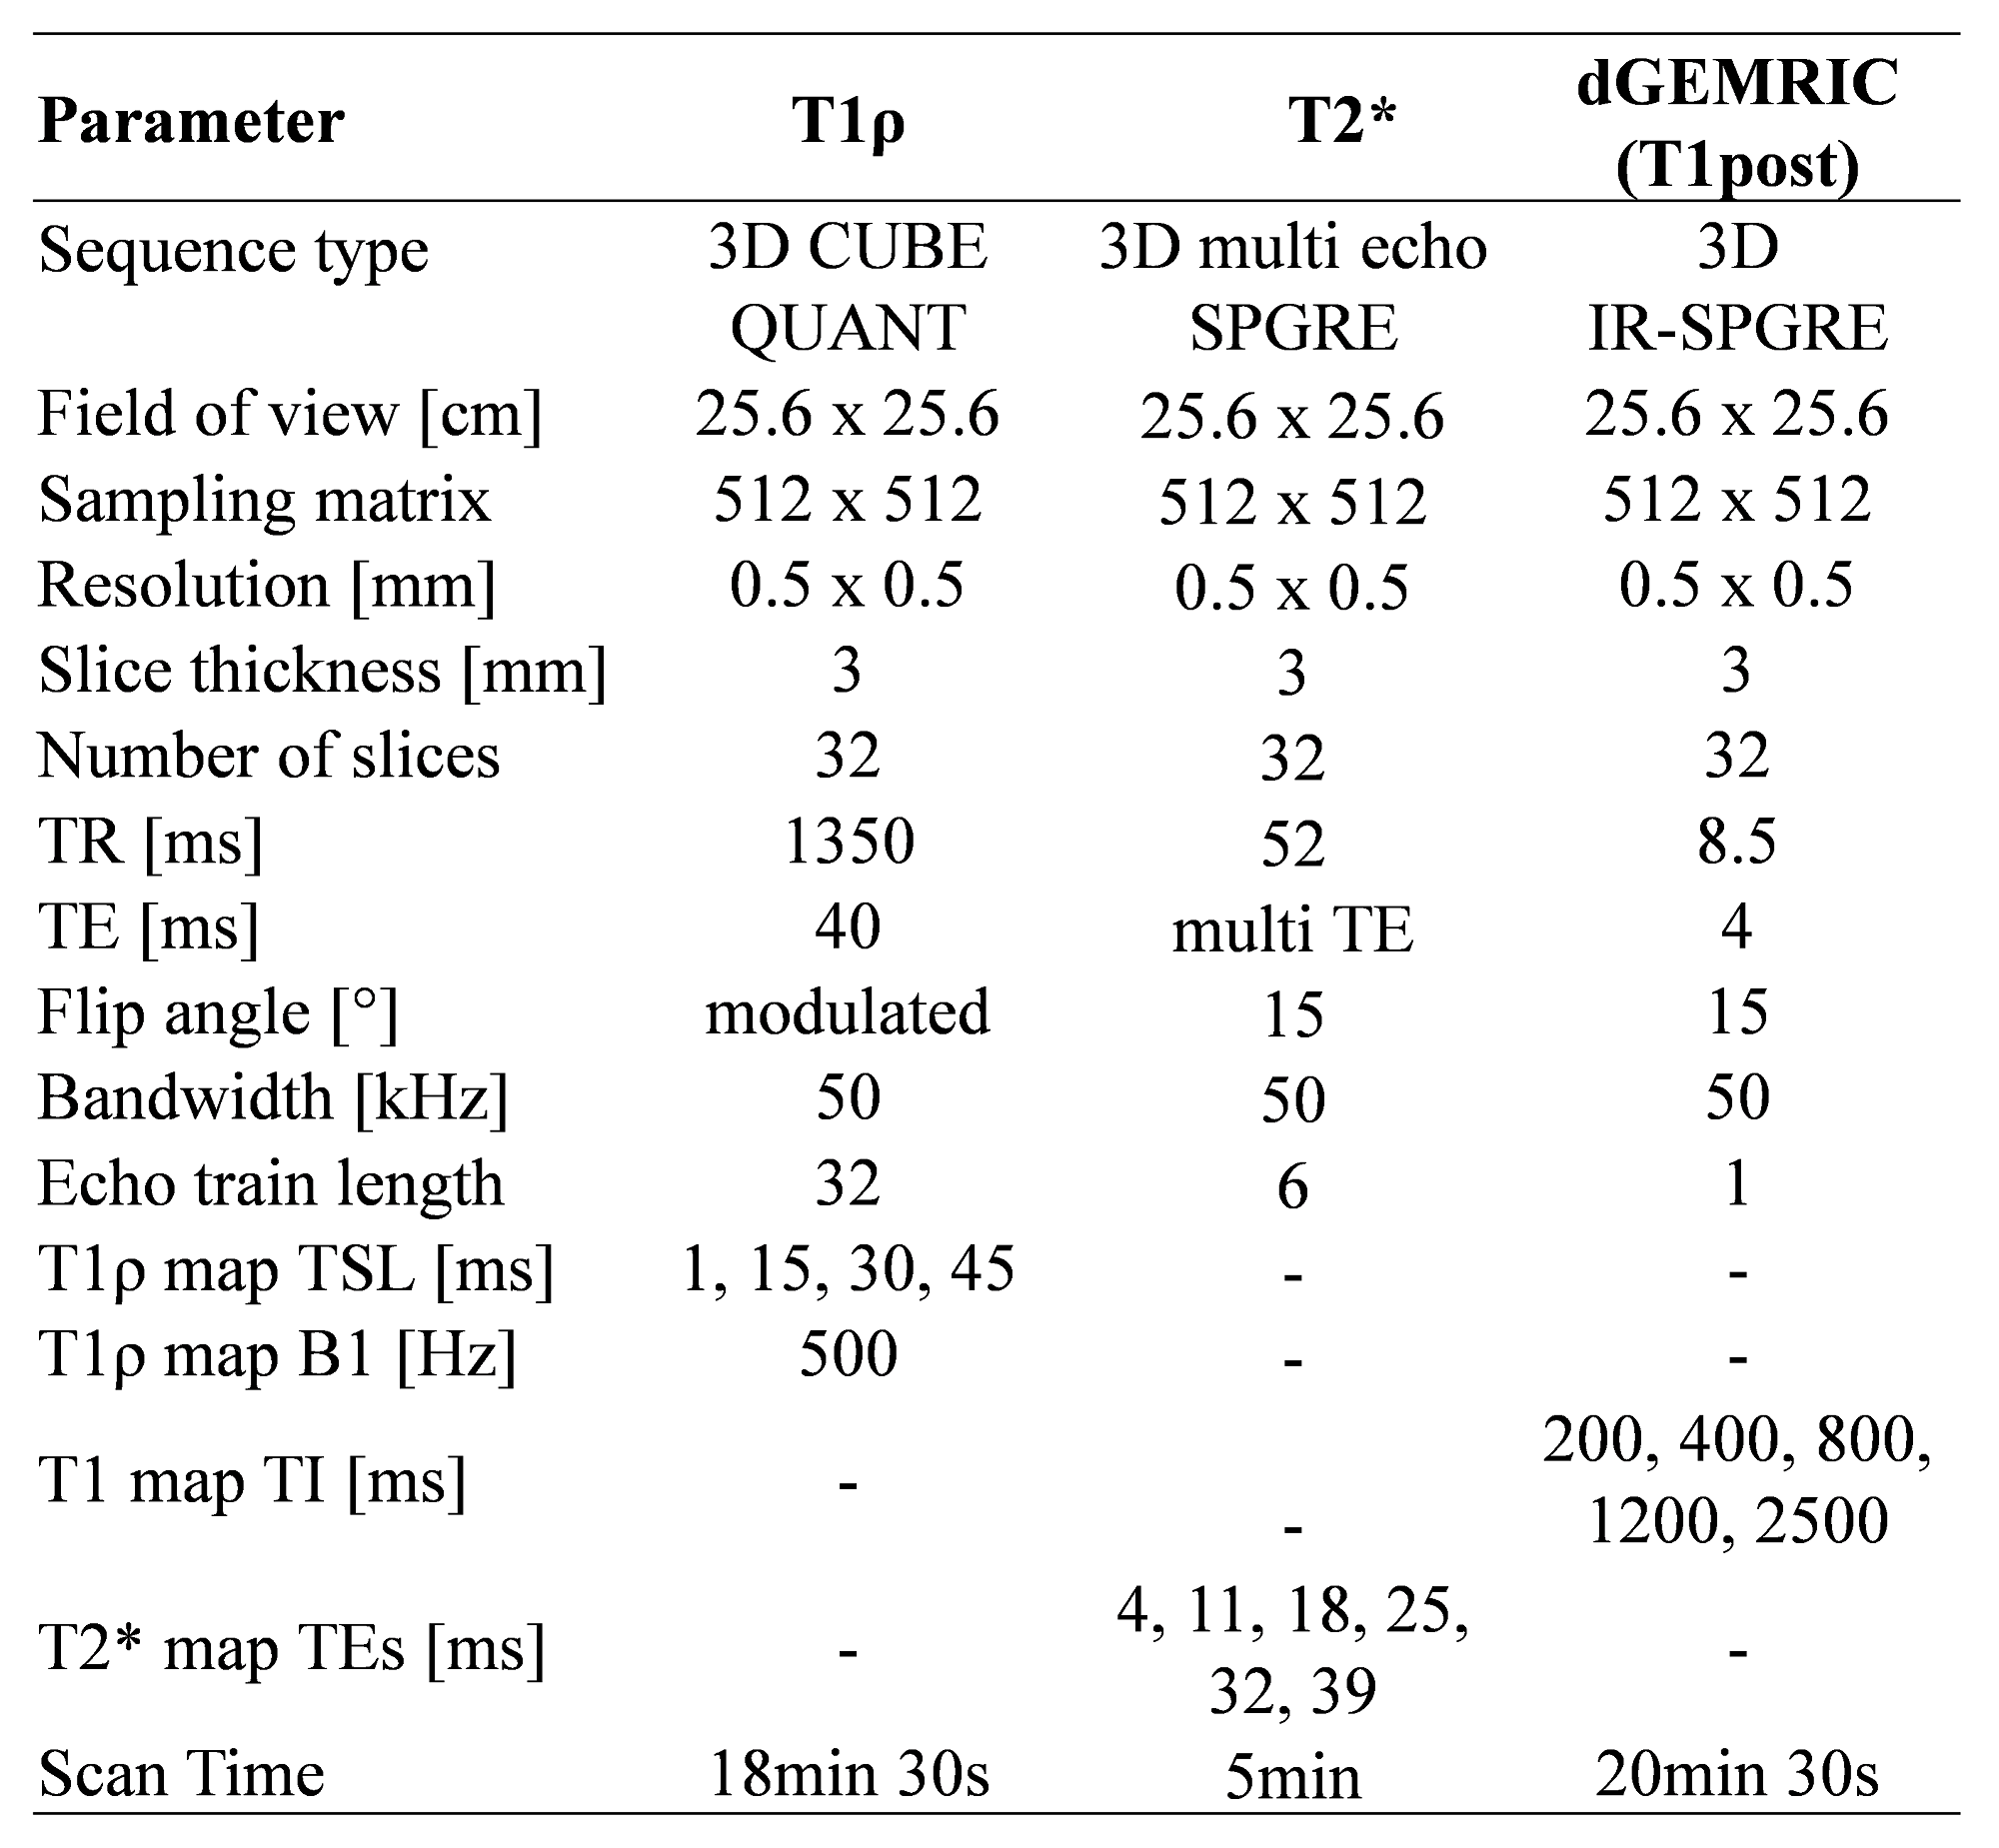
Seven patients (mean age: 31.1 years, age range: 19.2-51.1 years) with DDH were recruited for this MRI study before surgery. DDH was defined as a lateral center-edge angle under 25º and acetabular index >13º on the plain x-ray4. The study was approved by the local research ethics board and all study individuals were informed and consented. MRI was performed at 3T (Discovery MR750W, General Electric) using T1ρ, T2* and dGEMRIC (T1post) mapping sequences (Table 1). The subjects underwent two MRI sessions: In the first T1ρ and T2* mapping were performed. After leaving the scanner they were injected with 0.4ml/kg Dotarem (i.v.), walked for 15min and rested for 25min before returning back into the MRI. dGEMRIC mapping was initiated approximately 45min after the injection. All datasets were co-registered using a rigid registration approach implemented in Matlab. The cartilage was segmented as a bilayer on six to seven slices, starting from the lateral sourcil margin and extending medially. The joint was subdivided into anterior and posterior regions in the sagittal plane and into lateral, intermediate and medial zones in the transverse plane, resulting in six region of interest (ROIs): Antero-Lateral, Antero-Intermediate, Antero-Medial, Postero-Lateral, Postero-Intermediate and Postero-Medial. The correlation between the dGEMRIC and T1ρ and dGEMRIC and T2* were evaluated using Spearman’s Rho and tested for significance.Results
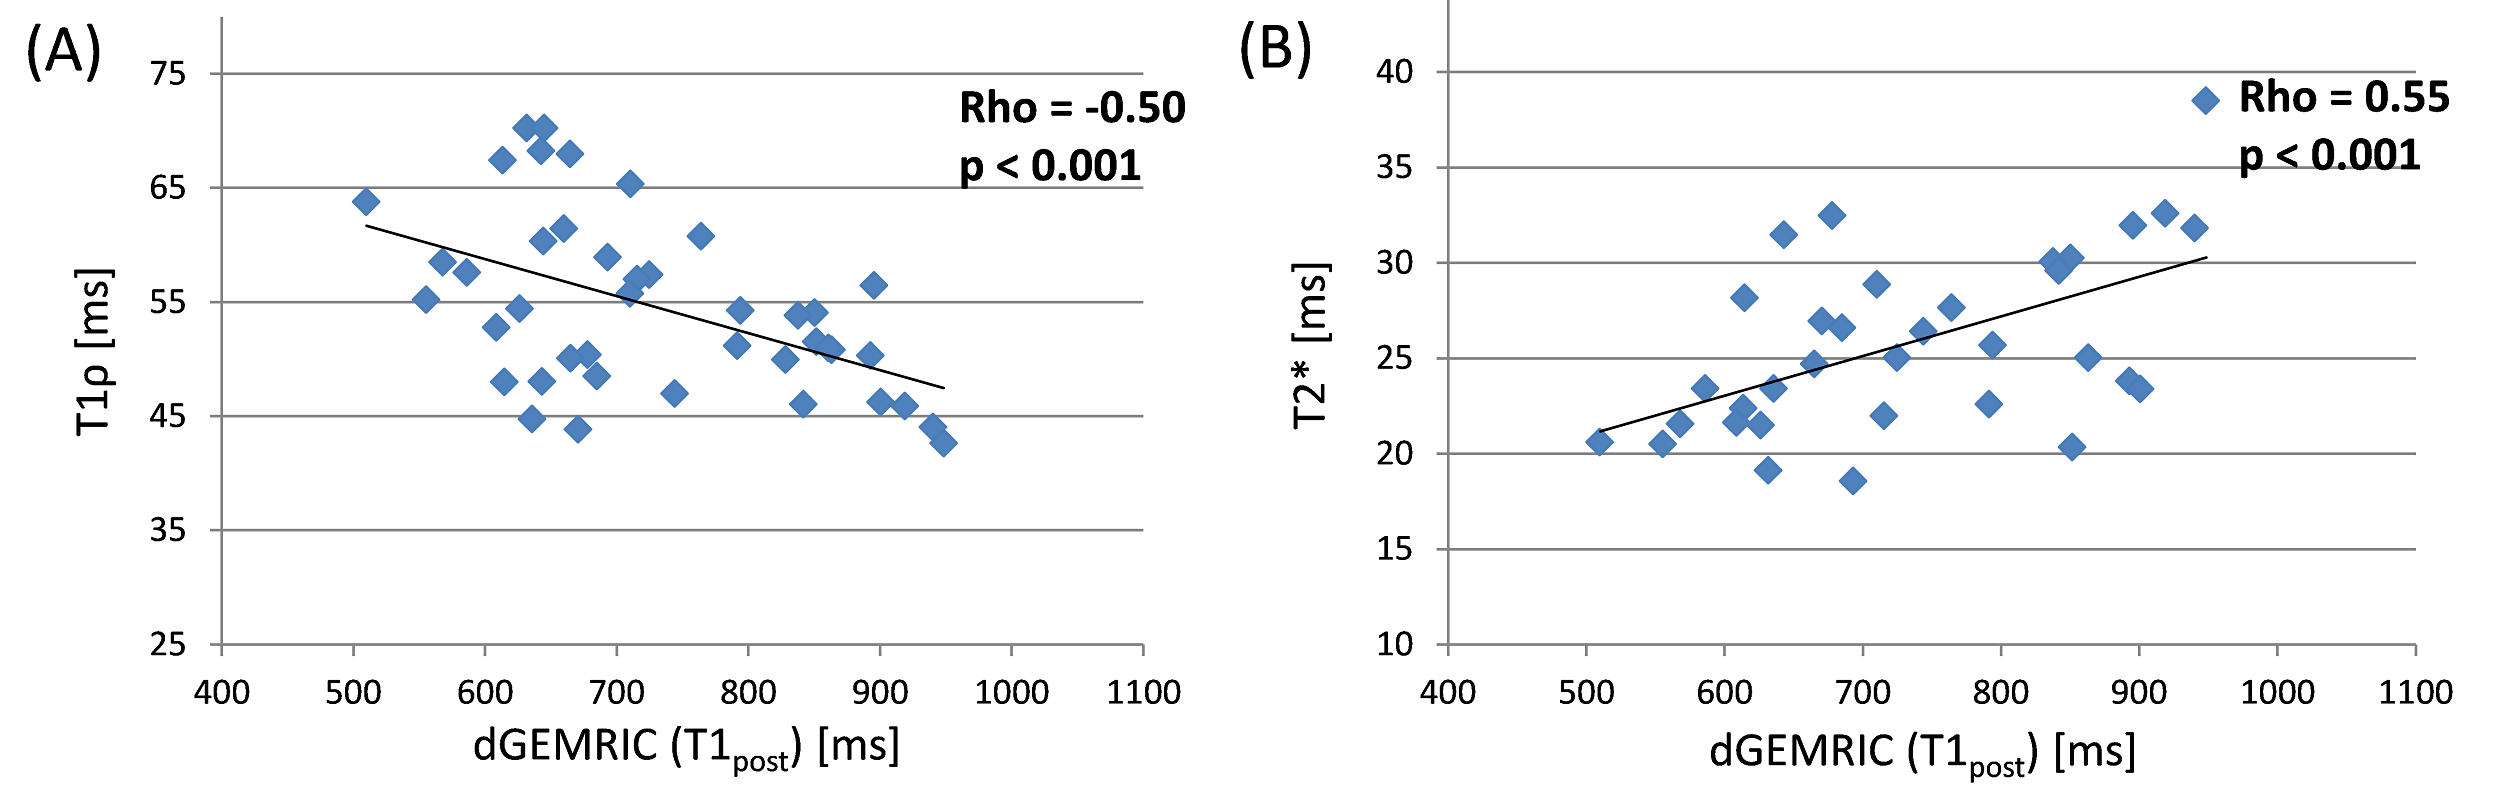
The quantitative analysis of all six ROIs for all subjects resulted in a significant (p<0.001) negative correlation (Rho = -0.50) between the dGEMRIC index of the cartilage and the T1ρ relaxation time. The correlation between dGEMRIC and T2* was positive (Rho = 0.55) and significant (p<0.001) (Figure 1). Figure 2 shows representative cartilage relaxation time maps of one DDH patient. The color-coded maps show qualitatively higher T1ρ values in regions where the dGEMERIC index (T1post) is decreased. The T2* map reveals lower T2* values in cartilage regions with decreased T1post relaxation time.Discussion
Although this pilot study has a small sample size, a negative correlation between dGEMRIC and T1ρ was found in patients with DDH. Both methods are known to probe the PG content of cartilage, where a decreased PG content leads to lower dGEMRIC index and an increased T1ρ value. The correlation coefficient was moderate, but significant, which shows that T1ρ mapping as an effective tool to probe the cartilage PG content similar to dGEMRIC. A comparable, but positive correlation was found between dGEMRIC and T2*. T2* is sensitive to the cartilage collagen content with a decreased T2* value in degenerated cartilage. In symptomatic DDH, where an onset of OA is assumed, both PG depletion and collagen decay are in progress and can be evaluated using these mapping techniques.Conclusion
T1ρ and T2* mapping, are non-contrast techniques that can used to assess the biochemical status of the hip cartilage in patients with DDH, and possibly replace the contrast based dGEMRIC method.Acknowledgements
The Ottawa Hospital Academic Medical Organization (TOHAMO) for funding of the study.References
[1] Bellamy N, Buchanan WW, Goldsmith CH, et al. Validation study of WOMAC: a health status instrument for measuring clinically important patient relevant outcomes to antirheumatic drug therapy in patients with osteoarthritis of the hip or knee. J Rheumatol, 1988; 15:1833-40.
[2] Bashir A, Gary ML, Boutin RD, et al. Glycosaminoglycan in articular cartilage: in vivo assessment with delayed Gd(DTPA)(2-)-enhanced MR imaging. Radiology. 1997; 205: 551-8.
[3] Bittersohl B, Hosalkar HS, Hesper T, et al. Advanced Imaging in Femoroacetabular Impingement: Current State and Future Prospects. Front Surg. 2015;2:34.
[4] Wilkin GP, Ibrahim MM, Smit KM, et al. A Contemporary Definition of Hip Dysplasia and Structural Instability: Toward a Comprehensive Classification for Acetabular Dysplasia. J Arthroplasty. 2017 Sep;32(9S):S20-S27.
Figures