1316
Cartilage T2 Mapping of the Knee Using Fast Spin-Echo Multi-Band Acceleration1Radiology, University of Wisconsin, Madison, WI, United States, 2Applied Science Laboratory, GE Healthcare, Waukesha, WI, United States
Synopsis
A T2 mapping sequence was performed in the axial and sagittal planes with multi-band (MB) acceleration (T2-MB) and without MB acceleration (T2) on the knees of seven healthy volunteers and three subjects with knee osteoarthritis at 3.0T. The use of MB acceleration provided a 50% reduction in scan time. The T2 and T2-MB sequences showed very similar pixel-by-pixel patellar cartilage T2 values in the axial plane and very similar regional knee joint cartilage T2 values in the sagittal plane for all subjects. However, there was a slight bias toward lower cartilage T2 values when using MB acceleration.
Introduction
Two-dimensional fast spin-echo (2D-FSE) based T2 mapping sequences are now commercially available on most MRI vendor platforms. These techniques have been shown to improve the sensitivity for detecting cartilage lesions within the knee joint when compared to conventional 2D-FSE sequences1. However, widespread use of T2 mapping sequences in clinical practice is currently limited by long scan times needed for complete knee joint coverage. Recently developed multi-band (MB) acceleration techniques have shown the ability to reduce scan time by simultaneously exciting, acquiring, and reconstructing multiple image slices2. This study was performed to compare a T2 mapping sequence with and without MB acceleration for measuring T2 relaxation time of the articular cartilage of the knee joint at 3.0T.Methods
A 2D FSE based T2 mapping sequence was performed with MB acceleration (T2-MB) and without MB acceleration (T2) on the knees of seven healthy volunteers and three subjects with knee osteoarthritis (OA) using a 3.0T scanner (MR750, GE Healthcare, Waukesha, WI) and eight-channel phase-array extremity coil. All scans were performed in the axial and sagittal planes with complete knee joint coverage using a 1000ms TR, TEs of 9, 18, 27, 36, 44, 53, 62, and 71ms, 16cm field of view, 256 x 160 matrix, 3mm slice thickness, 32kHz bandwidth, and phase and slice acceleration factors of 1. For MB acceleration, the excitation and refocusing radiofrequency pulses were modulated for multi-slice selection. Slice shifting using an auxiliary z-phase encoding pulse was employed to improve the geometry factor. Resampled slice data from a prior 2D multi-slice gradient-echo calibration scan was used to estimate coil sensitivities. Image reconstruction was performed with a derivative of the product parallel imaging software using a one-dimensional (1D) un-aliasing approach2,3. MB acceleration reduced scan time from 10:49min to 5:24min for the sagittal scans with 32 image slices and from 5:24min to 2:42min for the axial scans with 16 image slices. The T2 and MB-T2 sequences were also performed on 2%, 3%, and 4% Agar gel phantoms (Phantom Lab, Greenwich, NY) five separate times on different days. T2 maps of the articular cartilage of the human knee joint and Agar gel phantoms were created using a standardized exponential fitting algorithm. The axial T2 maps of patellar cartilage obtained using the T2 and T2-MB sequences were registered to one another using MATLAB image registration software (MathWorks, Natick, MA). Pearson correlation coefficients and Bland-Altman plots were used for pixel-by-pixel comparisons of patellar cartilage T2 values. The articular cartilage of the knee joint on eight cartilage subsections were segmented on the sagittal T2 maps obtained using the T2 and T2-MB sequences. Paired t-tests were used to compare the mean cartilage T2 values on the eight cartilage subsections and the mean T2 values of the Agar gel phantoms.Results
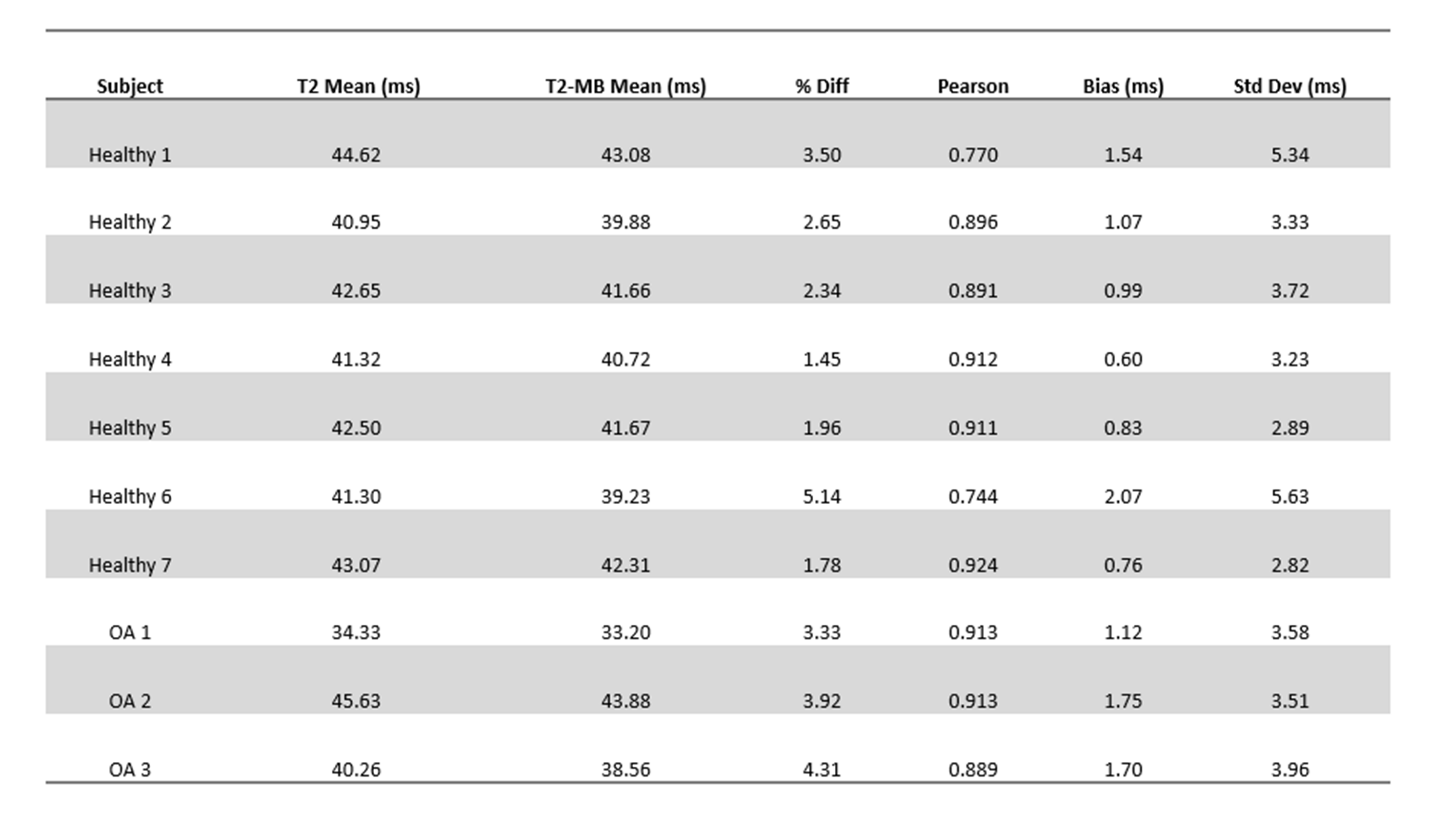
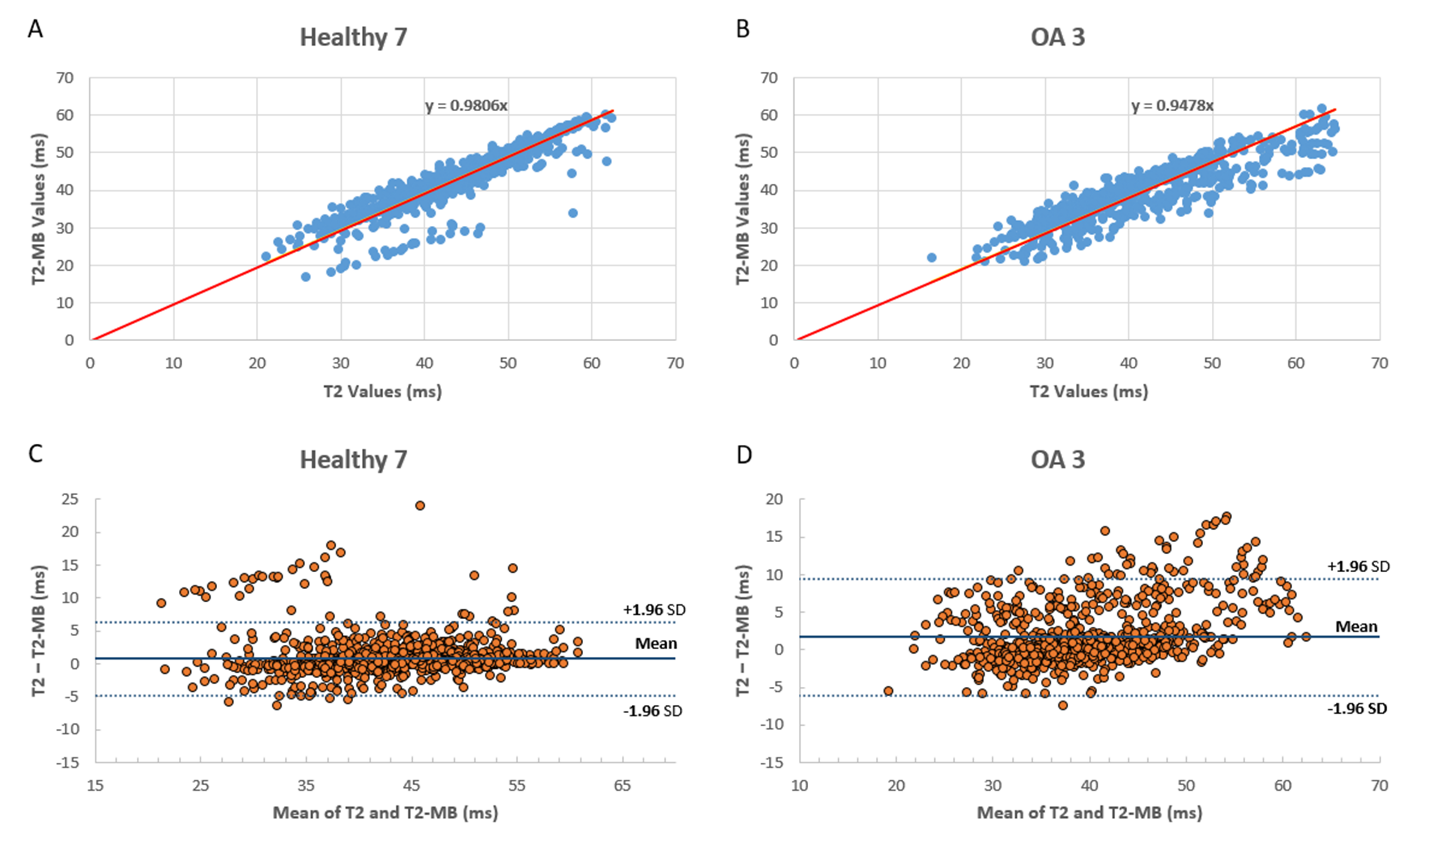
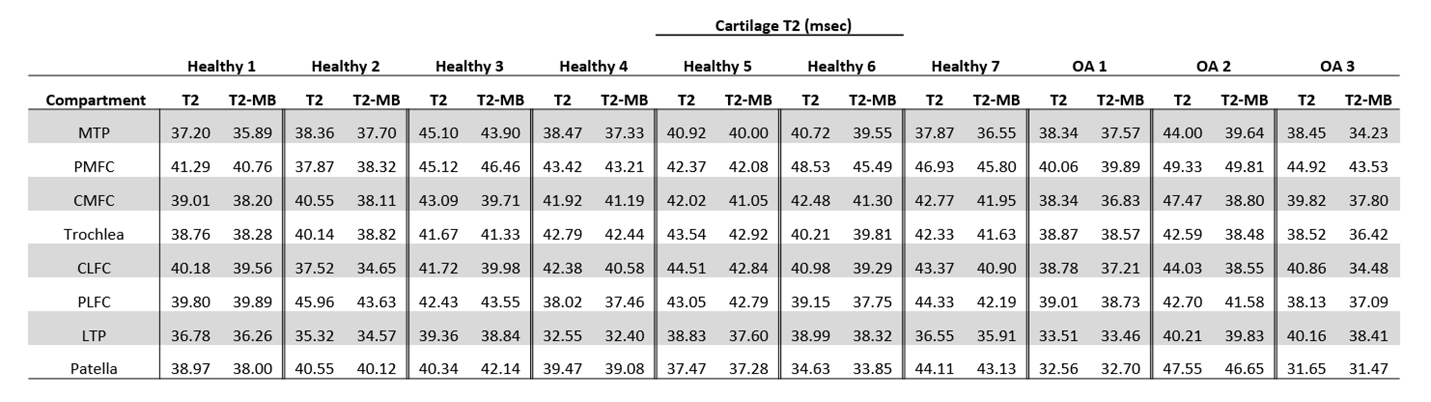
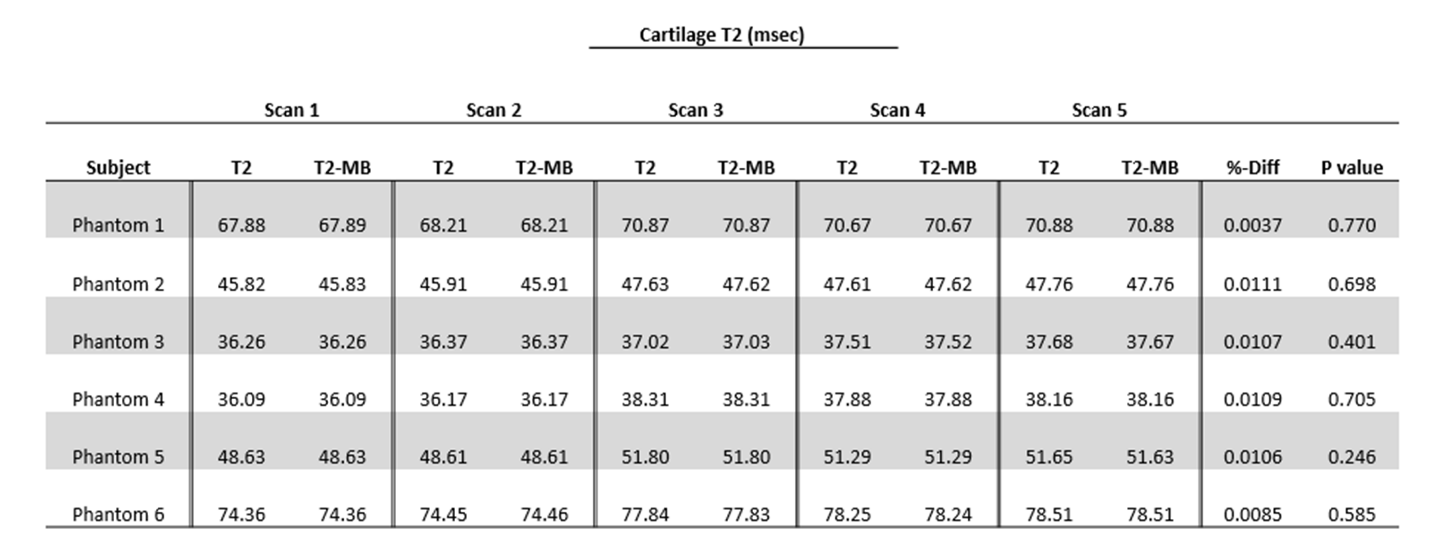
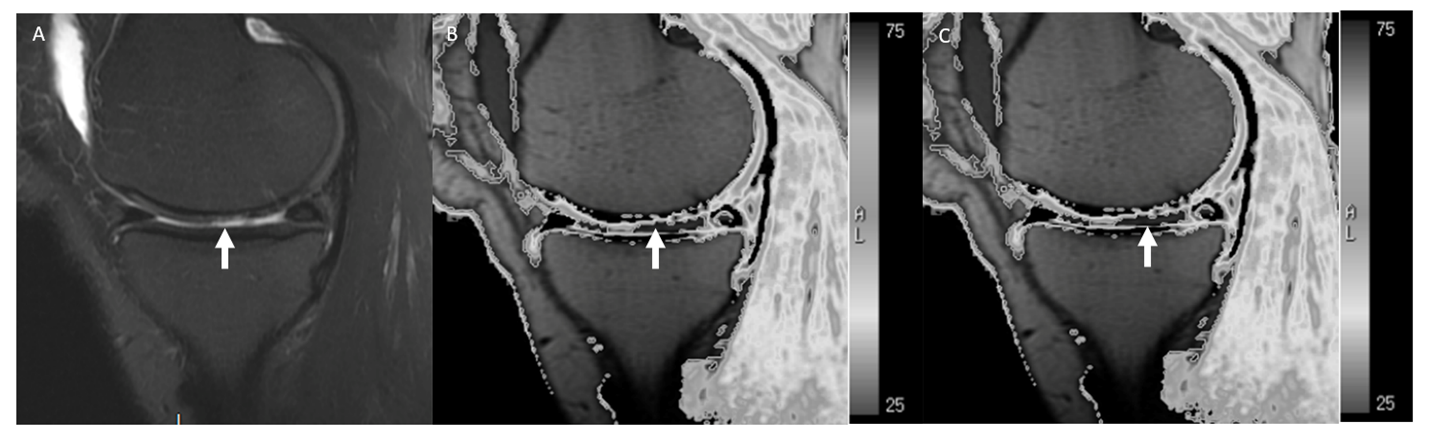
There was high pixel-by-pixel correlation between patellar cartilage T2 values obtained using the T2 and T2-MB sequences with Pearson correlation coefficients ranging between 0.744 and 0.924. However, Bland-Altman analysis showed a slight bias of patellar cartilage T2 values with slightly higher cartilage T2 values for the T2 sequence than the T2-MB sequence (Figures 1 and 2). Mean cartilage T2 values for the eight cartilage subsections of the knee joint were very close to one another with percent differences ranging between 1.68% for the patella and 6.64% for the central lateral femoral condyle. However, the mean cartilage T2 values were significantly higher (p<0.010) for the T2 sequence than the T2-MB sequence for all cartilage subsections (Figure 3). Mean T2 values of the Agar gel phantoms were almost identical to one another with no significant differences (p=0.246-0.770) between the T2 and T2-MB sequences for all five scans and percent differences ranging between 0.0037% and 0.011%. Normal cartilage in healthy volunteers and cartilage lesions in subjects with knee OA appeared identical on the T2 maps obtained using the T2 and T2-MB sequences (Figure 5).Conclusion
The use of MB acceleration of a 2D FSE based T2 mapping sequence provided a 50% reduction in scan time. The T2 and T2-MB sequences showed almost identical T2 values of Agar gel phantoms and very similar pixel-by-pixel and regional cartilage T2 values within the knee joint in healthy volunteers and subjects with knee OA. However, there was a slight bias toward lower cartilage T2 values when using MB acceleration. Our results clearly show that MB acceleration can reduce scan time while providing accurate T2 relaxation time measurements of the articular cartilage of the knee joint at 3.0T which would allow for more widespread use of cartilage T2 mapping in clinical practice.Acknowledgements
Research support provided by GE Healthcare and NIAMS grant R01-AR068373.References
(1) Kijowski R, et al. Evaluation of the articular cartilage of the knee joint: Value of adding a T2 mapping sequence to a routine MRI protocol”. Radiology. 267:503-513, 2013.
(2) Barth M, et al. “Simultaneous multi-slice (SMS) imaging techniques”. Magnetic Resonance in Medicine. 75:63-81, 2016.
(3) Setsompop K, et al. “Blipped controlled aliasing in parallel imaging for simultaneous multi-slice echo planar imaging with reduced g-factor penalty”. Magnetic Resonance in Medicine. 67:1210-1224, 2012.
Figures