1315
UTE-based adiabatic T1ρ is sensitive to enzymatic proteoglygan degradation in human articular cartilage1Department of Radiology, UC San Diego, San Diego, CA, United States, 2Department of Radiology, Shanghai Tenth People's Hospital of Tongji University, Shanghai, China, 3Radiology Service, VA San Diego Healthcare System, San Diego, CA, United States, 4Orthopaedic Surgery Service, VA San Diego Healthcare System, San Diego, CA, United States
Synopsis
A series of quantitative UTE techniques have been developed to assess articular cartilage. The early stage of osteoarthritis is characterized by proteoglycan (PG) loss in cartilage. This study aimed to determine if quantitative UTE-based biomarkers are sensitive to PG loss induced by chondroitinase ABC in cadaveric human cartilage. Pure cartilage wafers were exposed to sequential enzymatic digestion. MR imaging was performed before and after sequential digestion. PG loss was observed after digestion, with a corresponding increase in UTE adiabatic T1ρ values as compared to controls.
Introduction
The onset of osteoarthritis (OA) is primarily associated with biochemical alterations, and proteoglycan (PG) loss in articular cartilage has been hypothesized as an initiating factor (1,2). Noninvasive detection of PG depletion by MR imaging would help early stage diagnosis (3,4), making timely treatment of the disease while it is still reversible a clinical possibility. Articular cartilage, especially the deep radial and calcified layers, contains a significant amount of short T2 components (< 10 milliseconds), where the signal decays so fast that little or no signal can be detected with conventional MR sequences (5). Previous studies have shown that conventional MRI techniques, including T1-, T2-, and magnetization transfer (MT)-weighted imaging, are inconclusive in detecting early stage changes in OA (6,7). 3D ultrashort echo time (UTE) Cones MRI sequences, with TEs on the order of microseconds, allow for direct volumetric imaging and quantitative assessment of cartilage, including the deep radial and calcified layers. This study aimed to determine if quantitative 3D UTE-Cones-based biomarkers are sensitive to PG loss induced by enzyme in human cartilage and also aimed to discuss the implications of detecting OA at early stages.Methods
Sample preparation: 16 osteochondral cores were harvested from one cadaveric specimen (31-year-old male donor) and the osseous components were removed using a scalpel. The cartilage wafers were soaked in buffer solution (50 mM Tris, 60 mM sodium acetate, and 0.02% bovine serum albumin, pH 8.0) for one hour before baseline MR scan.
MR sequences: All imaging was performed on a 3T clinical MRI scanner (MR750, GE Healthcare Technologies, Milwaukee, WI, USA) using a homemade 30 ml birdcage coil. The following four imaging protocols were performed: A) 3D UTE-Cones magnetization transfer (3D UTE-Cones-MT) with three saturation pulse powers (q = 400°, 600°, and 800°) and five frequency offsets (Df = 2, 5, 10, 20, and 50 kHz) (8); B) 3D UTE-cones with actual flip angle imaging and variable flip angles (3D UTE-Cones AFI-VFA) with flip angles (FA) of 5°, 10°, 20°, and 30°, and a TR of 20 ms (9); C) 3D UTE-Cones with adiabatic T1ρ preparation (3D UTE-Cones-AdiabT1ρ) with spin-locking time (TSL) of 0, 12, 24, 36, 48, 72, and 96 ms (10); D) 3D UTE-T2* with TEs of 0.032, 4.1, 8.1, 12.1, 16.1, and 32 ms. Other imaging parameters included: FOV = 5 cm, matrix=160×160, slice thickness=0.5mm, 60 slices. The total scan time was 78 min.
Enzymatic digestion and histology: Samples (n=8) were incubated at 37 ℃ for 44 hours in a 2 ml 0.1U/ml solution of chondroitinase ABC (C3667, Sigma-Aldrich, St. Louis, MO) and buffer solution, in order to induce proteoglycan loss. The controls (n=8) were immersed at 37 ℃ for 44 hours in just buffer solution. Buffer and enzyme solution were changed after 22 hours. At the end of the digestion, samples were rinsed in buffer solution for 30 minutes. After MR imaging, cartilage wafers were fixed in 10% zinc formalin, paraffin-embedded, and sectioned. Safrain-O and fast green stains were used for PG detection.
Data analysis: Three consecutive slices at the center of each wafer were used for global region of interest (ROI) analysis. T1, AdiabT1ρ, MT modeling of macromolecular fraction, and T2* values were calculated for all cartilage samples, before and after enzymatic digestion using previously reported methods (11). Pixel maps were also obtained. Two-sided paired t test was used for statistical analysis.
Results
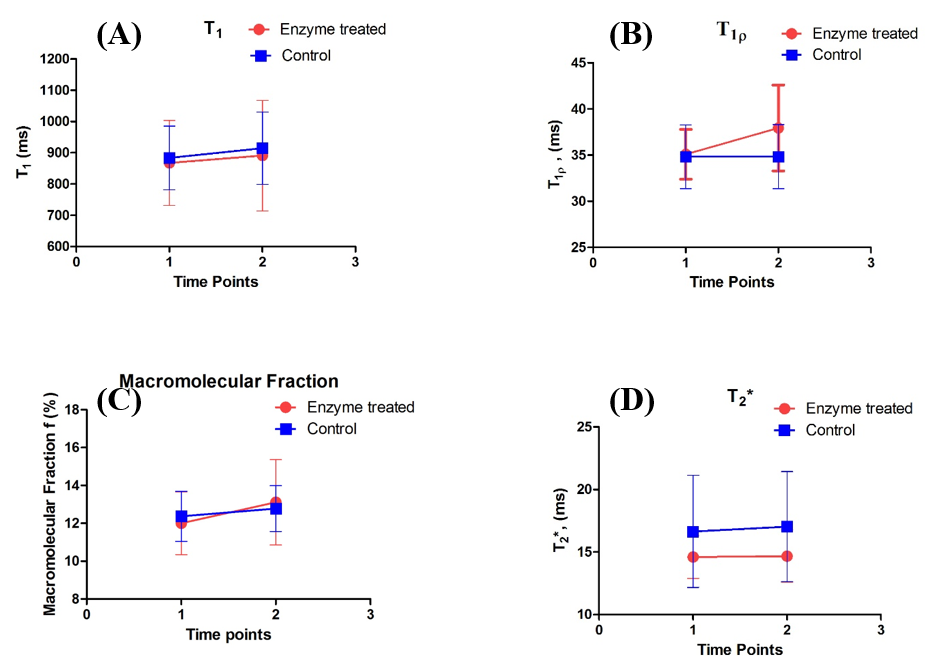
Figures 1 and 2 show the estimated T1, adiabT1ρ, macromolecular fraction, and T2* values before and after incubation. Although increases in T1, macromolecular fraction, and T2* were observed, the differences were non-significant (p>0.05). However, adiabT1ρ significantly increased in enzyme-treated samples after digestion (p=0.01).
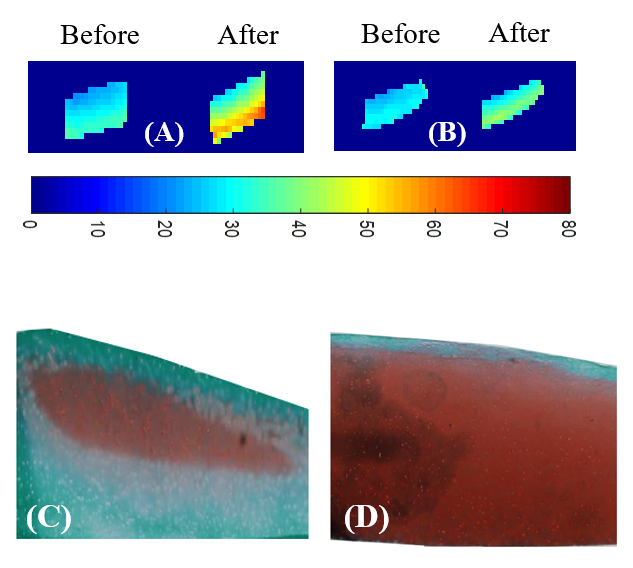
Figure 3 shows representative pixel maps and corresponding histology. The enzyme-treated sample demonstrated increased adiabT1ρ values after digestion, and PG loss was confirmed by decreased Safrain-O staining.
Discussion
In our study, we found that adiabT1ρ relaxation, as measured with the 3D UTE-Cones-AdiabT1ρ sequence, was most sensitive for assessing enzyme-induced PG loss. Increasing trends were seen with the other measures, but did not reach statistical significance.
Using a FSE readout at 9.4T, Nissi et al. did not observe significant changes in adiabT1ρ after chondroitinase ABC treatment (11). Our results suggest that the 3D UTE-Cones-AdiabT1ρ sequence, with its advantage of detecting short T2 components, may be used to detect PG loss on a clinical scanner.
Conclusion
PG loss in cartilage was observed after digestion, with a corresponding increase in UTE adiabaticT1ρ values. T1ρ relaxation as measured with the 3D UTE-Cones-AdiabT1ρ sequence has potential for detecting PG loss in articular cartilage, thus facilitating the diagnosis of OA at early stages.Acknowledgements
The authors acknowledge grant support from VA Clinical Science and Rehabilitation R&D Awards (I01CX001388 and I01RX002604) and NIH (R01AR062581).References
1. Bashir A, Gray ML, Burstein D. Gd-DTPA2- as a measure of cartilage degradation. Magnetic resonance in medicine 1996;36(5):665-673.
2. Taylor C, Carballido-Gamio J, Majumdar S, Li X. Comparison of quantitative imaging of cartilage for osteoarthritis: T2, T1rho, dGEMRIC and contrast-enhanced computed tomography. Magn Reson Imaging 2009;27(6):779-784.
3. Chu CR, Williams AA, Coyle CH, Bowers ME. Early diagnosis to enable early treatment of pre-osteoarthritis. Arthritis research & therapy 2012;14(3):212.
4. Duvvuri U, Reddy R, Patel SD, Kaufman JH, Kneeland JB, Leigh JS. T1rho-relaxation in articular cartilage: effects of enzymatic degradation. Magnetic resonance in medicine 1997;38(6):863-867.
5. Robson MD, Gatehouse PD, Bydder M, Bydder GM. Magnetic resonance: an introduction to ultrashort TE (UTE) imaging. Journal of computer assisted tomography 2003;27(6):825-846.
6. Bacic G, Liu KJ, Goda F, Hoopes PJ, Rosen GM, Swartz HM. MRI contrast enhanced study of cartilage proteoglycan degradation in the rabbit knee. Magnetic resonance in medicine 1997;37(5):764-768.
7. Gray ML, Burstein D, Lesperance LM, Gehrke L. Magnetization transfer in cartilage and its constituent macromolecules. Magnetic resonance in medicine 1995;34(3):319-325.
8. Springer F, Martirosian P, Machann J, Schwenzer NF, Claussen CD, Schick F. Magnetization transfer contrast imaging in bovine and human cortical bone applying an ultrashort echo time sequence at 3 Tesla. Magnetic resonance in medicine 2009;61(5):1040-1048.
9. Ma YJ, Lu X, Carl M, Zhu Y, Szeverenyi NM, Bydder GM, Chang EY, Du J. Accurate T1 mapping of short T2 tissues using a three-dimensional ultrashort echo time cones actual flip angle imaging-variable repetition time (3D UTE-Cones AFI-VTR) method. Magnetic resonance in medicine 2018;80(2):598-608. 10. Ma YJ, Carl M, Shao H, Tadros AS, Chang EY, Du J. Three-dimensional ultrashort echo time cones T1rho (3D UTE-cones-T1rho ) imaging. 2017;30(6).
11. Nissi MJ, Salo EN, Tiitu V, Liimatainen T, Michaeli S, Mangia S, Ellermann J, Nieminen MT. Multi-parametric MRI characterization of enzymatically degraded articular cartilage. Journal of orthopaedic research : official publication of the Orthopaedic Research Society 2016;34(7):1111-1120.
Figures