1313
Assessment of the Angular Dependence of 3D Ultrashort Echo Time Cones Adiabatic T1ρ (3D UTE-Cones-AdiabT1ρ) Imaging1Department of Radiology, University of California, San Diego, San Diego, CA, United States, 2Department of Radiology, Guangzhou First People’s Hospital, School of Medicine, South China University of Technology, Guangzhou, China, 3Radiology Service, VA San Diego Healthcare System, San Diego, CA, United States
Synopsis
In this study we aimed to evaluate the magic angle sensitivity of the 3D UTE-Cones-AdiabT1ρ sequence in imaging the cadaveric human Achilles tendon and patellar cartilage samples on a clinical 3T scanner. The 3D UTE-Cones-AdiabT1ρ shows much reduced magic angle effect than regular T1ρ and T2*. The superficial layers show reduced magic angle effect compared to the middle and deep layers of articular cartilage. The 3D UTE-Cones-AdiabT1ρ sequence may provide magic angle insensitive evaluation of all the major knee joint tissues, thus providing a truly “whole-organ” approach for more accurate diagnosis of early OA.
Introduction
Spin lattice relaxation in the rotating frame (T1ρ) has been investigated extensively as a way to detect biochemical changes such as proteoglycan depletion in articular cartilage (1-3). However, T1ρ has shown a strong magic angle effect, with a more than 100% increase when the collagen fibers are reoriented from 0° to 54° relative to the B0 field (4-6). This increase can be far more than that caused by degeneration, therefore complicating diagnosis and treatment monitoring. Adiabatic T1rho has been proposed as an alternative approach to reduce the magic angle effect (7, 8). Meanwhile, the 3D ultrashort echo time (UTE) Cones sequence has been proposed for fast volumetric imaging of both short and long T2 tissues in the knee joint. The combination of 3D UTE Cones sequence with adiabatic T1ρ (3D UTE-Cones-AdiabT1ρ) may allow more robust T1ρ mapping of all major tissues in the knee joint (9,10). In this study we aimed to evaluate the magic angle sensitivity of the 3D UTE-Cones-AdiabT1ρ sequence in imaging the cadaveric human Achilles tendon and patellar cartilage samples on a clinical 3T scanner.Method
The 3D UTE-Cones-AdiabT1ρ sequence employs an even number (NIR) of adiabatic inversion recovery (IR) pulses followed by regular UTE-Cones imaging, where a short rectangular pulse excitation is followed by Cones sampling. Following the AdiabT1ρ preparation, fast Cones data acquisition is performed using Nsp separate k-space spokes with an equal time interval. The spin lock time (TSL) is defined as the total duration of the train of adiabatic IR pulses, i.e. TSL=NIR×Tp (Tp is duration of a single adiabatic pulse). Accurate T1 measurement is crucial for T1ρ calculation. 3D UTE-Cones actual flip angle imaging (AFI) was used for mapping of B1 inhomogeneity, which, together with a variable flip angle (VFA) method (3D UTE-Cones AFI-VFA), was used for accurate T1 mapping (11,12). Typical imaging parameters included a field of view (FOV) of 5 cm, slice thickness of 0.4 mm, and receiver bandwidth of 105 kHz. Other sequence parameters were: 1) UTE-Cones-AFI (11): TR1/TR2=20/100 ms, flip angle (FA)=45°, acquisition matrix=192×192×40, scan time=9 min 50 sec; 2) UTE-Cones-VFA (12): TR=20 ms, FA=4°,7°,10°,15°, 20°, 25°, and 30°; matrix=192×192×80, scan time=30 min 20 sec; 3) UTE-Cones-AdiabT1ρ (10): TR=1000 ms, FA=8°, matrix=192×192×80, Nsp=15, NIR=0,2,4,6,8,12 and 16 each with a scan time of 14 min 40 sec; 4) UTE-Cones-T1ρ (10): TR=1000ms, FA=8°, matrix=192×192×80, Nsp=15, TSL=0,5,10,15, and 20ms, each with a scan time of 14 min 40 sec; 5) UTE-Cones-T2*: TR=80 ms, FA=15°, matrix=192×192×80, fat saturation, one set of TEs (0,4.4,8.8,13.2,22,35.2ms) with a scan time of 11 min 8 sec. The imaging protocol was applied to the Achilles tendon (n=5) and patellar cartilage (n=3) samples five times, each with a different orientation (0°, 30°, 55°, 70°/75°, and 90° relative to B0). Global ROI was used for the Achilles tendon, and regional analysis (10% superficial, 60% middle, 30% deep, and a global ROI) was applied for the patellar cartilage. Single-component model was applied to fit T1, T1ρ, AdiabT1ρ and T2*, and their angular dependence were analyzed.Results and Discussion
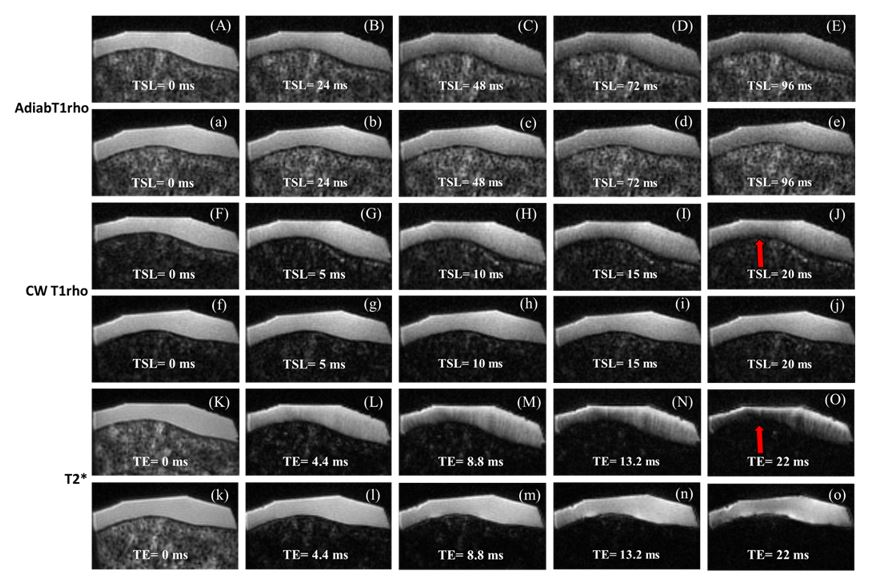
Figure 1 shows representative images from 3D UTE-Cones-AdiabT1ρ imaging, regular UTE-Cones-T1ρ imaging, and UTE-Cones-T2* imaging of the same patellar sample oriented parallel and 55° relative to the B0 field. More dramatic signal decay was observed for the latter two sequences.
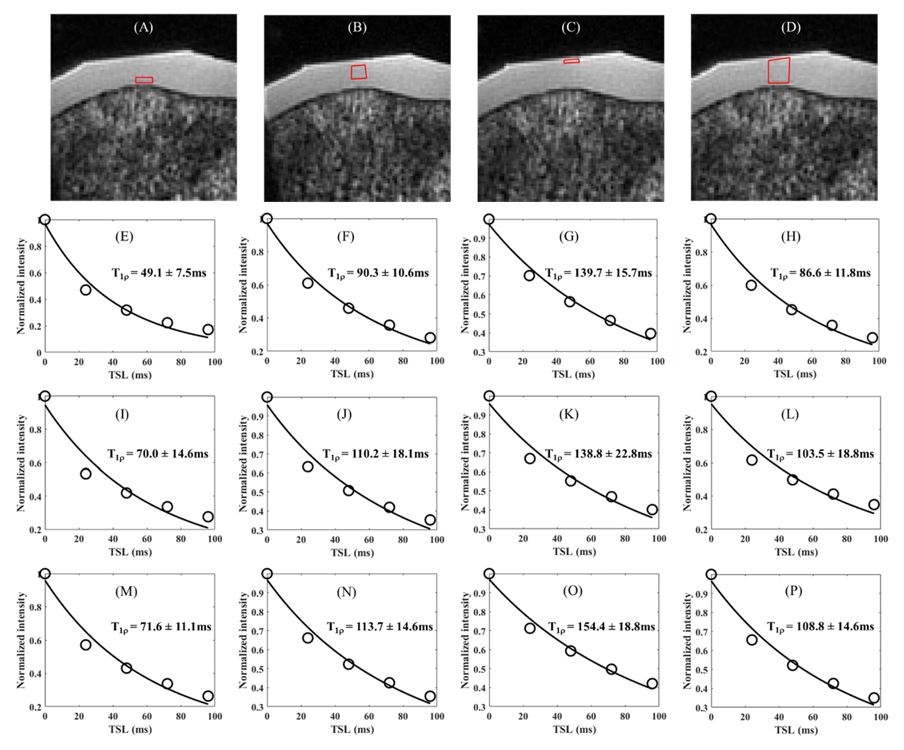
Figure 2 shows exponential fitting curves for a global ROI of a patellar sample oriented parallel, 55° and 90° to the B0 field using UTE-Cones-AdiabT1ρ, regular UTE-Cones T1ρ and UTE-Cones-T2* imaging, respectively. Again, AdiabT1ρ values show the smallest magic angle effect.
Figure 3 shows the magic angle behavior of UTE-Cones-AdiabT1ρ for the superficial, middle and deep layers of the patellar sample oriented parallel, 55° and 90° to the B0 field. AdiabT1ρ increases from the deep layer to the superficial layer for all angular orientations.
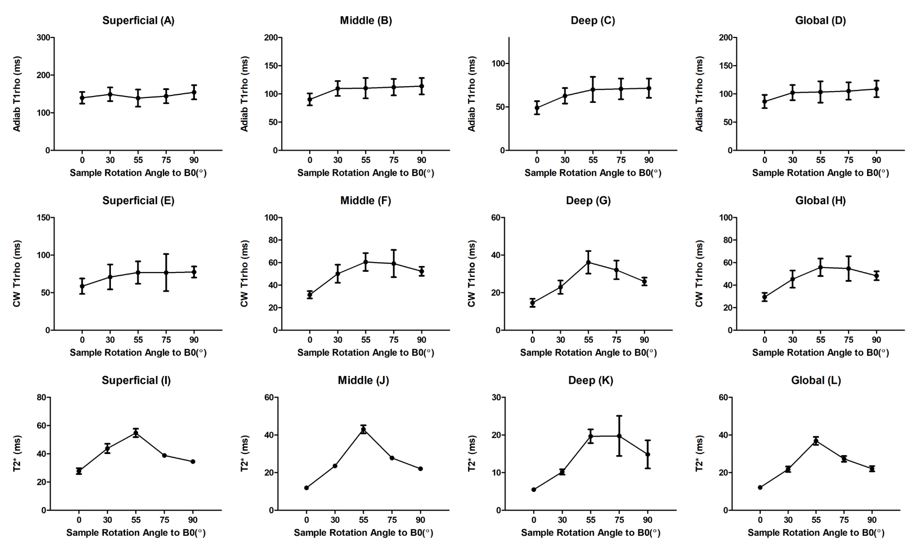
Figure 4 shows UTE-Cones-AdiabT1ρ profile, regular UTE-Cones-T1ρ profile and UTE-Cones-T2* profile for the superficial, middle and deep regions as well as a global ROI of the patellar sample. The UTE-Cones-AdiabT1ρ values show much reduced magic angle effect as compared to the regular UTE-Cones-T1ρ and UTE-Cones-T2*.
Figure 5 shows UTE-Cones-AdiabT1ρ profile, regular UTE-Cones-T1ρ profile and UTE-Cones-T2* profile for a human Achilles tendon sample. Much increased magic angle behavior was observed for the Achilles tendon for all the biomarkers. However, the UTE-Cones-AdiabT1ρ values still show the least angular dependence. The Achilles tendon has highly organized collagen fiber structure, representing the worst scenario in the magic angle study.
Conclusion
The 3D UTE-Cones-AdiabT1ρ shows much reduced magic angle effect as compared to regular T1ρ and T2*. The 3D UTE-Cones-AdiabT1ρ sequence may provide magic angle-insensitive evaluation of all the major knee joint tissues, thus providing a truly “whole-organ” approach for more accurate diagnosis of early OA.Acknowledgements
The authors thank the grant support from NIH (R01AR062581).References
1. Duvvuri U, Reddy R, Patel SD, Kaufman JH, Kneeland JB, Leigh JS. T1rho-relaxation in articular cartilage: effects of enzymatic degradation. Magn Reson Med 1997; 38:863-867.
2. Regatte RR, Akella SVS, Lonner JH, Kneeland JB, Reddy R. T1r relaxation mapping in human osteoarthritis (OA) cartilage: comparison of T1r with T2. J Magn Reson Imaging 2006; 23:547-553.
3. Li X, Han ET, Ma B, Link TM, Newitt DC, Majumdar S. In vivo 3T spiral imaging based multi-slice T1r mapping of knee cartilage in osteoarthritis. Magn Reson Med 2005; 54:929-936.
4. Mlynarik V, Szomolanyi P, Toffanin R, Vittur F, Trattnig S. Transverse relaxation mechanisms in articular cartilage. J Magn Reson 2004; 300-307.
5. Du J, Statum S, Znamirowski R, Bydder GM, Chung CB. Ultrashort TE T1rho magic angle imaging. Magn Reson Med 2013;69(3):682-687.
6. Shao H, Pauli C, Li S, Ma Y, Tadros AS, Kavanaugh A, Chang EY, Tang G, Du J. Magic angle effect plays a significant role in T1rho relaxation in articular cartilage. Osteoarthritis Cartilage 2017; 25:2022-2030.
7. Rautiainen J, Nissi MJ, Liimatainen T, Herzog W, Korhonen RK, Nieminen MT. Adiabatic rotating frame relaxation of MRI reveals early cartilage degeneration in a rabbit model of anterior cruciate ligament transection. Osteoarthritis and Cartilage 2014; 22:1444-1452.
8. Casula V, Autio J, Nissi MJ, Auerbach EJ, Ellermann J, Lammentausta E, Nieminen MT. Validation and optimization of adiabatic T1rho and T2rho for quantitative imaging of articular cartilage at 3T. Magn Reson Med 2017; 77:1265-1275.
9. Ma YJ, Carl M, Shao H, Tadros AS, Chang EY, Du J. Three‐dimensional ultrashort echo time cones T1ρ (3D UTE‐cones‐T1ρ) imaging. NMR Biomed. 2017;30.
10. Ma Y, Carl M, Searleman A, Lu X, Chang EY, Du J. Three dimensional adiabatic T1r prepared ultrashort echo time Cones (3D AdiabT1r UTE-Cones) sequence for whole knee imaging. Magn Reson Med 2018; 80:1429-1439.
11. Ma YJ, Lu X, Carl M, Zhu Y, Szeverenyi N, Bydder GM, Chang E, Du J. Accurate T1 mapping of short T2 tissues using a three-dimensional ultrashort echo time cones actual flip angle – variable TR (3D UTE-Cones AFI-VTR) method. Magn Reson Med 2018; 80:598-608.
12. Ma YJ, Zhao W, Wan L, Guo T, Searleman A, Jang H, Chang EY, Du J. Whole knee joint T1 values measured in vivo at 3T by combined 3D ultrashort echo time cones actual flip angle and variable flip angle methods. Magn Reson Med 2018 (in press).
Figures