1308
7T Arterial Spin Labeling Imaging of Epiphyseal Bone Marrow in Distal Femoral Condyle – A Feasibility Study1Radiology-Center for Magnetic Resonance Research, University of Minnesota, Minneapolis, MN, United States
Synopsis
Perfusion imaging of epiphyseal bone marrow in the distal femoral condyle can provide valuable insights into the pathophysiological mechanism of knee injuries or diseases, and has a great potential to facilitate the management of developmental knee diseases. A previous study at 3T indicated that low perfusion signal-to-noise ratio (SNR) imposed a great challenge to achieve high-quality bone marrow arterial spin labeling (ASL) images. 7T can benefit ASL imaging due to greatly increased blood T1 and imaging SNR. The presented study evaluated the feasibility and challenges of epiphyseal bone marrow ASL imaging in the distal femur at 7T.
Purpose
Perfusion imaging of epiphyseal bone marrow in the distal femoral condyle can provide valuable pathophysiological information about knee injuries (1-3) and new insight into underlying mechanisms of disease-induced biological changes. It also has a great potential to facilitate the management of developmental knee diseases, such as Juvenile Osteochondritis Dissecans (JOCD), where the capacity to heal may be related to sufficient perfusion to the lesion site and surrounding bone.
Unlike dynamic contrast-enhanced MRI (4), arterial spin labeling (ASL) is a non-contrast enhanced and non-invasive perfusion imaging method that obviates concerns of gadolinium toxicity and is therefore well-suited for longitudinal monitoring of knee disease progression, routine assessment of therapy response, and research studies in pediatric populations. A previous study at 3T indicated that low perfusion signal-to-noise ratio (SNR) imposed a great challenge to achieve high-quality bone marrow ASL images (5). Ultra high fields, (≥7T), can provide significant advantages for ASL perfusion imaging due to greatly increased blood and tissue T1 and imaging SNR. However, there are challenges for 7T imaging, including B0 and B1 inhomogeneity and high specific absorption rate (SAR) (6). The purpose of this study was to evaluate the feasibility and challenges of epiphyseal bone marrow ASL imaging in the distal distal femoral condyle at 7T.
Methods
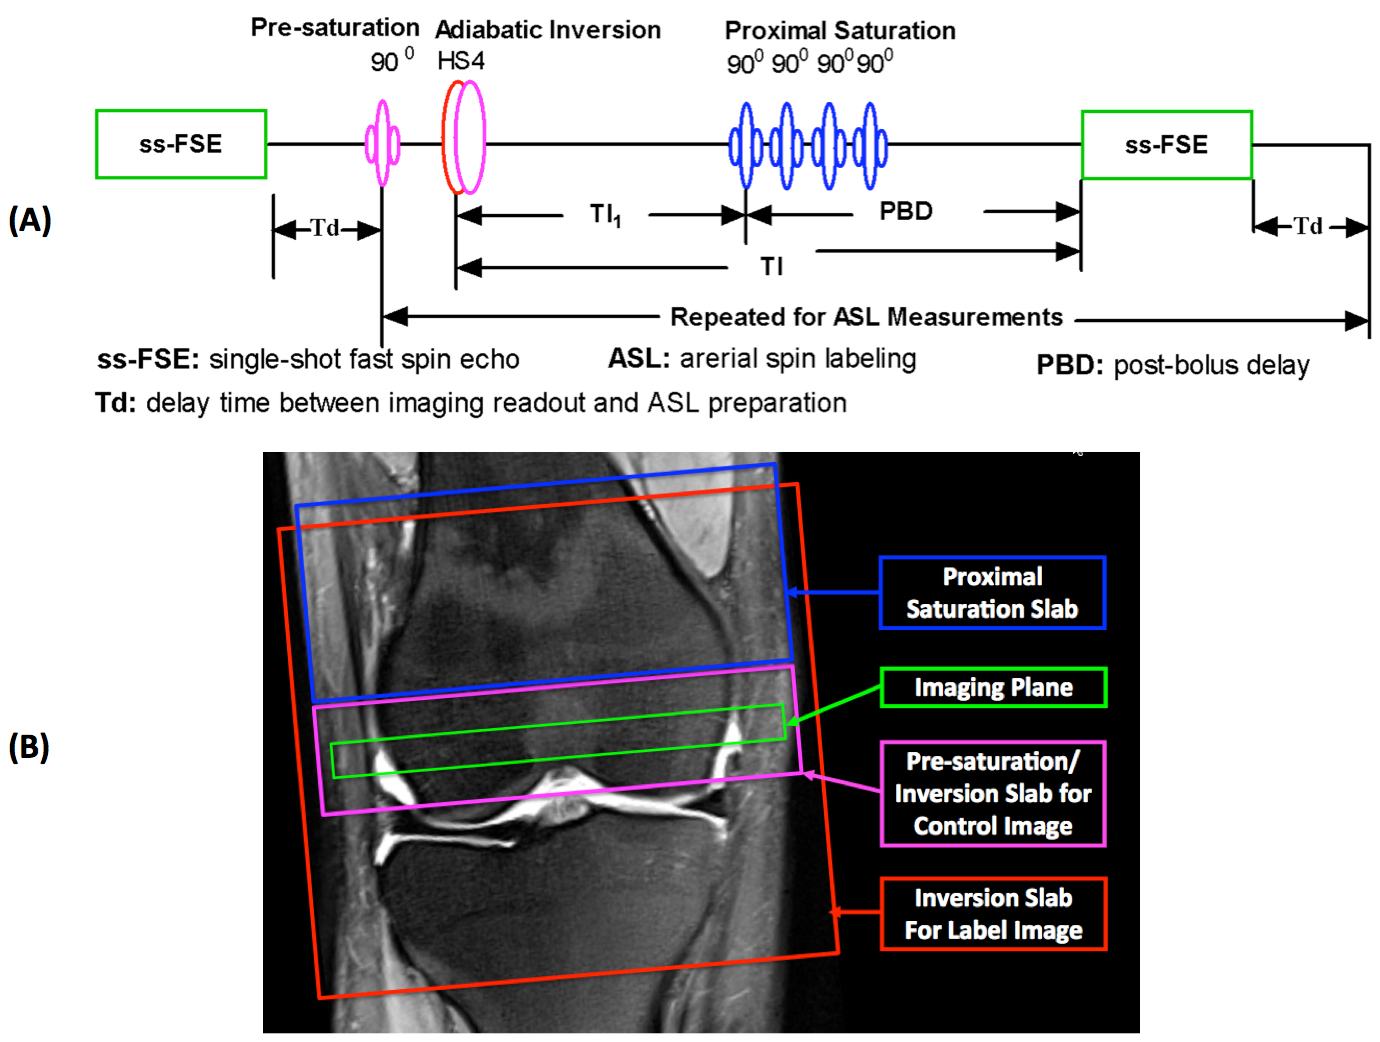
Seven healthy volunteers were recruited and provided written informed consent prior to imaging studies according to the local IRB approved protocol. Studies were performed on Siemens 7T whole body MRI scanner with a knee coil from Quality Electrodynamics LLC (QED, Mayfield Village, OH), which has 28 channels for signal reception and a single channel for RF transmission. After scout localizer and anatomic imaging scans, knee bone marrow perfusion imaging was performed using a flow-sensitive alternating inversion recovery (FAIR) method (7) with a defined temporal bolus width (8) for ASL and a single-shot fast spin echo (ss-FSE) method for image acquisition, referred to as FAIR ss-FSE (Figure 1A).
A single oblique transverse slice was utilized for the FAIR ss-FSE imaging acquisition (Figure 1B) with 2 x 2 x 10 mm3 resolution. For some subjects, perfusion imaging was also performed at a more proximal level with the image slice shifted up about 10 mm. The major knee perfusion imaging parameters were as follows: TR/TE = 5000/16 ms; parallel imaging acceleration factor = 4 with 24 reference lines; partial Fourier = 5/8; labeling time (TI1)/total delay time (TI) = 600/1200 ms; number of label and control images = 60; slab thickness/RF duration/interval of proximal saturation = 60 mm/25 ms/50 ms; and total imaging time = ~5 minutes. To facilitate perfusion SNR analysis, 200 noise images using the same protocol were acquired by turning off RF pulses (9).
Post-imaging processing, include 2D motion correction for ASL series, was performed using FSL toolbox. Bone marrow blood flow maps were calculated using a simplified single blood-compartment model (10). ROI-based analyses utilizing previous strategies (11) were performed within Matlab using ROIs manually defined on ASL control images (Figures 2 and 3). The spatial and temporal SNRs with a defined ROI were also obtained using the previous approach (9). Statistical analyses were performed using GraphPad Prism software.
Results and Discussion
Figures 2 and 3 show perfusion imaging results from typical subjects. Quantitative blood flow measurements, as well as perfusion spatial and temporal SNR estimates, from 7 subjects are shown in Figure 4. Our study results suggest that it is feasible to measure bone marrow blood flow at 7T with no SAR issue observed for perfusion imaging using a 5 s TR, and that the estimates of the bone marrow blood flow at 7T are comparable to previous measurements at 3T with higher perfusion spatial and temporal SNRs (Figure 4) (5). The blood flow measurements within regions containing cartilage and fluid were much lower than those within bone marrow (negative estimates are mainly due to extremely low perfusion SNR), suggesting that the estimates of blood flow within bone marrow have a dominant origin of intrinsic blood flow.
Inhomogeneous B0 and B1 fields (Figure 5) could affect the reliability of bone marrow blood flow measurements. Therefore, further technical development is necessary to overcome the observed issues. For example, utilizing a multi-channel transmit coil with dynamically applied B1 shims optimized separately for ASL and image readout will improve 7T ASL imaging (6). To address B0 issues, 3rd order shimming can be applied in the future (12).
Conclusions
It is feasible to perform epiphyseal bone marrow perfusion imaging using ASL method at 7T, and further technical development is needed to improve the reliability of blood flow estimates.Acknowledgements
R01AR070020, P41 EB015894, P30 NS076408, UMF0003900, and UL1TR000114, and K01AR070894. The content is solely the responsibility of the authors and does not necessarily represent the official views of the National Institutes of Health.References
1. Tsai PH, Lee HS, Siow TY, Wang CY, Chang YC, Lin MH, Hsu YC, Lee CH, Chung HW, Huang GS. Abnormal perfusion in patellofemoral subchondral bone marrow in the rat anterior cruciate ligament transection model of post-traumatic osteoarthritis: a dynamic contrast-enhanced magnetic resonance imaging study. Osteoarthritis Cartilage. 2016 Jan;24(1):12933.
2. Felson DT, McLaughlin S, Goggins J, LaValley MP, Gale ME, Totterman S, Li W, Hill C, Gale D. Bone marrow edema and its relation to progression of knee osteoarthritis. Ann Intern Med. 2003 Sep 2;139(5 Pt 1):330-6.
3. Findlay DM, Kuliwaba JS. Bone-cartilage crosstalk: a conversation for understanding osteoarthritis. Bone Res. 2016 Sep 20;4:16028.
4. J. Zuo, S. Majumdar, and X. Li. Perfusion abnormalities of bone marrow edema-like lesions in knees with anterior cruciate ligament injury using dynamic contrast-enhanced MRI. Proc. Intl. Soc. Mag. Reson. Med. 18 (2010): 802.
5. Li X, Johnson CP, and Ellermann J. Epiphyseal Bone Marrow Perfusion Imaging in the Distal Femur Using Arterial Spin Labeling: Feasibility and Challenges. Proc. Intl. Soc. Mag. Reson. Med. 25 (2017): 0852.
6. Li X, Auerbach EJ, Van de Moortele PF, Ugurbil K, Metzger GJ. Quantitative single breath-hold renal arterial spin labeling imaging at 7T. Magn Reson Med. 2018 Feb;79(2):815-825.
7. Kim SG, Tsekos NV. Perfusion imaging by a flow-sensitive alternating inversion recovery (FAIR) technique: application to functional brain imaging. Magnetic resonance in medicine : official journal of the Society of Magnetic Resonance in Medicine / Society of Magnetic Resonance in Medicine 1997;37(3):425-435.
8. Wong EC, Buxton RB, Frank LR. Quantitative imaging of perfusion using a single subtraction (QUIPSS and QUIPSS II). Magnetic resonance in medicine : official journal of the Society of Magnetic Resonance in Medicine / Society of Magnetic Resonance in Medicine. 1998;39(5):702-708.
9. Li X, Wang D, Auerbach EJ, Moeller S, Ugurbil K, Metzger GJ. Theoretical and experimental evaluation of multi-band EPI for high-resolution whole brain pCASL Imaging. NeuroImage 2015;106:170-181.
10. Buxton RB, Frank LR, Wong EC, Siewert B, Warach S, Edelman RR. A general kinetic model for quantitative perfusion imaging with arterial spin labeling. Magnetic resonance in medicine : official journal of the Society of Magnetic Resonance in Medicine / Society of Magnetic Resonance in Medicine 1998;40(3):383-396.
11. Li X, Sarkar SN, Purdy DE, Spence JS, Haley RW, Briggs RW. Anteroposterior perfusion heterogeneity in human hippocampus measured by arterial spin labeling MRI. NMR in biomedicine 2013;26(6):613-621.
12. Li X, Wang W, Moeller S, Ugurbil K, and Metzger GJ. Feasibility of Applying MB-EPI pCASL for High-Resolution Whole Brain Perfusion Imaging at 7T. Proc. Intl. Soc. Mag. Reson. Med. 22 (2014): 0995.
Figures