1304
Vertebral bone marrow fat content changes in postmenopausal women receiving combined aromatase inhibitor and bisphosphonate therapy after one year1Department of Diagnostic and Interventional Neuroradiology, Technical University of Munich, München, Germany, 2Department of Diagnostic and Interventional Radiology, Technical University of Munich, München, Germany
Synopsis
In recent years in-vivo assessment of vertebral bone marrow (VBM) fat composition has been increasingly used in the investigation of osteoporosis and bone metabolism. Postmenopausal women represent a population of particular interest because they are at higher risk for osteoporosis resulting from estrogen deficiency which can be potentially aggravated by aromatase inhibitor (AI) therapy. The present study demonstrated a relative increase in vertebral bone marrow fat content quantified by chemical shift encoding-based water-fat MRI in patients receiving simultaneous AI and bisphosphonate (BP) therapy, contradicting previous findings reported in the literature.
Purpose
Quantification of vertebral bone marrow (VBM) water–fat composition has been proposed as advanced imaging biomarker for osteoporosis associated fracture risk prediction1,2. Estrogen is known to play an important role in the pathogenesis of osteoporosis and estrogen deficiency is the primary reason for trabecular bone loss in postmenopausal women3,4. By reducing estrogen levels aromatase inhibitor (AI) therapy as part of breast cancer traetment can promote bone loss. The additional administration of bisphosphonates (BP) is recommended to counteract this adverse drug effect of AI therapy. The purpose of our study was to quantify VBM proton density fat fraction (PDFF) changes in the lumbar spine related to AI and BP treatment over a 12-month period using chemical shift encoding-based water-fat MRI (CSE-MRI) and magnetic resonance spectroscopy (MRS) as well as bone mineral density (BMD) changes using dual energy X-ray absorptiometry (DEXA).Methods
Subjects: 27 postmenopausal female estrogen receptor positive breast cancer patients (age = 63.3±6.4 years) receiving AI therapy were recruited for this study. Inclusion criteria were no history of chemotherapy or vertebral fractures. 5 subjects were lost to follow-up resulting in a total of 22 subjects completing the 1-year study. 14 subjects received AI and BP (zoledronic acid) therapy (AI+BP), 8 subjects received AI without BP therapy (AI).
MR Imaging and Spectroscopy: All subjects underwent 3T MRI (Ingenia, Philips Healthcare). An eight-echo 3D spoiled gradient-echo sequence was used for CSE-based water-fat separation at the lumbar spine using the built-in-the-table posterior coil elements (12-channel array). 8 echoes were acquired in a single TR using non-flyback (bipolar) read-out gradients and the following imaging parameters: TR/TE1/ΔTE = 11/1.4/1.1 ms, FOV = 220×220x80 mm3, acquisition matrix = 124×121, voxel size = 1.8x1.8x4.0 mm³, receiver bandwidth = 1527 Hz/pixel, frequency direction = A/P (to minimize breathing artifacts), 1 average, scan time = 1min 17s. A flip angle of 3° was used to minimize T1-bias effects. Additionally, all subjects underwent multi-TE STEAM MRS using the following parameters: TE1/ TE2/ TE3/ TE4 = 11/15/20/25 ms, TM = 16 ms, TR = 6000 ms, 8 averages per TE, 4096 sampling points, 5 kHz acquisition bandwidth. The 15x15x15 mm3 MRS voxel was placed in the L3, L4 or L5 vertebral body depending on vertebral body size and avoiding severe degenerative alterations and vascular structures.
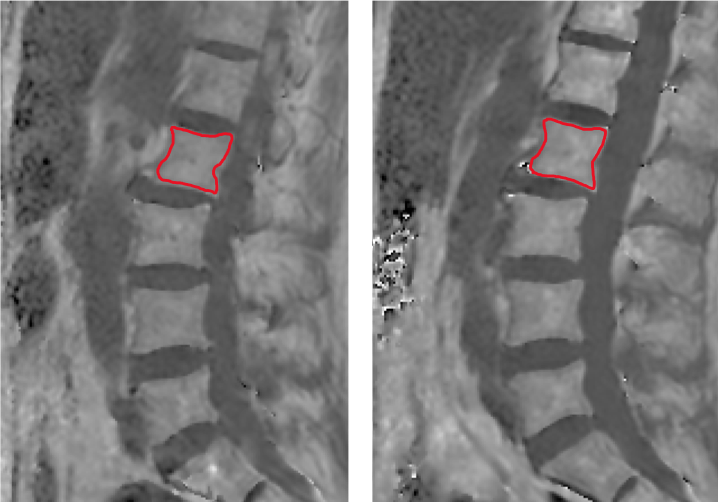
Fat Quantification: The gradient echo imaging data was processed online using the fat quantification routine of the vendor. The routine first performs a phase error correction and then a complex-based water–fat decomposition using a pre-calibrated seven-peak fat spectrum and a single T2* to model the signal variation with echo time and compute PDFF maps. Segmentation of the vertebral bodies L1-L5 was performed manually on the PDFF maps using the open-source software Medical Imaging Interaction Toolkit (Fig. 3). PDFF values were extracted at each vertebral level from L1-L5 and averaged for each subject. MRS spectra were fitted using dedicated in-house routines built with MATLAB5. PDFF was computed as the ratio of the T2‐corrected fat peak area over the sum of the T2‐corrected fat peak area and T2‐corrected water peak area. BMD measurements: All subjects underwent DEXA (Lunar Prodigy, GE Healthcare) of the lumbar spine measuring the average BMD of L1 to L4.
Results
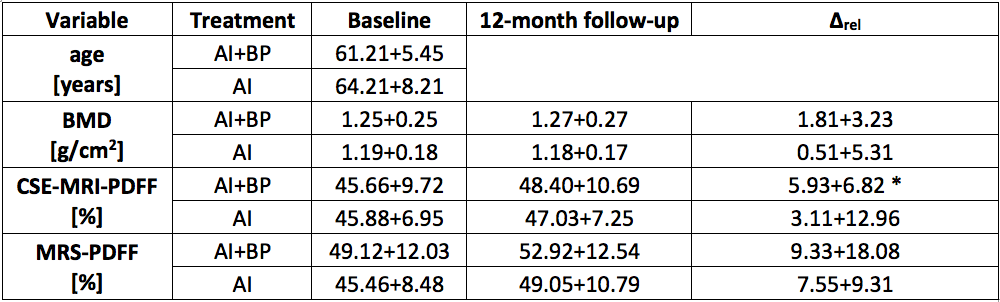
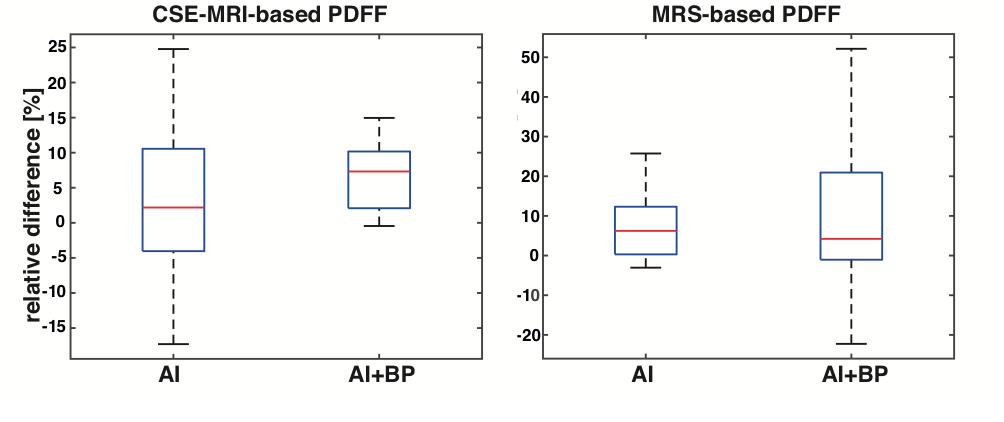
Baseline age, BMD, CSE-based PDFF and MRS-based PDFF showed no significant (p>0.05) difference between the two groups. There was a relative longitudinal increase (∆rel) in mean CSE-MRI-based PDFF averaged over L1-L5 in both groups (AI+BP: 5.93%; AI: 3.11%), however it was only significant (p=0.006) in the AI+BP group. There was also a relative longitudinal increase in mean MRS-based PDFF in both groups (AI+BP: 9.33%. AI: 7.55%), however not significant in either group (p>0.05). ∆rel of both CSE-MRI-based and MRS-based PDFF showed no significant difference between the two groups. There was no significant longitudinal change in BMD.Discussion & Conclusion
Over a 12-month period VBM PDFF assessed with CSE-MRI significantly increased in subjects receiving combined AI and BP therapy. The present results contradict previous results regarding the effect of only BP therapy on bone marrow fat content quantified by MRS6 as well as bone biopsies7. However, there is no previous study on the combined effect of AI and BP therapy on VBM fat after one year. The reported increase in VBM PDFF in subjects receiving combined AI and BP therapy was verified by MRS measurements. Increasing the number of subjects and performing additional follow-up measurements to assess longitudinal effects over a longer time period might help to further characterize the longer-term effects of combined AI and BP therapy on VBM PDFF.Acknowledgements
The present work was supported by the European Research Council (grant agreement No 677661 – ProFatMRI and grant agreement No 637164 – iBack), TUM Faculty of Medicine KKF grant H01 and Philips Healthcare. This work reflects only the author's view and the EU is not responsible for any use that may be made of the information it contains.References
- Patsch et al.: Bone marrow fat composition as a novel imaging biomarker in postmenopausal women with prevalent fragility fractures. J Bone Miner Res 2013; 28:1721.
- Schwartz et al.: Vertebral bone marrow fat associated with lower trabecular BMD and prevalent vertebral fracture in older adults. J Clin Endocrinol Metab. 2013; 98:2294.
- Riggs et al.: A Unitary Model for Involutional Osteoporosis: Estrogen Deficiency Causes Both Type I and Type II Osteoporosis in Postmenopausal Women and Contributes to Bone Loss in Aging Men. J Bone Miner Res. 1998; 13:763.
- Khosla et al.: The unitary model for estrogen deficiency and the pathogenesis of osteoporosis: is a revision needed? J Bone Miner Res. 2011; 26:441.
- Dieckmeyer et al.: The need for T₂ correction on MRS-based vertebral bone marrow fat quantification: implications for bone marrow fat fraction age dependence. NMR Biomed. 2015; 28:432.
- Yang et al.: Effect of zoledronic acid on vertebral marrow adiposity in postmenopausal osteoporosis assessed by MR spectroscopy. Skeletal Radiol. 2015; 44:1499.
- Duque et al.: Effects of risedronate on bone marrow adipocytes in postmenopausal women. Osteoporos Int. 2011; 22:1547.
Figures