1303
HIGH RESOLUTION IMAGING AND QUANTIFICATION OF VASCULATURE WITHIN CORTICAL BONE POROSITY USING DCE-MRI AND HR-pQCT1Radiology and Biomedical Imaging, University of California, San Francisco, San Francisco, CA, United States
Synopsis
Cortical bone porosity is a major determinant of bone strength. However, the causes of pathological pore growth are not well understood. The prevalence of blood vessels or marrow fat in pores may serve as an indicator for vessel- or marrow-driven processes. We present an algorithm to combine high resolution CT for pore identification and dynamic contrast enhanced MRI for blood vessel identification. Using this algorithm, imaged vessels are associated with specific pores and pore content is quantified.
Introduction
Cortical porosity is a major determinant of skeletal fragility1.Cortical porosity increases as a consequence of aging and disease, such as Type II Diabetes (T2D), negatively impacting bone strength2. However, the mechanisms driving pore growth are unknown. The purpose of this work was to determine the content of pores to investigate the mechanisms driving pathological pore growth. The prevalence of blood vessels or marrow fat within pores may serve as an indicator of vascular- or marrow-driven processes. We present a technique combining High Resolution peripheral Quantitative Computed Tomography (HR-pQCT; providing high resolution pore morphology) and Dynamic Contrast Enhanced MRI (DCE-MRI; providing vessel visualization) to analyze pore content. In our previous work, DCE-MRI was used to image vessels and quantify blood vessel density within cortical bone3. The purpose of the current study was to develop an analysis pipeline to associate imaged vessels with specific pores and to quantify the prevalence of vessel- and fat-filled pores.Methods
Imaging: In this UCSF IRB approved study, five volunteers (ages 61-70) were examined using HR-pQCT and DCE-MRI. Two anatomic regions in the tibia were investigated in each subject. For HR-pQCT, the XtremeCT scanner (Scanco Medical AG) was used with standard acquisition settings, producing data with an isotropic voxel size of 82 microns4. For MRI, a Signa 3T wide-bore system (GE Medical) was used. The DCE-MRI protocol was a spoiled gradient echo (SPGR) pulse sequence with TR/TE= 11.8/12.2 ms, bandwidth=±125 kHz/pix, flip angle=20°; FOV 12 cm; phase FOV=0.75, resolution 0.23 mm in-plane x 0.5 mm thickness. The contrast agent, Gadavist, was administered, 0.1ml/kg, intravenously at 2 ml/s. Using a high acceleration strategy5,6, data was reconstructed to 18 time points with 30 s temporal resolution (acceleration factor 9).
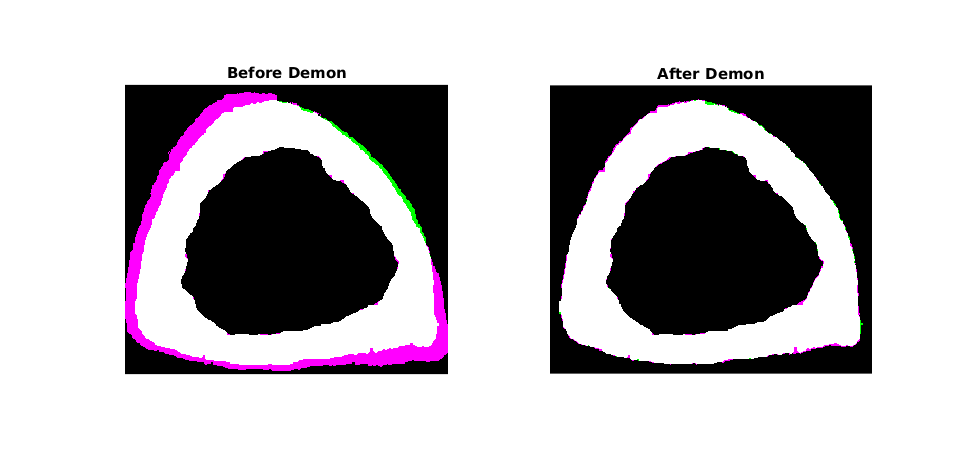
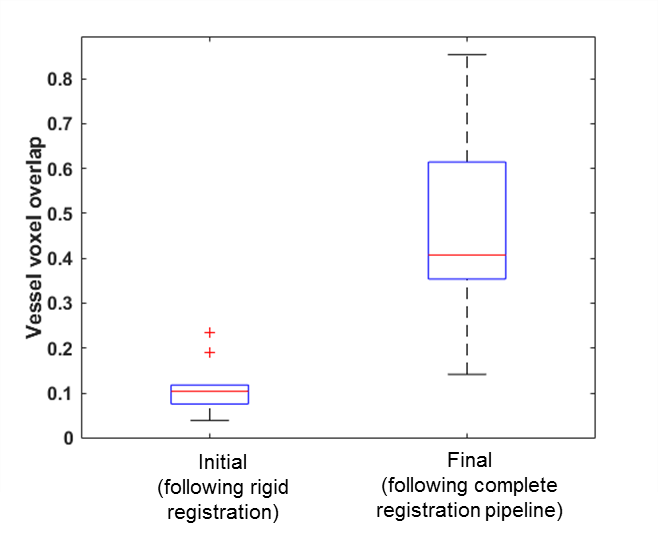
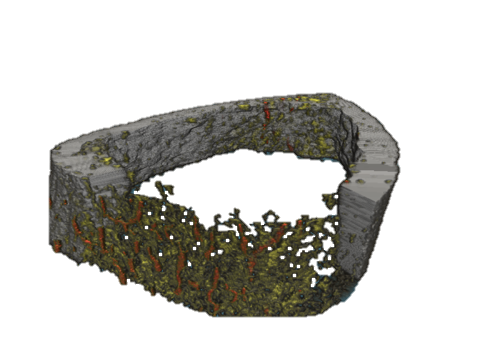
Image Processing: Cortical bone and pore maps were produced from CT data4 and blood vessel maps were produced from DCE-MRI data3 as previously reported. The aim for this study was to associate individual vessels with specific pores, therefore a precise registration pipeline between MRI and CT was required. Step one was to address warping in the SPGR reconstructions stemming from chemical shift or susceptibility artifacts. This was accomplished using a non-rigid Demons registration7 of the MRI cortical bone map (moving) to the CT cortical bone map (fixed) (MATLAB, Mathworks). Step two was to refine alignment of vessels to pores with a piecewise rigid registration. The final step was to trim the vessel map using the CT-based pore map to eliminate spurious blood vessel voxels. To assess the effectiveness of the imaging and registration pipeline, the proportion of vessel voxels overlaying pore voxels (prior to the final vessel mask trimming step) was calculated for all data sets. Following application of the entire imaging and registration pipeline to the in vivo data sets, the proportion of pores containing vessels (“vessel volume fraction” calculated as the ratio of vessel voxels to pore voxels) was calculated for each data set. Results for distal and ultra-distal tibia data were summarized separately and compared using a paired t-test.
Phantom: To assess resolution limitations of the vessel detection pipeline, a polymer cylinder with channels of varying diameters (500 to 100 microns) loaded with diluted contrast solution (Gadavist) was processed using the imaging and registration pipeline described above. Ratio of detected channel size to true channel size was calculated for each channel to test the minimum detectable vessel size.
Results
In vivo: The vessel identification and registration pipeline improved MRI to CT alignment of cortical bone (Fig. 1) as well as alignment of vessels and pores (Fig. 2, 3). The proportion of vessel voxels overlapping pore voxels improved from mean ± SD of 11% ± 6% (following the initial global rigid registration) to 46% ± 21% (following additional non-rigid and piecewise registrations). Vessel volume fraction was 0.06 ± 0.02 and 0.04 ± 0.01 for the distal and ultra-distal tibia regions, respectively (mean ± SD; p=0.04).
Phantom: Accurate channel size measurements were obtained to 250 micron diameter (size ratio = 1.00). Underestimated channel size was found for the 200 micron diameter channel (ratio = 0.25) and no contrast enhancement was detectable for the 100 micron channel.
Discussion and Conclusion
We have demonstrated proof of concept and presented preliminary data of the evaluation of cortical pore content by combined HR-pQCT and DCE-MRI. Proportion of pores containing vessels is significantly different for the two sites evaluated, suggesting this technique is sensitive to anatomic variation. Future work will include addressing spatial resolution limitations and applying this technique to ascertain differences among clinical populations, including T2D patients exhibiting pathological porosity.Acknowledgements
Funding support was provided by National Institutes of Health (NIAMS): R01AR069670 and R03AR064004.References
- Schaffler, MB, Burr BB. Stiffness of Compact Bone: Effects of Porosity and Density. J Biomech.1988; 21(1):13-6.
- Samelson EJ, Demissie S, Cupples LA, Zhang X, Xu H, Liu C-T, Boyd SK, McLean RR, Broe KE, Kiel DP, Bouxsein ML. Diabetes and Deficits in Cortical Bone Density, Microarchitecture, and Bone Size: Framingham HR-pQCT Study. Journal of Bone and Mineral Research. 2018;33(1):54–62. doi: 10.1002/jbmr.3240.
- Wu P, Liu J, Carballido-Gamio J, Han M, Krug R, Kazakia G. Cortical Bone Vessel identification on Contrast-Enhanced MR images, JOINT ANNUAL MEETING ISMRM-ESMRMB, Paris, France. 2018.
- Kazakia GJ, Tjong W, Nirody JA, Burghardt AJ, Carballido-Gamio J, Patsch JM, Link T, Feeley BT, Ma CB. The influence of disuse on bone microstructure and mechanics assessed by HR-pQCT. Bone. 2014;63:132–140.
- Liu J, Pedoia V, Heilmeier U, Ku E, Su F, Khanna S, Imboden J, Graf J, Link T, Li X. High-temporospatial-resolution dynamic contrast-enhanced (DCE) wrist MRI with variable-density pseudo-random circular Cartesian undersampling (CIRCUS) acquisition: evaluation of perfusion in rheumatoid arthritis patients. NMR Biomed. 2016;29(1): 15-23.
- Liu J, Saloner D. Accelerated MRI with CIRcular Cartesian UnderSampling (CIRCUS): a variable density Cartesian sampling strategy for compressed sensing and parallel imaging. Quant. Imaging Med. Surg. 2014;4(1): 57–67.
- Thirion JP. Image matching as a diffusion process: an analogy with Maxwell’s demons. Medical Image Analysis. 1988;2(3):243–260.
Figures